DETERMINATION OF OPTIMAL PDC CUTTERS GEOMETRY FOR
MULTI-RESPONSE OPTIMIZATION USING THE TAGUCHI METHOD
Amirul Aliff Bin Jamaludin, Shahrul Bin Kamaruddin, Abdul Rahim Bin Othman and Mohd Zulhilmi Paiz Ismadi
Department of Mechanical Engineering, Universiti Teknologi Petronas, Bandar Seri Iskandar, Perak, Malaysia E-Mail:[email protected]
ABSTRACT
Nowadays, polycrystalline diamond compact (PDC) cutters performance dropped and affects the performance of drilling efficiency. The objective of this project is to investigate the effect of PDC cutters geometry and optimize their geometry features. An intensive study in PDC cutters geometry would help complete the section with high penetration and low wear rate. Relatively deepened analysis was carried out and come out with four important geometries features that can help in improving the penetration and reduce wear rate. They are chamfer angle, back rake angle, side rake angle and diameter. An appropriate optimization method that effectively controls all influential geometries factors during PDC cutters manufacturing is therefore critical. By adopting L9 Taguchi OA, the simulation experiment is conducted by using explicit dynamics finite element analysis (FEA). A1B1C3D1 are identified as the optimal geometry. The set of optimum
geometries is identified as the following: chamfer angle of 15°, back rake angle of 0°, side rake angle of 30°, and diameter of 8 mm. The optimized PDC bit is expected to drill with high ROP that can reduce the rig time which in its turn, may reduce the total drilling cost.
Keyword: PDC cutter, geometry, penetration rate, wear rate, taguchi method and multi-response.
INTRODUCTION
Polycrystalline diamond compact (PDC) cutters have gained popularity in drilling for petroleum due to its long bit life together with its ability to maintain a high penetration rate together with an ability to resist wear. One of the greatest challenges that any PDC cutters manufacturer faces today is the extension of PDC cutters application into hard rock drilling, where impact damage, heat damage and abrasive wear of PDC cutters limits performance. Research and development have been focused on better understanding of cutters design with an intention to enhance drilling performance.
Designing a PDC bits with high penetration rate and longer cutter life is almost always the objective during PDC cutter design optimization. There is a number of published studies discussing the effect of PDC cutters design on performance of drilling operation. Knowlton [1] proposed a modified design of PDC cutter with positive rake angle which overcame the difficulties encountered in drilling shale formations. Other study, Gerbaud et al. [2] adding more complexities to cutter geometry and incorporating the chamfer made on some PDC cutters in their established model for better drilling efficiencies. Generally speaking, bit design optimization refers designing a PDC bit with the highest ROP efficiency and longest drilling life for given formation properties Therefore, to reduce this acrimonious condition, optimization technique normally applied to assist engineers in identifying the optimal design features during their manufacturing process. One of these efficient and simple optimization methods is the Taguchi method [3].
THE TAGUCHI METHOD
The Taguchi method, also known as “Robust Design”, was developed by Dr. Genichi Taguchi [4] and is extensively used to optimize the performance characteristics in manufacturing process through the setting of the design parameters. This method is also essential for designing high-quality systems and determining the optimum settings for the controllable parameters to make the product or process insensitive to noise factors [5]. The Taguchi method introduces an integrated approach that is simple and efficient for finding the best range of designs for quality, performance, and computational cost [6]. There are three stages applied in this method: (1) system design, (2) parameter design, and (3) tolerance design [7]. Of all the three, parameter design is often identified as the most crucial and dominant stage for process optimization [8]. In general, parameter design of the Taguchi method utilizes Orthogonal Array (OA), signal-to-noise (S/N) ratios, and ANOVA. Taguchi OA is a highly fractional orthogonal design used to estimate the main effects by only a few experimental or simulation runs. Thus, adopting OA can reduce research and development costs by simultaneously studying a large number of parameters instead of studying one parameter at a time as done in traditional methods [9]. Roy [10] further discussed the Taguchi concept.
leads to the minimization of property, which is sensitive to noise. The S/N ratio is quoted in dB units and can be defined as follows:
(1)
where MSD is the mean square deviation for the responses being studied. Consistent with its use in improving quality, the value of S/N is intended to be larger; hence, the value of MSD should be small. As there are three types of quality characteristics, the value of MSD is defined as follows:
For the smaller the better
(2)
For the nominal the better:
(3)
For the bigger the better:
(4)
where:
, and so on = experimental results, observations, or quality characteristics
= target value of results = number of repetition
However, most research based on the Taguchi method has been concerned with optimizing only a single response or quality characteristic. In reality, determining the superlative process parameters and focusing on multi-responses are intricate tasks but are generally required [12]. Based on this fact, the purpose of this paper is to develop a new constitutive approach to solve multi-response problems using the combination of single responses through the Taguchi optimization method. To demonstrate the significance of this approach, a single PDC cutter was used as a specimen.
Emphasis is given to the improvement of the penetration and wear rate properties of the PDC cutters using the proposed approach. By incorporating with finite element analysis (FEA), the experimental design uses OA L9 for the four controllable factors at three levels of
chamfer angle, back rake angle, side rake angle and diameter to find the optimum combination of factors and levels in the cutters manufacturing process. The significance of using the proposed approach as the optimization method to improve the penetration and wear rate of PDC cutters is evaluated. Finally, main graph plot is used to determine the optimal geometry combination that can simultaneously optimize both of penetration and wear rate.
Development of combination response by using taguchi method
The Taguchi method is a well-known technique that provides a systematic and efficient methodology for process optimization. Nevertheless, the Taguchi method has been widely used for solving single-response problems and cannot be used to optimize a multi-response problem. Nowadays, more than one quality response is considered for most industrial products. Therefore, this article proposes a new constitutive approach for multi-response problems. In the proposed approach, modification is conducted during the analysis phase. Normally, in the analysis phase, the S/N ratios are used in the Taguchi method to determine the optimal conditions for a single response only.
For example, if response A is studied with the smaller the better quality characteristic, the ratio for the response is as follows:
For the second single response B, the ratio is as follows:
where:
, and so on = experimental results, observations, or quality characteristics
= number of repetition
The traditional approach of the Taguchi method in analyzing the two single responses, A and B, is usually one separately and not simultaneously. To study the two responses A and B simultaneously, this article recommends the combination of single responses. This can be achieved by adding the values of each S/N ratio for response A and B as presented in the following equation:
(5)
where:
is the ratios for combining responses, is the value of th ratio for the single response being studied, and is the number of single response.For example, the combination response for the single responses A and B can be obtained as follows:
METHODOLOGY
The proposed combination response approach has been used to maximize penetration and minimize PDC cutters wear rate during drilling operation. The approach has also been used to determine the set of optimal cutters geometry or levels.
Specimen
For the finite element analysis, a single PDC cutter with diameters of Ø = 8mm, 13mm and 16mm diameter, 8mm height and 2mm diamond table thickness is used as a model and is shown in Figure-1. In this study, both of penetration and wear rate is simulated by using ANSYS explicit dynamic FEA model. The Initial Conditions folder includes a Pre-Stress object to control the transfer of data from an implicit static or transient structural analysis to the explicit dynamics analysis. Transferable data include the displacements or the more complete Material State (displacements, velocities, stresses, strains, and temperature) while the Analysis Settings include erosion, boundary condition and body interaction are defined under explicit dynamics.
Figure-1. Geometry and dimension of PDC cutter.
Angular velocity of 300 rpm is defined as initial condition. Other parameters such as force on top of the PDC bit, the constant angular velocity of PDC bit and fixed support of rock formation are inserted under analysis settings. In the real drilling situation, weight on bit (WOB) is the weight of the drill pipe up to the surface. This weight acting as a force to push the PDC bit into the rock formation. In this drilling simulation, the author defined the value of WOB as 100,000 Newton.
Geometry parameters and simulation
The aim of this study is to investigate the effects of geometry parameters on the drilling performance simulation model, rate of penetration (ROP) is selected as the quality characteristic for study. In this FEA simulation, four design features are selected according to previous investigations: chamfer angle, back rake angle, side rake angle and cutter diameter. The geometry parameters and level values are shown in Table-1. In this study, L9 (37)
OA is selected to represent the design of the experiment in the simulation experiment. OA is presented in Table-2.
Table-1. Geometry parameters and levels studied.
Table-2. L9 OA used in simulation experiment.
In Table-2, the trial numbers indicate the number of conducted simulations. In this study, 9 simulations are conducted and assigned as Trials 1–9. Factors A–D represent the geometry parameters: A for chamfer angle, B for back rake angle, C for side rake angle and D for cutter diameter (Table-1). All these factors are assigned to Columns 1–4. The results representing the ROP values are recorded in the final column. All the simulations are run as OA presented in Table-2 accordingly. In Trial 1, the simulation is conducted by a set of geometry parameters including chamfer angle (A) at 15°, back rake angle (B) at 0°, side rake angle (C) of 0° and chamfer angle (D) of 8 mm respectively.
RESULTSANDDISCUSSION
Single response analysis
and wear rate are denoted as S/N1(penet.) and S/N2(wear),
respectively.
Table-3. S/N ratio for single response.
Combination response analysis
The single responses of penetration rate and wear rate are studied simultaneously by combining all the values of S/N ratios. In this case, the combination responses are obtained by adding the values of S/N1(penet.)
and S/N2(wear) as presented in Equation. (5). Moreover, in
this study, the combination response of penetration rate and wear rate is assigned as S/N3(combined). As shown in
Table 3 and using trial no. 1 as example, the values of S/N ratio for penetration rate (denoted as S/N1(penet.)) and wear
rate (denoted as S/N2(wear)) are 62.24 dB and 30.12 dB,
[image:4.612.316.540.71.226.2]respectively. The addition of these S/N ratios gives the S/N ratio for the combination response equal to 92.36 dB. Table-4 lists the S/N ratios of the 9 trials for the combination response quoted in dB. Using the results of the single and combination responses in Tables-3 and Table-4, the optimal geometry or levels are determined further.
Table-4. S/N ratio for combined response.
Optimal cutter geometry and levels
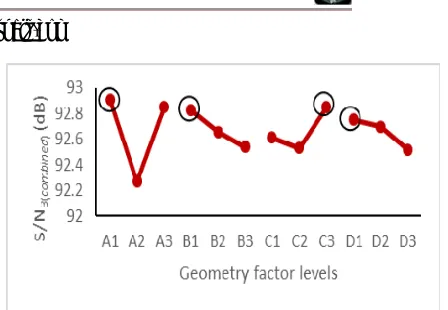
To determine the optimal geometry parameters for single and combination responses, the main effects of the results presented in Tables-3 and 4 are computed. Figure-2 shows the main effect plot for combined response.
Figure-2. Main effect plot for combined response.
The main effects graph clearly shows that the cutters geometry parameters critically affect the performance of PDC cutters. Each of the geometry parameters is dependent on each other. Any change in chamfer angle, back rake angle, side rake angle and cutters diameter leads to a significant improvement or degradation in penetration and wear rate of PDC cutters. Thus, optimizing all the influencing cutters geometry effectively is critically important. In this study, the larger the better quality characteristic is chosen in optimizing the cutters geometry parameters. The values of S/N ratio are intended to be large, where a high value of S/N ratio implies that the signal is much higher than the random effect of noise factors. The geometry with the highest S/N always yield the optimum quality with minimum variance [10]. Hence, in this study, the cutters geometry parameters with the highest S/N ratio result in a higher value of penetration rate and lower value of wear rate. All the optimal geometry parameters are highlighted in circles in Figure-2. For the combination responses (S/N3(combined)),
A1B1C3D1 are identified as the optimal geometry. The set
of optimum geometries is identified as the following: chamfer angle of 15°, back rake angle of 0°, side rake angle of 30°, and diameter of 8 mm.
CONCLUSIONS
The Taguchi method’s OA and main effects analysis was recommended as a way of efficiently optimizing the PDC cutters design in improving the penetration and wear rate for efficient drilling operation. By combining the responses to be studied, the results exhibited that the optimal combination of geometries for the PDC cutter to achieve maximum penetration rate and minimize wear rate was determined as A1B1C3 and D1.
ACKNOWLEDGEMENTS
[image:4.612.75.296.516.641.2]REFERENCES
[1] Knowlton, R.H. 1990, January. PDC bits using positive rake cutters. In SPE/IADC Drilling Conference. Society of Petroleum Engineers.
[2] Gerbaud, L., Menand, S. and Sellami, H. 2006, February. PDC bits: all comes from the cutter rock interaction. In IADC Drilling Conference. Society of Petroleum Engineers.
[3] Tsai, K.M., Hsieh, C.Y. and Lo, W.C. 2009. A study of the effects of process parameters for injection molding on surface quality of optical lenses. Journal of materials processing technology, 209(7): 3469-3477.
[4] Nellian, S. 1996. Integration of Taguchi design of experiments and finite element method for robust design. A Masters Project directed by prof. IAN R http://www.ecs.umass.edu/mie/labs/mda/fea/sankar/ch apter.
[5] Gaitonde, V.N., Karnik, S.R., Mata, F. and Davim, J.P. 2008. Taguchi approach for achieving better machinability in unreinforced and reinforced polyamides. Journal of Reinforced Plastics and Composites, 27(9): 909-924.
[6] Chang, T.C. and Faison, E. 2001. Shrinkage behavior and optimization of injection molded parts studied by the Taguchi method. Polymer Engineering & Science, 41(5): 703-710.
[7] Yang, W.P. and Tarng, Y.S. 1998. Design optimization of cutting parameters for turning operations based on the Taguchi method. Journal of materials processing technology, 84(1): 122-129.
[8] Antony, J. 2001. Simultaneous optimization of multiple quality characteristics in manufacturing processes using Taguchi's quality loss function. International Journal of Advanced Manufacturing Technology, 17(2): 134-138.
[9] Ozcelik, B. and Sonat, I. 2009. Warpage and structural analysis of thin shell plastic in the plastic injection molding. Materials & Design, 30(2): 367-375.
[10]Ranjit, R., 1990. A primer on the Taguchi method. van Nostrand Reinhold.
[11]Antony, J., Perry, D., Wang, C. and Kumar, M., 2006. An application of Taguchi method of experimental design for new product design and development process. Assembly Automation, 26(1), pp.18-24.
[12]Deng, W.J., Chen, C.T., Sun, C.H., Chen, W.C. and Chen, C.P., 2008. An effective approach for process parameter optimization in injection molding of plastic housing components. Polymer-Plastics Technology and Engineering, 47(9), pp.910-919.