BIROn - Birkbeck Institutional Research Online
Sammons, P. and Sylva, K. and Siraj-Blatchford, I. and Taggart, B. and
Smees, R. and Melhuish, Edward C. (2008) Influences on pupils’
self-perceptions in primary school: enjoyment of school,anxiety and isolation,
and self-image in year 5. Project Report. Institute of Education, London, UK.
Downloaded from:
Usage Guidelines:
Please refer to usage guidelines at or alternatively
Effective Pre-school and Primary
Education 3-11 Project (EPPE 3-11)
A longitudinal study funded by the DCSF
(2003 – 2008)
Influences on pupils' self-perceptions in primary
school: Enjoyment of school, Anxiety and Isolation,
and Self-image in Year 5
Address for correspondence:
EPPSE 3-14 Room G2
Institute of Education Tel: +44 (0)20 7612 6219
University of London Fax: +44 (0)20 7612 6230 / 0207 580 7568 15 Woburn Square Email: Brenda Taggart ([email protected]) London WC1H ONS EPPE website: www.ioe.ac.uk/projects/eppe
T
HE
EPPE
3-11
R
ESEARCH
T
EAM
Principal Investigators
Professor Kathy Sylva
Department of Education, University of Oxford
00 44 (0)1865 274 008 / email [email protected]
Professor Edward Melhuish
Institute for the Study of Children, Families and Social Issues Birkbeck University of London
00 44 (0)207 079 0834 / email [email protected]
Professor Pam Sammons
School of Education, University of Nottingham
00 44 (0)115 951 4434 / email [email protected]
Professor Iram Siraj-Blatchford
Institute of Education, University of London00 44 (0)207 612 6218 / email [email protected]
*Brenda Taggart
Institute of Education, University of London
00 44 (0)207 612 6219 / email [email protected]
Research Officers
Dr Stephen Hunt
Institute of Education, University of London 00 44 (0)207 612 6608 / email [email protected]
Dr Helena Jelicic
Institute of Education, University of London 00 44 (0)207 612 6608 / email [email protected]
Rebecca Smees
Institute of Education, University of London
00 44 (0)207 612 6608 / email [email protected]
Wesley Welcomme
Institute of Education, University of London
00 44 (0)207 612 6684 / email [email protected]
A
UTHORS
Pam Sammons
Kathy Sylva
Iram Siraj-Blatchford
Brenda Taggart
Rebecca Smees
Edward Melhuish
Acknowledgement
The EPPE 3-11 project is a major longitudinal study funded by the DCSF. The research would not be possible without the support and co-operation of the six Local Authorities (LAs) and the many pre-school centres, primary schools, children and parents participating in the research. We are particularly grateful to Wesley Welcomme for his contribution in preparing this report.
The views expressed in this report are the authors’ and do not necessarily reflect those of the Department for Education and Skills
Contents
Page number
Executive Summary i
Introduction 1
Background 1
Aims 1
Methods 1
Overview of the report 2
Section 1: Characteristics of the EPPE 3-11 sample at the end of Year 5 4
Section 2: Pupils’ self-perceptions and data analysis 8
Pupils’ self-perceptions at the end of Year 2 8
Pupils’ self-perceptions at the end of Year 5 10
Multilevel model estimates for Year 5 pupils’ self-perception outcomes 13
Section 3: Links between Child and Family Characteristics and Pupils’ self-perceptions
in Year 5 15
Differences in pupils’ self-perceptions for different groups of children 15
3.1 Child Measures 15
Gender 15
Birth weight 16
Language 16
Ethnicity 17
Health, behavioural and developmental problems and Special Education Needs (SEN) 18
Birth position 19
Age within the year group 20
3.2 Family measures 20
Socio-economic status (SES) and eligibility for free school meals (FSM) 20
Father’s qualification 20
Multiple Disadvantage 20
3.3 Home Learning Environment (HLE) 21
Early years Home Learning Environment (HLE) 21
Key Stage 1 (KS1) Home Learning Environment (HLE) 22
3.4 Relationship between pupils’ self-perceptions and other pupil outcomes 22 Relationships between pupils’ self-perceptions and attainment 22 Relationship between pupils’ self-perceptions and social/behavioural outcomes 24
Section 4: Pupils’ self-perceptions at the end of Year 5 in Primary School: The Impact of
Pre-school and Primary School 25
Testing the impact of different aspects of pre-school within the contextualised model 25
Pre-school provision versus no pre-school experience 25
The Impact of Pre-school Centre Effectiveness 26
The Impact of Primary School Effectiveness 27
The combined impact of pre-school experience and primary school effectiveness 27
Section 5: Changes in pupils’ self-perceptions over time: Value added analyses from
Year 2 to Year 5 28
Simple value added models 28
Complex value added model 29
The impact of Pre-school and Primary school 30
Section 6: Summary and Conclusions 32
The Impact of Child, Family and Home Learning Environment (HLE) Characteristics 33 The impact of attainment and Special Educational Needs (SEN) 34
Educational influences 35
Assessing changes in pupils’ self-perceptions over time 35 Overview and discussion of Findings on Home, Pre-School, and Primary School Influences on
Pupils’ self-perceptions in Year 5 36
Implications 36
References 38
Appendix 1: Percentage responses to Year 2 and Year 5 pupil questionnaires 42
Appendix 2: Descriptive analysis of the Year 2 Pupils’ self-perceptions data 45
Appendix 3: The exploratory and confirmatory factor analyses of the Year 2 Pupils’
Self-perceptions questionnaire 46
Appendix 4: Descriptive analysis of the Year 5 questionnaire data: ‘All About Me and My
School’ and ‘All About Me in Year 5’ 51
Appendix 5: The exploratory and confirmatory factor analyses of the Year 5 ‘All About
Me and My School’ and ‘All About Me in Year 5’ questionnaires 53
Appendix 7: Results of contextualised & Value Added multilevel analyses 59
Executive Summary
This report presents the results of analyses of pupils’ self-perceptions in primary school. It
is part of the longitudinal Effective Pre-school and Primary Education 3-11 (EPPE 3-11)
research project funded by the Department for Children, Schools and Families (DCSF).
The focus of this report is pupils’ self-perceptions in Year 5 (age 10) in four key areas:
‘Enjoyment of school’; ‘Academic self-image’; ‘Behavioural self-image’ and ‘Anxiety and
Isolation’. Reports on pupils’ cognitive and social/behavioural development at this age
have been published separately (Sammons et al., 2007a; 2007b).
The original EPPE sample was recruited to the study at age 3 years plus and monitored to
the end of Key Stage 1 (Year 2) in primary school. An additional ‘home’ sample of
children (who had not attended a pre-school setting) was recruited when the pre-school
sample started primary school. The EPPE 3-11 extension is following up the sample to
the end of primary school (age 11 years plus). In addition to exploring pre-school
influences, EPPE 3-11 research identifies the influence of primary school on a range of
pupils’ educational outcomes, as well as investigating any continuing pre-school effects.
EPPE 3-11 involves the collection and analysis of a range of data about pupils’
development, child, family and home learning environment (HLE) characteristics and the
characteristics of the schools attended. Additional value added measures of primary
school academic effectiveness have been derived from independent statistical analyses of
National data sets conducted for all primary schools in England (Melhuish et al., 2006) as
part of the study. These have been incorporated into the EPPE 3-11 child database to
provide indicators of the academic effectiveness of primary schools attended which
complement the measures on school settings. Thus, it is possible to explore both
pre-school and primary pre-school influences on pupils’ outcomes in Year 5.
Questionnaires were administered to children asking their views about school and
classroom life. These provided measures of pupils’ self-perceptions in Year 2 and again
in Year 5 in terms of ‘Enjoyment of school’, ‘Anxiety and Isolation’ and ‘Academic
self-image’ and ‘Behavioural self-self-image’. A range of statistical methods have been used to
investigate results for 2520 pupils for whom at least one self-perception outcome measure
was collected in Year 5.
The aims of the analyses were:
•
To explore the relationships between child, parent and home learning environment
(HLE) characteristics on pupils’ self-perceptions at the end of Year 5.
•
To explore pupils’ self-perceptions and change in self-perceptions over Key Stage 2.
•
To investigate any continuing impact of pre-school, including any variations in pupils’
outcomes for those who attended different types of pre-school (and those who
attended no pre-school provision i.e. ‘home’ children).
•
To explore relationships between measures of pre-school processes (e.g. quality or
effectiveness) on pupils’ later self-perceptions in primary school.
•
To investigate the influence of primary school academic effectiveness on
self-perceptions and change in self-self-perceptions (controlling for child, family and HLE
characteristics).
Key findings
The self-perceptions of 2520 children were measured in Year 2 (age 7) and Year 5 (age
10). Four factors (to be used as outcomes in subsequent analyses) at Year 2 and four at
Year 5 were identified after performing exploratory and confirmatory factor analysis on the
questionnaire data. Both questionnaires yielded robust measures of pupils’
self-perceptions.
Pupils’ self-perceptions in Year 2
The analysis of the Year 2 pupil questionnaire produced four pupils’ self-perception factors
that were used as outcomes. The first factor, ‘Enjoyment of school’, included items
reflecting how much pupils liked and found school interesting, liked individual subjects
(English, Mathematics and Science) and liked answering questions in class. The second
factor, ‘Behavioural self-image’, included items about pupils’ views of their own behaviour
in school. The third factor, ‘Academic self-image’, related to how clever or able pupils felt
they were. The last factor was ‘Alienation’, the degree to which the child feels tired, fed up
or/and angry at school. Appendix 3 shows the items that were found to be associated with
each of these dimensions.
Pupils’ self-perceptions in Year 5
The analyses of the Year 5 pupil questionnaires produced four pupils’ self-perception
factors or outcomes, most of them overlapping with the Year 2 measures. The first factor,
‘Enjoyment of school’, again reflected how much pupils liked and found school interesting,
liked individual subjects (English, Mathematics and Science), liked answering questions in
class, but also how much they felt they got tired and fed up at school. The second factor,
‘Anxiety and Isolation’, reflected how much pupils felt lonely, upset, worried or were bullied
at school. The third factor, ‘Behavioural self-image’, again related to pupils’ views of their
own behaviour in school. Lastly, the fourth factor, as in Year 2, ‘Academic self-image’,
reflected how clever or able pupils feel they are. Appendix 5 shows the items that were
found to be associated with each of these dimensions.
At a younger age (in Year 2, age 7) pupils were found to have generally more positive
self-perceptions than in Year 5 on all of the measures analysed. Pupils tend to report
enjoying school somewhat less as they get older although most still have positive views.
The results also suggest that ‘Academic self-image’ tends to decrease over time. In
addition the way they view their behaviour in school also becomes less favourable over
time. Nonetheless the majority of children still have fairly positive self-perceptions in Year
5. For example, fifty-four per cent of Year 2 pupils reported liking school ‘all the time’
compared to twenty-four per cent of Year 5 pupils. There are also differences in reports of
a) how happy they are at school (45% of Year 2 pupils report being happy at school ‘all
the time’ compared to 29% of Year 5 pupils), b) whether they feel they are less clever than
other pupils and c) are less likely to want to answer questions in class.
Table E.1 Year 2 and Year 5 views about school subjects Questionnaire Items Time point Responses
All of the time Most of the time Some of the time Never
% % % %
I like Reading/ English Year 2 Year 5 67 31 18 38 9 22 6 9
I like number work/ Mathematics Year 2 Year 5 58 43 22 28 12 18 8 9
I like Science Year 2 Year 5 55 31 24 30 12 27 8 12
I like Art Year 2 Year 5 85 79 10 14 3 5 2 2
I like P.E Year 2 Year 5 76 74 16 18 5 6 2 2
By Year 5, the degree of pupils’ ‘Enjoyment of school’ is found to be more closely
associated with their ‘Academic self-image’ and their ‘Behavioural self-image’
than was
the case in Year 2 (correlations rising from around 0.3 in Year 2 to 0.4 in Year 5). This
could reflect the changes in the ‘Enjoyment of school’ measure or possibly the changing
impact ‘Academic self-image’ and ‘Behavioural self-image’ has on their ‘Enjoyment of
school’.
The impact of child, family and home characteristics on pupils’ self-perceptions at
the end of Year 5
This report highlights the importance of a range of pupil, family and home learning
environment (HLE) characteristics that are related to pupils’ self-perceptions. An analysis
that contextualised pupils’ outcomes in terms of these characteristics was carried out.
The results show that taken together such child or family background factors have much
weaker relationships with pupils’ self-perceptions than with their academic outcomes (see
Sammons et al., 2007a), and also that relationships are generally weaker than those
found with different aspects of pupils’ social behaviour (Sammons et al., 2007b).
Pupil background
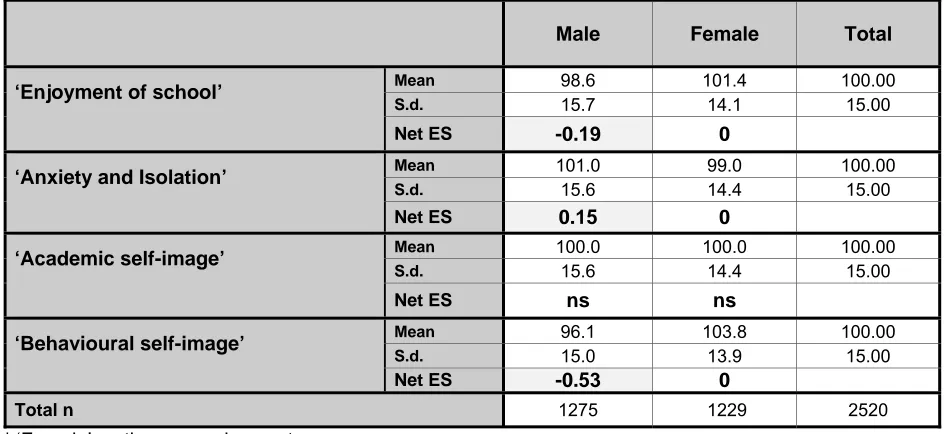
Girls’ self-perceptions are significantly different from boys’ in terms of their ‘Enjoyment of
school’, ‘Anxiety and Isolation’ and ‘Behavioural self-image’. These results suggest that
girls enjoy school more in Year 5 and tend to have a better ‘Behavioural self-image’ than
boys, but also tend to feel more anxious and isolated. However, boys and girls do not
differ significantly in terms of ‘Academic self-image’ at this age.
There were some differences related to ethnicity. Pupils of Indian and Pakistani heritage
reported enjoying school more than pupils of White UK heritage and Pakistani pupils also
had a higher ‘Academic self-image’. Pupils of Black Caribbean, Black African and ‘Any
other ethnic minority’ heritage also, on the whole, had a higher ‘Academic self-image’ than
pupils of White UK heritage. Pupils of Pakistani and Bangladeshi heritage, on the whole,
had a more positive ‘Behavioural self-image’ than the White UK pupils, whereas the Black
Caribbean pupils were found to have a lower ‘Behavioural self-image’. These differences
are statistically significant but given the small numbers must be interpreted with caution.
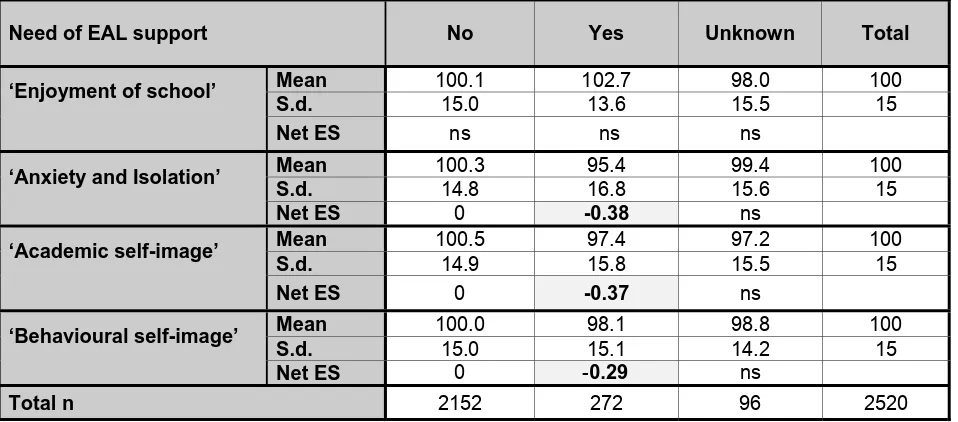
self-perceptions related to need for EAL support. Pupils who still needed support for EAL
in Year 5 reported higher levels of ‘Anxiety and Isolation’, lower ‘Academic self-image’ and
poorer ‘Behavioural self-image’ than children who did not need EAL support but there
were no significant differences related to ‘Enjoyment of school’. Pupils who had
previously been identified by their parents as having developmental problems at
pre-school also had significantly higher scores for the ‘Anxiety and Isolation’ measure in Year
5.
Pupils who had low birth weights reported higher levels of ‘Anxiety and Isolation’ at age 10
than pupils who had normal birth weight. However, pupils with very low birth weight had
higher ‘Behavioural self-image’ than pupils who had normal birth weight. Birth order also
showed some significant differences. Second born pupils (with one older sibling) reported
higher ‘Enjoyment of school’ than first born pupils (no older siblings), but second and third
born pupils showed poorer ‘Behavioural self-image’ than first born pupils.
Lastly, pupils who were older in the year group (autumn born) tended to have a better
‘Academic self-image’ than younger children within the year group. This is still the case
even when attainment level is taken into account (there is a well known association
between age in months and levels of attainment within a year group, hence the
development of age standardised tests). These results suggest that younger pupils may
be comparing themselves unfavourably to older classmates in terms of academic ability or
may receive less favourable feedback on their work.
Family background
Pupils eligible for Free School Meals (FSM an indicator of family poverty) reported that
they enjoyed school more but also have somewhat poorer ‘Behavioural self-image’ than
other children. This shows that the influences of social disadvantage appear to vary for
different outcomes.
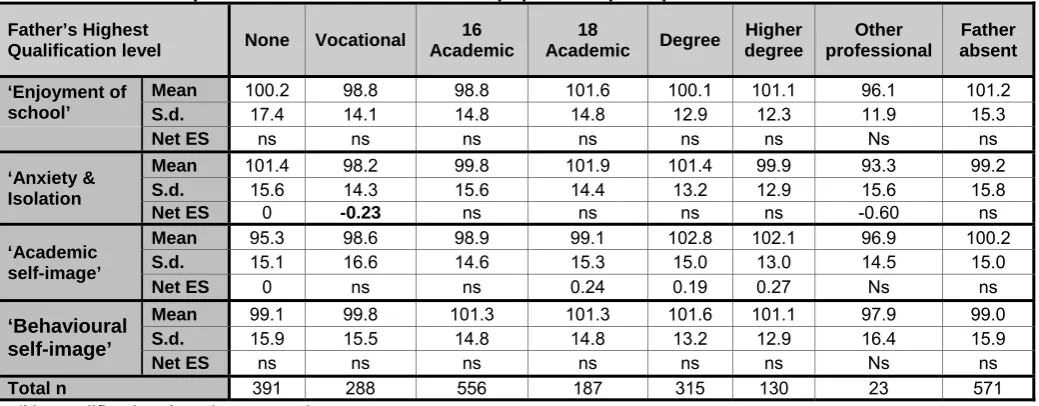
Pupils whose fathers have higher qualifications (18 academic, degree or higher degree)
tended to have higher ‘Academic self-image’ than pupils whose fathers had no
qualifications. By contrast children whose fathers have professional or vocational
qualifications were found to have significantly higher scores in terms of ‘Anxiety and
Isolation’ than pupils whose fathers had no qualifications.
Home learning environment (HLE)
The Early years home learning environment (HLE) has been found to be strongly
positively associated with cognitive and social/behavioural outcomes for the EPPE sample
at age 10 (Sammons et al., 2007a; 2007b). A positive association was found between
pupils’ Early years HLE scores (based on home learning activities measured at age 3 to 4)
and their ‘Academic self-image’ in Year 5. This may relate to the boost to academic
attainment and social behaviour, particularly ‘Self-regulation’, linked with higher Early
years HLE, that in turn benefits ‘Academic self-image’. This again confirms the
wide-ranging influence of Early years HLE on many aspects of pupils’ later development in
primary school.
‘Behavioural self-image’. Pupils’ ‘Enjoyment of school’ was the self-perception factor least
influenced by pupil background.
Table E.2: Summary of significant measures for contextualised Year 5 pupils’ self-perceptions
‘Enjoyment of school’
Variable Effect size Description
Gender Ethnicity Birth position 0.19 0.34/0.44 -0.16
Girls enjoy school more than boys
Indian and Pakistani pupils enjoy school more than White UK pupils Second born children enjoy school less than first born
Eligible for free school
meals (FSM) 0.26
Pupils eligible for FSM reported enjoying school more than those not eligible for FSM
‘Anxiety and Isolation’
Variable Effect size Description
Gender Birth weight Developmental problems
EAL support needed
0.15 0.29 0.16
0.38
Girls report being more anxious and isolated than boys Low birth weight pupils report being more anxious and isolated
Pupils who had Early developmental problems report being more anxious and isolated
Pupils who continue to need EAL support (Year 5) report being more anxious and isolated
Father’s qualification
0.23/0.60 Pupils whose fathers have vocational qualifications report being more anxious and isolated (compared to those with none)
‘Academic self-image’
Variable Effect size Description Ethnicity
Age within year group EAL
0.39/0.49/0.36 /0.32
0.15 0.37
Black Caribbean, Black African, Pakistani and ‘Any other minority’ pupils have higher ‘Academic self-image’ than White UK pupils
Older pupils have higher ‘Academic self-image’ Pupils with EAL have lower ‘Academic self-image’ Father’s qualifications
0.24/0.19/0.27
Pupils whose fathers have higher qualifications (18 academic, degree or higher degree) have higher ‘Academic self-image’ (compared to those who have none)
Early years HLE
0.24/0.18/0.19 All HLE index groups except bottom group have lower ‘Academic self-image’ than highest group
KS1 HLE: Outings
0.18/0.16 Pupils taken on less outings (low and moderate) had lower ‘Academic self-image’ than those taken on a very high number of outings
‘Behavioural self-image’
Variable Effect size Description Gender
Ethnicity
EAL support needed
Birth position Birth weight 0.53 0.4/0.42/ -0.24 0.29 -0.17/-0.13 0.43
Girls have better ‘Behavioural self-image’ than boys
Pakistani and Bangladeshi pupils have better ‘Behavioural self-image’ and Black Caribbean pupils have worse ‘Behavioural self-image’ than White UK pupils
Pupils who continue to need EAL support (Year 5) have poorer ‘Behavioural self-image’
Second and third born children have poorer ‘Behavioural self-image’ than first born children
Very low birth weight pupils have better ‘Behavioural self-image’ than pupils who had a normal birth weight
FSM
0.11 Pupils eligible for FSM have poorer ‘Behavioural self-image’ those not eligible for FSM
Early years HLE -0.12
0.16
Pupils who were read to several times a week during the pre-school period have poorer ‘Behavioural self-image’ in Year 5 than those whose parents read to them daily
Pupils who went to the library fortnightly during the pre-school period have better ‘Behavioural self-image’ in Year 5 than those who never went.
Relationships between pupils’ self-perceptions and academic attainment
Academic attainment is significantly associated with most pupils’ self-perception
measures. ‘Enjoyment of school’ was the only measure that did not relate significantly to
attainment in either Reading or Mathematics at the two time points. However, the majority
of the correlations in Year 2 were low (around 0.1), suggesting that the cognitive and
self-perception aspects of pupils’ development are not closely related. Other studies have
similarly shown that attainment and self-perceived measures are only weakly associated
(see Tymms, 2001). However, the link was more evident for ‘Academic self-image’ as
might be anticipated. By Year 5, the association between pupils’ ‘Academic self-image’
and their attainment in Reading and Mathematics has increased (to r=0.2), indicating that
pupils are more influenced by their own attainment when assessing their abilities at older
ages.
When the influence of pupils’ background characteristics was taken into account within a
multilevel analysis of the four Year 5 self-perception measures, earlier attainment in
Reading or Mathematics in Year 2 was found to be a significant predictor of later
self-perceptions for both ‘Academic self-image’ and ‘Behavioural self-image’. In addition,
better attainment in Mathematics was a significant predictor of lower self-reported ‘Anxiety
and Isolation’. Children with higher attainment were more likely to have a higher
‘Academic self-image’, lower levels of ‘Anxiety and Isolation’ and a somewhat better
‘Behavioural self-image’. There were similar findings when prior attitude as well as pupil
background was also taken into account in the analyses.
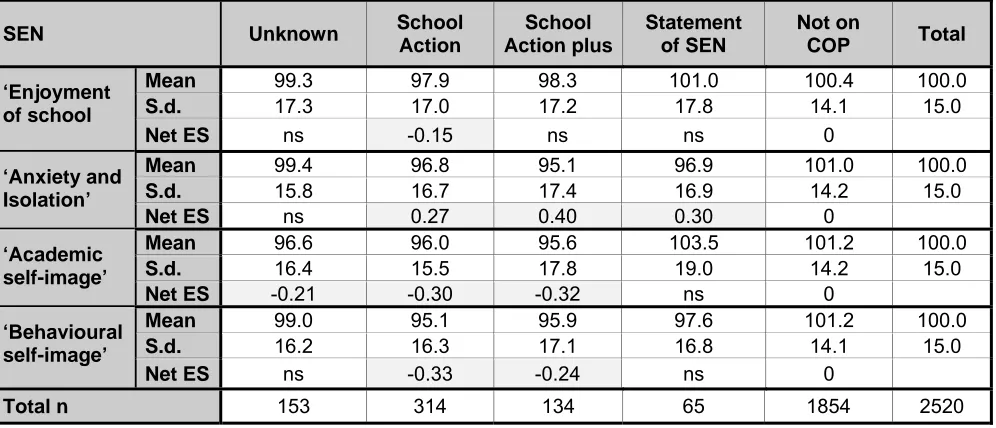
Relationships between pupils’ self-perceptions and Special Educational Needs
Pupils who had ever been identified as having a special educational need (SEN) at school
generally had less favourable self-perceptions. When a pupils’ Year 5 position on the
SEN code of practice was taken into account, pupils within the SEN process (School
Action or School Action Plus) had more negative self-perceptions and school experiences.
However, pupils who had a full
1statement of SEN had similar self-perceptions to pupils
not on the SEN register for ‘Enjoyment of school’ and ‘Behavioural self-image’. When
their actual attainment was taken into account, children with a full statement actually had a
relatively higher ‘Academic self-image’ than all the other groups of children, including
children without any kind of special need. This suggests that the identification and
additional support they are receiving may perhaps benefit their ‘Academic self-image’.
Changes in pupils’ self-perceptions over time
Multilevel value added analyses were conducted for the four Year 5 pupils’
self-perceptions
factors using them as outcomes in order to explore changes in pupils’
self-perceptions, (sometimes called ‘progress’) from Year 2 to Year 5. For these analyses the
contextualised multilevel models included measures of pupils’ prior self-perceptions,
collected at Year 2 in addition to the background factors presented above. These
analyses were undertaken to explore whether the child, family and HLE characteristics,
found to be significant in predicting aspects of pupils’ self-perceptions measured at the
end of Year 5 were also associated with differential progress or change in these
self-perceptions between Year 2 and Year 5 of primary school education.
The generally weak relationships found between pupils’ prior self-perceptions (Year 2) to
those in Year 5 may be in part a reflection of the high fluctuation in pupils’ self-perceptions
that seems to be occurring over time (this may reflect measurement difficulties or real
1 A full statement of SEN legally requires additional support to be made available to the pupil (often on a
changes in a pupils’ views and feelings). For example, when individual questions were
analysed that were identically worded at the two time points, the highest correlation was
found for the question ‘I behave in class’ (0.29), the lowest correlation was for ‘I am
horrible to other children’ (0.02). Overall pupils’ self-perceptions show greater variability
and are less stable than measures of their cognitive and social/behavioural outcomes.
Thus we find that correlations between pupils’ self-perceptions in Year 2 and Year 5 are
relatively low compared to those for attainment or social behaviour across years
(‘Enjoyment of school’ r=0.20, ‘Academic image’ r=0.16, ‘Behavioural
self-image’=0.28).
As well as assessing differences in pupils’ self-perceptions in Year 5, changes in pupils’
self-perceptions from Year 2 to Year 5 were explored. Self-perceptions in Year 2 were
used as a baseline, to assess the degree of change over the three year period. Where
the corresponding measure was available, this proved to be the best predictor of later
self-perceptions, although it usually accounted for only a small proportion of total variance in
the Year 5 measure, reflecting the lower correlations.
Pre-school quality and school effectiveness
Continuing pre-school influences
There was some evidence of a continued pre-school influence upon pupils’ later
self-perceptions, although the influence is relatively weak. The ‘educational’ quality of the
pre-school (measured by the ECERS-E, Sylva et al., 2006; Sylva, Siraj-Blatchford & Taggart,
2006) was more likely to give a boost to pupils’ subsequent ‘Enjoyment of school’
compared to children who attended a low quality pre-school (ES=0.18, p<0.05). However,
there were no significant differences between children who had attended high quality
pre-school and ‘home’ children on these outcomes. Likewise just attending or not attending a
pre-school setting did not appear to have any lasting impact on pupils’ self-perceptions at
age 10. There was some evidence that children who attended pre-schools with higher
scores for the ‘care’ quality of staff interaction and care routines (ECERS-R, Harms et al.,
1998) had a higher ‘Behavioural self-image’ in Year 5 (care interactions ES=0.10, care
routines ES=0.13).
All four indicators of pre-school centre effectiveness, measured in terms of promoting
pupils’ earlier social behaviour, were tested to see if they had any continuing impact on
EPPE 3-11 pupils’ later self-perceptions in Year 5. For ‘Academic self-image’ there were
significant differences between the ‘home’ children and those who had attended
pre-schools highly effective in reducing ‘Anti-social’ behaviour, but no significant differences
were seen for any other outcomes. These findings are in contrast to results for academic
outcomes and social/behavioural outcomes in Year 5 where pre-school effectiveness
measures still showed a significant positive influence (Sammons et al., 2007a; 2007b).
Primary school academic effectiveness (value added)
Multilevel analyses revealed statistically significant school-level variance (Year 5) in
pupils’ self-perceptions and changes in self-perceptions, even when account is taken of
pupil intake differences and pupils’ prior self-perceptions in Year 2.
complex value added model). The school level variation for ‘Behavioural self-image’ and
‘Anxiety and Isolation’ was lower at only three per cent for both the contextualised models
and four per cent and five per cent respectively for the value added models. These results
suggest that individual primary schools have more influence on pupils’ self-perceptions in
terms of ‘Enjoyment of school’ and ‘Academic self-image’ than on their ‘Anxiety and
Isolation’ and ‘Behavioural self-image’. As many of the primary Year 5 schools had only
one EPPE pupil in attendance, the school level variation from this analysis should be
interpreted with caution. Nonetheless, an additional analysis of the non-EPPE 3-11 case
study children with an average class size of 22 found very similar intra-school correlations
providing stronger evidence for a ‘school effect’ on pupils’ self-perceptions and again
indicating greater variation for the ‘Enjoyment of school’ outcome.
National assessment data for all primary schools in England for three cohorts (2002-2004)
were used to create value added measures of the primary schools’ academic
effectiveness for English, Mathematics and Science (Melhuish et al., 2006). These
effectiveness measures were then linked to the 990 plus primary schools attended by
EPPE 3-11 pupils. They were found to be significant predictors of better academic
outcomes for pupils in the sample, and also better outcomes in terms of ‘Self-regulation’
and reduced ‘Anti-social’ behaviour. By contrast, pupils’ ‘Enjoyment of school’, ‘Anxiety
and Isolation’ and ‘Academic self-image’ were not significantly associated with the
academic effectiveness of the primary school attended. The data do however show that
those who attended more academically effective primary schools tend to have more
positive ‘Behavioural self-image’
Summary and Implications
Pupils’ self-perceptions are important as developmental outcomes in their own right, and
there is a growing body of research that is beginning to address this topic (Marsh et al.,
1985; Marsh & Hau, 2003; Marsh et al., 2006; Openakker & Van Damme, 2000; Smees &
Thomas, 1999; Sainsbury & Schagen, 2004; Tymms, 2001). This report complements the
analyses of cognitive and social/behavioural outcomes in Year 5 reported elsewhere
(Sammons et al., 2007a; 2007b). A number of distinct self-perceptions can be identified
based on pupils’ self reports in primary school in both Year 2 and Year 5. These
measures are relevant to policy particularly the Excellence and Enjoyment agenda,
because they relate to pupils’ self reported levels of ‘Enjoyment of school’ as well as their
‘Academic self-image’ and ‘Behavioural self-image’ and feelings of ‘Anxiety and Isolation’.
Encouragingly, most children have very favourable self-perceptions in Year 5, although in
line with other research these self-perceptions tend to be somewhat less positive for older
pupils (Year 5 versus Year 2); pupils’ ‘Academic self-image’ tends to reduce with age.
This suggests that teachers could give more attention to providing positive feedback
(Williams & Black, 1999) and encouragement in the later primary years to boost
‘Academic self-image’ (Bandura, 1978; 1986; Marsh & Yeung, 1997).
The evidence presented in this report suggests that there is significant variation between
schools in terms of their pupils’ self-perceptions, especially for ‘Enjoyment of school’ and
‘Academic self-image’.
‘Anxiety and Isolation’ showed the least amount of variation
between schools, only just reaching statistical significance.
indicating that more favourable cognitive outcomes tend to be associated with more
positive self-perceptions at the child level.
Overall, the results reveal that girls tend to have more favourable self-perceptions in terms
of ‘Enjoyment of school’ and ‘Behavioural self-image’ in Year 5. However, there are no
gender differences for ‘Academic self-image’, although girls are more likely to have higher
scores for ‘Anxiety and Isolation’. Pupils requiring support for English as an additional
Language (EAL) showed higher ‘Anxiety and Isolation’, and poorer ‘Academic self-image’
and ‘Behavioural self-image’. These findings suggest that the impact of difficulties related
to EAL (needing extra support in school) on a pupil may extend beyond attainment to
self-perceptions. The results show that older children in the year group have a more positive
‘Academic self-image’, which is not just a function of their higher average attainment.
Older children in many classes may find the curriculum and demands of school easier
than younger children and as a consequence may compare themselves more favourably
with younger children in the classroom. They are also likely to get more favourable
feedback from class teachers who are unlikely to consider the impact of age within a year
group especially in Key Stage 2. In earlier analyses (Sammons et al., 2004) we found that
significantly more of the summer born children in the EPPE sample (34%), than of autumn
born (21%), were identified as having some form of SEN during Key Stage 1. This could
have a long lasting impact on young for their year (summer born) pupils’ ‘Academic
self-image’. The findings suggest that reliance on teacher assessment may disadvantage
some pupil groups (e.g. summer born).
The results also support the finding in academic and social/behavioural analyses that a
better Early years home learning environment (HLE) has a protective influence on later
outcome via its relationship to higher ‘Academic self-image’ and ‘Behavioural self-image’.
Pupils of fathers with higher (academic) qualifications also have higher ‘Academic
self-image’.
A number of pupil and family background indicators of disadvantage are related to lower
self-perceptions and this is in line with findings for both cognitive and social/behavioural
outcomes. These results again confirm that young children from disadvantaged
backgrounds are at a higher risk of poor all round development. Ways of addressing the
educational consequences of disadvantage and targeting interventions to such groups
and communities are needed from a young age to ameliorate the adverse consequences
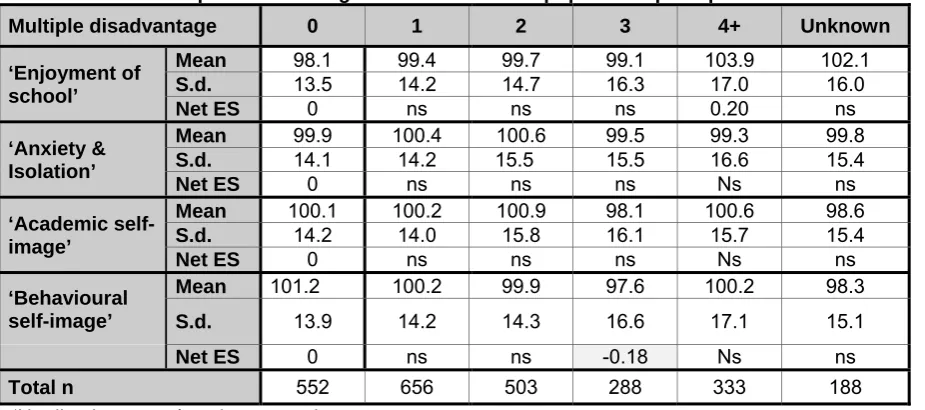
on longer term outcomes. One important exception to this is the positive link between
family disadvantage (FSM, Multiple disadvantage index) and greater ‘Enjoyment of school’
where pupils eligible for FSM reported more ‘Enjoyment of school’. This may be the result
of poorer home circumstances and pupils who view school as a more pleasant place to be
by comparison.
Pupils with a special educational need (SEN), especially those without a
statement of SEN, appear to be more vulnerable than other pupils on all outcomes;
however, this not the case for ‘Enjoyment of school’.
As well as exploring differences between pupil groups, the change in pupils’
self-perceptions was examined across Key stage 2. There was a great deal of fluctuation,
much greater than found for the cognitive and social/behavioural outcomes reported
elsewhere (Sammons et al., 2007a; 2007b). This is not unusual when studying
self-perceptions but where prior self perception measures were available they proved to be the
best predictor of later self-perceptions. The high fluctuation in pupils’ self-perceptions
makes change in self-perceptions more difficult to measure and interpret.
These findings also provide some evidence of continuing pre-school influences on later
outcomes in Year 5, although results are weaker than those found for cognitive and
social/behavioural outcomes. Overall attending pre-school versus not attending was not
associated with any of the pupils’ self-perceptions studied, nor did age at starting
pre-school show an impact. However, children who had previously attended pre-pre-school full
time had higher levels of enjoyment of primary school at age 10.
There were some differences related to pre-school quality with those pupils who had
attended low quality pre-school showing slightly lower levels of ‘Enjoyment of school’ than
the ‘home’ children. Those pupils who had attended low quality also showed poorer later
outcomes in terms of ‘Anxiety and Isolation’ by age 10, than those pupils who had
attended high quality pre-school. Again these results suggest that poor quality pre-school
(experienced by around 14% of the EPPE 3-11 sample) is not likely to confer long term
benefits. This finding is generally in line with results of similar analyses of EPPE 3-11
pupils’ academic and social/behavioural outcomes in Year 5 (Sammons et al., 2007a;
2007b).
All EPPE 3-11 indicators of pre-school centre effectiveness in terms of promoting pupils’
earlier social behaviour, as well as five indicators of pre-school centre effectiveness in
terms of promoting pupils’ earlier cognitive attainment, were tested for continuing impact
on pupils’ perceptions. There were only significant differences for ‘Academic
self-image’ between the ‘home’ children and those who had attended pre-schools that were
highly effective in reducing ‘Anti-social’ behaviour. For ‘Academic self-image’, when
change over Key stage 2 was investigated there were significant differences between
‘home’ children and children who had attended highly effective pre-schools for all the
social/behavioural measures of effectiveness. This suggests that highly effective
pre-schools boost the development of later ‘Academic self-image’ and that ‘home’ children are
at a disadvantage in comparison.
Introduction
This report presents analyses of pupils’ self-perceptions within the longitudinal Effective Pre-school and Primary Education 3-11 (EPPE 3-11) research. The study is funded by the Department for Children, Schools and Families (DCSF). This report focuses on pupils’ self-perceptions in four key areas: ‘Enjoyment of school’, ‘Academic self-image’, ‘Behavioural self-image’ and ‘Anxiety & Isolation’ in Year 5 (age 10). Results from analyses of pupils’ cognitive and social/behavioural development at this age are reported separately (Sammons et al., 2007a; Sammons et al., 2007b). The original EPPE pre-school child sample was recruited to the study at age 3 years plus and their attainment and developmental progress was monitored to the end of Key Stage 1 (Year 2) in primary school. An additional ‘home’ sample of children (who had not attended a pre-school setting) was recruited when the pre-school sample started primary school. The EPPE 3-11 research is designed to identify the influence of primary school on a range of pupils’ educational outcomes, as well as to investigate any continuing pre-school effects and follows the sample across Key Stage 2 up to age 11 years.
Background
EPPE 3-11 involves the collection and analysis of a wide range of data about pupils’ development, child, family and home learning environment (HLE) characteristics and the characteristics of the pre-school centres and primary pre-schools attended. Additional value added measures of primary pre-school academic effectiveness have been derived from independent statistical analyses of National assessment data conducted for all primary schools in England (Melhuish et al., 2006). These have been incorporated into the EPPE 3-11 child database to provide indicators of the academic effectiveness of the primary school a child attends and complement the measures collected earlier on the quality and effectiveness of the pre-school setting attended. Thus, it is possible to explore both pre-school and primary school influences on pupils’ developmental outcomes in Year 5 separately and jointly.
Questionnaires were designed to explore pupils’ self-perceptions and views about school and classroom life. These provide self-report measures of pupils’ self-perceptions and views of school in Year 2 and again in Year 5 using age appropriate items and wording. A range of statistical methods have been used to investigate results for 2520 children for whom sufficient data were collected to create measures for at least one self-perception outcome in Year 5, representing 85 per cent of the EPPE 3-11 pupils for whom valid baseline data had been collected on pupils’ self-perceptions in Year 2.
Aims
The aims of the analyses were:
• To explore the relationships between child, parent and home learning environment (HLE) characteristics on pupils’ self-perceptions at the end of Year 5.
• To explore pupils’ self-perceptions and change in self-perceptions over Key Stage 2.
• To investigate any continuing impact of pre-school, including any variations in pupils’ outcomes for those who attended different types of pre-school (and those who attended no pre-school provision i.e. ‘home’ children).
• To explore relationships between measures of pre-school processes (measures of quality and effectiveness) on pupils’ later self-perceptions in primary school.
• To investigate the influence of primary school academic effectiveness on self-perceptions and change in self-perceptions (controlling for child, family and HLE characteristics).
• To investigate the combined effect of pre-school experience and primary school experience on pupils’ self-perceptions in Year 5.
Methods
to enable us to group questionnaire items together that form separate aspects of pupils’ self-perceptions. Confirmatory factor analysis was then used to refine the results and create a more robust overall model of pupils’ self-perceptions at the two time points. Multilevel analyses (that take into account the clustering in the sample of pupils in primary schools) were used to simultaneously analyse the impact of pupil background characteristics (including child, family, HLE) and the impact of both the pre-school and the primary school attended.
The analyses employ a range of statistical techniques from descriptive statistics and correlation analysis to multilevel (hierarchical) regression methods to examine the potential influences on pupils’ self-perceptions. The paper focuses on four self-perception measures based on questionnaires that included many items drawn from existing primary pupil surveys. Questionnaires were administered to EPPE 3-11 pupils at the end of Year 5 (age 10). At the end of Year 2 a questionnaire of EPPE 3-11 pupils’ views at age 7 years had been administered, so comparable measures of EPPE 3-11 pupils’ prior self-perceptions are available.
Multilevel models provide more accurate estimates of the impact of different child or primary school characteristics on pupil outcomes (Goldstein, 1995) than other forms of analysis. They can be used to explore institutional influences by partitioning variance into individual and higher levels (e.g. school centre or school), thus reflecting clustering in the child sample. Earlier analyses over the pre-school period enabled the calculation of value added estimates (residuals) of individual pre-pre-school centre effects for children in the EPPE 3-11 child sample that had attended a pre-school centre (see Sammons et al., 2002; 2003 for details). These value added measures of pre-school centre effectiveness have been included in subsequent analyses of pupils’ outcomes, at the end of Year 5 in primary school, to establish whether the effectiveness of the pre-school centre previously attended, in terms of promoting pupils’ cognitive and/or social/behavioural development, continues to show any predictive relationships with pupils’ self-perceptions in primary school. To examine the impact of primary school on pupils’ later outcomes in Year 5, measures of primary school academic effectiveness in English and Mathematics have been derived from independent value added analyses of pupil progress for full cohorts using National assessment data for all primary schools in England matched between Key Stage 1 (KS1) and Key Stage 2 (KS2) over three years (see Melhuish et al., 2006).
Background information about child, parent and family characteristics was obtained initially through parent interviews conducted soon after children were recruited to the EPPE study. The parent interviews were designed to obtain information about a child’s health and care history, details of family structure and parents’ own educational and occupational backgrounds as well as some indications of parent-child activities and routines, particularly the home learning environment.2 Subsequently parents were again asked to provide further information about child, parent and family characteristics when the children were in Key Stage 1 of primary school (age approximately 6 years) and this time information was obtained via a parent questionnaire. Details were sought regarding any change in background information (in employment, family structure, number of siblings etc.) as well as information on aspects of the HLE in KS1. The corrected response rate obtained was good at eighty-one per cent3.
Overview of the report
This report is divided into six sections. The first section gives details about the characteristics of the EPPE 3-11 sample. The second section describes how the baseline (Year 2) and outcome (Year 5) pupils’ self-perception measures were created using exploratory and confirmatory analysis of the
2 In most cases the parent interviews were conducted within 10 weeks of recruiting a child to the study and an
excellent response rate (97%) was achieved. It should be noted that most interviews were with pupils’ mothers and usually took place at the child’s pre-school centre, although for some working parents telephone interviews were found to be more convenient.
3 Between the initial assessment at entry to pre-school and the Reception assessment 139 children dropped out
‘pupil self-report questionnaire items. We have reported on cognitive and social/behavioural outcomes at Year 5 (age 10) for this sample in separate reports (Sammons et al., 2007a; 2007b).
The third section investigates whether particular groups of pupils show differences in their self-perceptions at the end of Year 5 of primary school according to their background characteristics. This section also explores the predictive power of different child, family and home learning environment (HLE) background characteristics in accounting for variations in pupils’ self-perceptions and experiences of school. Further analyses identify the unique (net) contribution of particular characteristics to variation in pupils’ self-perception while other influences are controlled. Thus, for example, the impact of family socio-economic status (SES) is established while taking into account the influence of other factors such as mother’s qualification levels, low income, ethnic group, birth weight, HLE etc. Results are reported in terms of effect sizes (ES); a statistical measure of the relative strength of different predictors. It is of policy interest to establish the nature and strength of such background influences individually and in total, because they are relevant to issues of equity and social inclusion.
In section four the effects of pre-school and primary school characteristics on pupils’ subsequent self-perceptions are investigated. The first phase of the EPPE 3-11 research had shown that pre-school experience gave children a better start to school, in terms of higher cognitive attainments and improved social/behavioural outcomes. For more vulnerable groups of young children, in particular, lack of pre-school experience was found to be an additional disadvantage. As well as modelling the effect of pre-school attendance, in these analyses measures of pre-school centre influence including quality (measured by the ECERS-E, Sylva et al., 2006; Sylva, Siraj-Blatchford & Taggart, 2006) and centre effectiveness (measured by value added residual estimates based on pupils’ cognitive progress during the pre-school period, Sammons et al., 2002; 2003) are tested to explore any possible continuing effects of pre-school at the end of Year 5. This section also addresses the question of differential pre-school effects for different groups of children.
Further analyses sought to establish the impact of primary school academic effectiveness on pupils’ self-perceptions in Year 5, based on value added academic effectiveness measures for primary schools that were calculated independently of the EPPE 3-11 study (Melhuish et al., 2006). The last part of Section 4 deals with the combined impact of different characteristics of pre-school experience (quality and effectiveness) and primary school academic effectiveness.
The fifth section investigates whether particular groups of pupils show differences in the extent of change in their self-perceptions from Year 2 to Year 5 of primary education and whether pre-school and primary school experiences are associated with such changes during KS2.
Section 1: Characteristics of the EPPE 3-11 sample at the end of
Year 5
The educational effectiveness research design used for the original EPPE study is described in EPPE Technical Paper 1 (Sylva et al., 1999). Further discussion of the mixed methods approach is given by Sammons et al., 2005 and Siraj-Blatchford et al., 2006. In summary, six English Local Authorities (LAs), in five regions, participated in the research with children recruited from six main types of pre-school provision: nursery classes, playgroups, private day nurseries, local authority day nurseries, nursery schools and integrated centres (that combine care and education). In order to enable comparison of centre and type of provision effects the project sought to recruit 500 children, 20 in each of 20-25 centres, from the various types of provision. In some LAs certain forms of provision were less common and others more typical. Within each LA, centres of each type were selected by stratified random sampling and, due to the small size of some centres in the project (i.e. rural playgroups) more of these centres were included than originally proposed, bringing the sample total to 141 centres. In all, there were 2,857 children in the pre-school sample. An additional sample of 315 ‘home’ children (who had not attended a pre-school setting) was added at entry to primary school, for comparison with those who had attended a pre-school, bringing the total sample to 3,172.
While in primary school EPPE 3-11 pupils were asked their views about school life at two time points: Year 2 (age 7) and Year 5 (age 10). This section provides descriptive statistics for the sample at the end of Year 5 for whom information on views had been obtained at age 10.
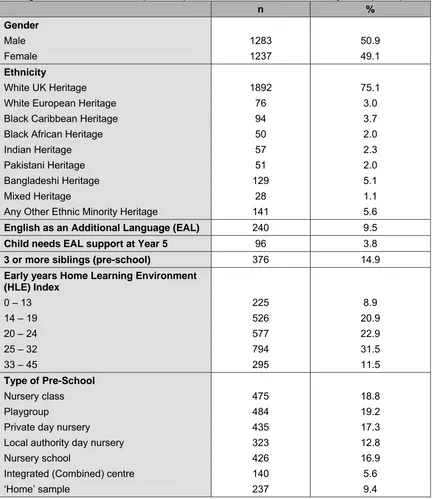
Tables 1.1a to 1.1c provide a brief summary of the characteristics of the EPPE 3-11 sample at the end of Year 5 for whom pupils’ self-perceptions factors were available (created from individual questionnaire items, n = 2520).
In all, fifty-one per cent of children were male, and a quarter of children in the sample were from an ethnic background other than White UK. Ten per cent of the children had a first language other than English, although the number of children who still needed support because of English being an additional language (EAL) was smaller at the end of Year 5 (3.8 %) than at previous time points.
With respect to family structure, fifteen per cent of the children lived in large families defined as those with 3 or more siblings. Table 1.1a also shows the distribution of the Early years home learning environment (HLE) index which is a combined indicator of aspects of the quality of the home learning environment in the early years. A number of measures collected at the entry to study from the parent interviews provided information about aspects of the HLE in the early years. These are based on the frequency of engagement in specific activities involving the child, such as teaching the alphabet, reading to the child, listening to the child read, taking the child to the library etc. (as reported by the parents). Table 1.1a shows that forty-three per cent of the children in the sample belong to the two highest HLE categories, indicating that the Early years HLE was good or very good for these children. At the lower end of the scale thirty per cent had a relatively poor Early years HLE.
Table 1.1a: Selected characteristics of children who have valid self-perception data at Yr 5 (N = 2520)
Some figures do not include non-response to questions therefore the total is not always 2520 (100 %)
n %
Gender
Male 1283 50.9
Female 1237 49.1
Ethnicity
White UK Heritage 1892 75.1
White European Heritage 76 3.0
Black Caribbean Heritage 94 3.7
Black African Heritage 50 2.0
Indian Heritage 57 2.3
Pakistani Heritage 51 2.0
Bangladeshi Heritage 129 5.1
Mixed Heritage 28 1.1
Any Other Ethnic Minority Heritage 141 5.6
English as an Additional Language (EAL) 240 9.5
Child needs EAL support at Year 5 96 3.8
3 or more siblings (pre-school) 376 14.9
Early years Home Learning Environment (HLE) Index
0 – 13 225 8.9
14 – 19 526 20.9
20 – 24 577 22.9
25 – 32 794 31.5
33 – 45 295 11.5
Type of Pre-School
Nursery class 475 18.8
Playgroup 484 19.2
Private day nursery 435 17.3
Local authority day nursery 323 12.8
Nursery school 426 16.9
Integrated (Combined) centre 140 5.6
‘Home’ sample 237 9.4
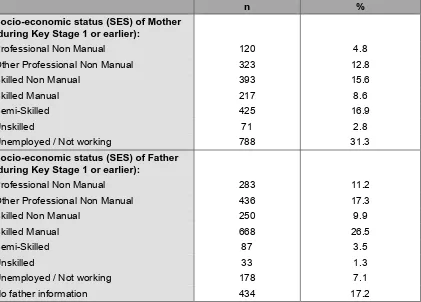
Table 1.1b: Selected characteristics of children who have valid self-perception data at Yr 5 (n = 2520)
Some figures do not include non-response to questions therefore the total is not always 2,520 (100 %)
n %
Socio-economic status (SES) of Mother (during Key Stage 1 or earlier):
Professional Non Manual 120 4.8
Other Professional Non Manual 323 12.8
Skilled Non Manual 393 15.6
Skilled Manual 217 8.6
Semi-Skilled 425 16.9
Unskilled 71 2.8
Unemployed / Not working 788 31.3
Socio-economic status (SES) of Father (during Key Stage 1 or earlier):
Professional Non Manual 283 11.2
Other Professional Non Manual 436 17.3
Skilled Non Manual 250 9.9
Skilled Manual 668 26.5
Semi-Skilled 87 3.5
Unskilled 33 1.3
Unemployed / Not working 178 7.1
No father information 434 17.2
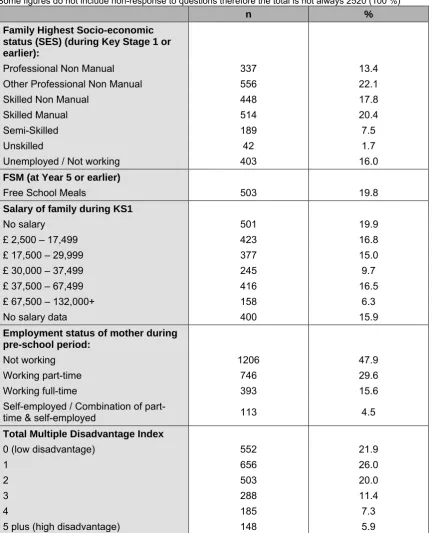
Table 1.1c shows details on the combined family SES measure. Nearly a fifth (19.8%) of children were identified as eligible for free school meals (FSM), and over a third (36.7%) were growing up in families whose annual salary was reported to be low (less than £17,500) when they were in Key Stage 1 (collected in the summer of 2001).
An index of multiple disadvantage4 related to pupils’ background characteristics was created in the original EPPE research. Table 1.1c indicates that twenty-two per cent of the sample was recorded as low disadvantage on this whereas, thirteen per cent of the sample was highly disadvantaged with a score of 4 or more factors identified as increasing the risk of low attainment.
4 The index combines poor child, family and home learning environment (HLE) characteristics individually
Table 1.1c: Selected characteristics of children who have valid self-perception data at Yr 5 (n = 2520)
Some figures do not include non-response to questions therefore the total is not always 2520 (100 %)
n %
Family Highest Socio-economic status (SES) (during Key Stage 1 or earlier):
Professional Non Manual 337 13.4
Other Professional Non Manual 556 22.1
Skilled Non Manual 448 17.8
Skilled Manual 514 20.4
Semi-Skilled 189 7.5
Unskilled 42 1.7
Unemployed / Not working 403 16.0
FSM (at Year 5 or earlier)
Free School Meals 503 19.8
Salary of family during KS1
No salary 501 19.9
£ 2,500 – 17,499 423 16.8
£ 17,500 – 29,999 377 15.0
£ 30,000 – 37,499 245 9.7
£ 37,500 – 67,499 416 16.5
£ 67,500 – 132,000+ 158 6.3
No salary data 400 15.9
Employment status of mother during pre-school period:
Not working 1206 47.9
Working part-time 746 29.6
Working full-time 393 15.6
Self-employed / Combination of
part-time & self-employed 113 4.5
Total Multiple Disadvantage Index
0 (low disadvantage) 552 21.9
1 656 26.0
2 503 20.0
3 288 11.4
4 185 7.3
5 plus (high disadvantage) 148 5.9
In general, only a small proportion of children had missing data (< 5 %) even for the measures of social background, which is a consequence of detailed procedures for tracking children, liaison with primary schools and quality data checks. Higher proportions of missing values occur for income related variables like salary, or the eligibility for free school meals (FSM), which is also an additional low income indicator (25.0% of data was missing for salary information collected during Key stage 1). A somewhat higher proportion of missing values for these kinds of measures is a typical response pattern also found in other questionnaire studies5.
5 To prevent loss of sample size missing values for no. of siblings, FSM and SES where imputed using ‘the last
Section 2: Pupils’ self-perceptions and data analysis
Information about pupils’ self-perceptions was collected through self-report questionnaires administered by class teachers in Year 2 and Year 5. The items were derived from a study of existing measures and adapted for use with this age group. Some questions have been taken or adapted from The School Climate Assessment Instrument (Grosin and McNamara, 2001) and from Teddlie and Stringfield’s Louisiana ABC+ model (Teddlie et al., 1984; Teddlie and Stringfield, 1993).
Pupils’ self-perceptions at the end of Year 2
Statistical analyses were used to explore the variation in pupils’ responses to the questionnaire items and to see whether robust measures of their self-perceptions could be identified. The results revealed a number of underlying dimensions (factors) that reflect patterns of associations amongst the questionnaire items. The descriptive details for the full Year 2 questionnaire are shown in Appendix 2. Four main factors were found through the combined principal components analysis followed by confirmatory factor analysis:
Box 1: The specific items associated with each pupils’ self-perception factor in Year 2 (age 7) ‘Enjoyment of school’ (α=0.69)
1. I like school
2. I like answering questions in class 3. I like Reading
4. I like doing number work 5. I like Science
6. School is interesting
‘Behaviour self-image’ (α=0.62)
1. I try to do my best at school 2. I am kind to other children 3. I behave well in class
‘Academic self-image’ (α=0.57)
1. I am clever
2. My teacher thinks I am clever 3. I do my work properly
‘Alienation’ (α=0.52)
1. I get tired at school 2. I get fed up at school 3. I get angry at school α=Cronbach’s Alpha
Five factors were extracted from the original principal components analysis that accounted for forty-three per cent of the variance. This was reduced to four because the fifth factor had a poor Cronbach’s Alpha (α=0.40). Full details of the principal components analysis and confirmatory factor analysis are shown in Appendix 3. The factors were weighted (see Appendix 3 for details) and where data were missing for an individual item the results were imputed.
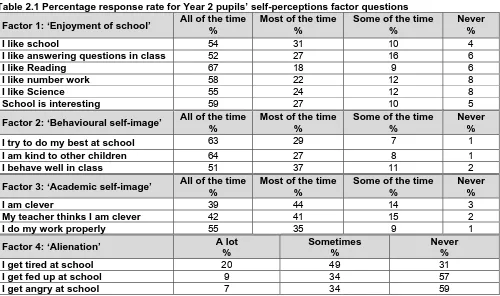
Table 2.1 Percentage response rate for Year 2 pupils’ self-perceptions factor questions
Factor 1: ‘Enjoyment of school’ All of the time %
Most of the time %
Some of the time %
Never %
I like school 54 31 10 4
I like answering questions in class 52 27 16 6
I like Reading 67 18 9 6
I like number work 58 22 12 8
I like Science 55 24 12 8
School is interesting 59 27 10 5
Factor 2: ‘Behavioural self-image’ All of the time %
Most of the time %
Some of the time %
Never %
I try to do my best at school 63 29 7 1
I am kind to other children 64 27 8 1
I behave well in class 51 37 11 2
Factor 3: ‘Academic self-image’ All of the time %
Most of the time %
Some of the time %
Never %
I am clever 39 44 14 3
My teacher thinks I am clever 42 41 15 2
I do my work properly 55 35 9 1
Factor 4: ‘Alienation’ A lot %
Sometimes %
Never %
I get tired at school 20 49 31
I get fed up at school 9 34 57
I get angry at school 7 34 59
Note that a high score on the factors ‘Enjoyment of school’, ‘Behavioural self-image’, and ‘Academic self-image’ relates to more positive outcomes, whereas a high score on the factor ‘Alienation’ relates to higher levels of negative attitudes6.
Table 2.2 shows the correlations (a measure of statistical association which ranges from +1 to –1) between pupils’ scores on the different Year 2 factors. All are highly statistically significant. The strongest statistical association is between pupils’ scores on ‘Behavioural self-image’ and ‘Academic self-image’ followed by a negative association between ‘Alienation’ and ‘Enjoyment of school’, whilst the weakest correlation is between ‘Academic self-image’ and ‘Alienation’.
Table 2.2 Correlations between pupils’ self-perception factors at Year 2 ‘Enjoyment of school’ ‘Behavioural self-image’ ‘Academic self-image’ ‘Alienation’ ‘Enjoyment of school’
1.00** 0.28** 0.31** - 0.41**
‘Behavioural self-image’
1.00** 0.45** - 0.29**
‘Academic self-image’
1.00** - 0.20**
** Statistically significant at the 0.01 level
The analyses also indicate that there are only weak but statistically significant associations between pupils’ self-perceptions at the end of Year 2 and their cognitive attainments at this age. In Table 2.3 the correlations between pupils’ self-perception factors and their cognitive attainments in different areas are reported with the associations strongest for ‘Behavioural self-image’ and cognitive attainments at the end of Year 2 (stronger for Reading).
6 The ‘Enjoyment of school’, ‘Behaviour self-image’, and ‘Academic self factors were rated on a 1-4 scale where
Table 2.3 Correlations between pupils’ self-perceptions factors and cognitive attainment at Year 2 Year 2 Reading score Year 2 Mathematics score
‘Enjoyment of school’ 0.05** Ns
‘Behavioural self-image’ 0.14** 0.10**
‘Academic self-image’ 0.09** 0.09**
‘Alienation’ -0.10** -0.05*
* Statistically significant at the 0.05 level, ** Statistically significant at the 0.01 level Ns – Not significant
Correlations between pupils’ self-perception factors and social behaviour are generally higher (see Table 2.4).
Table 2.4 Correlations between pupils’ self-perceptions factors and social behaviour at Year 2
Year 2 ‘Self-regulation’
Year 2 ‘Pro-social’ behaviour
Year 2 ‘Anti-social’ behaviour
Year 2 ‘Anxious’ behaviour
Year 2 ‘Social isolation’
‘Enjoyment of school’ 0.07** 0.12** -0.03 -0.02 -0.06**
‘Behavioural self-image’
0.28** 0.32** -0.32** 0.02 -0.27**
‘Academic self-image’ 0.15** 0.17** -0.10** -0.00 -0.13**
‘Alienation’ -0.14** -0.18* 0.20** 0.04* 0.16**
* Statistically significant at the 0.05 level, ** Statistically significant at the 0.01 level
Due to a relatively low Cronbach’s Alpha, the ‘Alienation’ factor is omitted from the multilevel analyses.
Pupils’ self-perceptions at the end of Year 5
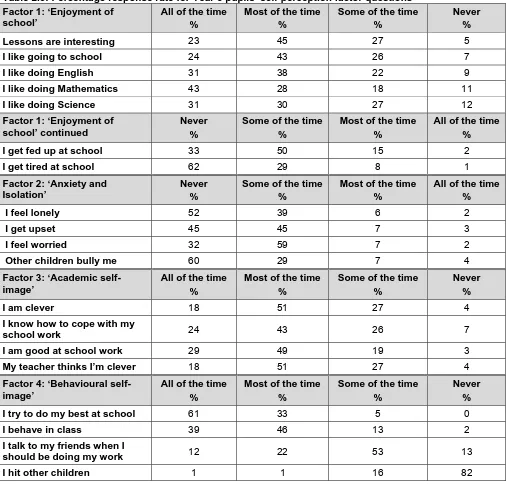
The statistical analysis of the Year 5 questionnaire items was conducted in a similar way to that in Year 2 and again identified a number of underlying dimensions (factors) which reflect patterns of associations amongst the questionnaire items. The descriptive details for the full Year 5 questionnaire are shown in Appendix 4. Four factors were revealed by the combined principal components analysis and the confirmatory factor analysis and were broadly similar to those found in Year 2.
Box 2: The specific items associated with each pupils’ self-perception factor in Year 5 (age 10) ‘Enjoyment of school’ (α=0.76)
1. Lessons are interesting 2. I like going to school 3. I get fed up at school 4. I get tired at school 5. I like English 6. I like Mathematics 7. I like Science
‘Anxiety and Isolation’ (α=0.74)
1. I feel lonely 2. I get upset 3. I feel worried
4. Other children bully me
‘Academic self-image’ (α=0.74)
1. I am clever
2. I know how to cope with my school work 3. I am good at school work
4. My teacher thinks I’m clever
‘Behavioural self-image’ (α=0.62)
1. I try to do my best at school, 2. I behave in class,
3. I talk to my friends when I should be doing my work 4. I hit other children
α=Cronbach’s Alpha