4345
EVALUATION OF THE USE OF E-LEARNING IN AIRLANGGA
SAMARINDA STMIK SPB EDUCATION SYSTEM
1Achmad Soni, 2Ahmad Nurul Fajar
1,2 Information Systems Management Department, BINUS Graduate Program-Master of Information Systems
Management, Bina Nusantara University Jakarta, Indonesia 11480 Email: 1[email protected], 2[email protected]
ABSTRACT
STMIK SPB Airlangga Samarinda is one of the university who applies E-Learning. In Samarinda there are not many universities who applies E-Learning like SPB Airlangga. SPB Airlangga is a university who focuses on TI (Teknik Informatika). E-learning has evolved from just an online course into an advanced technology in material distribution and course discussions without being bound by permanent time and place. SPB STMIK Airlangga Samarinda has applied e-learning that is already used by lecturers and students as the media for online course, included in them are discussion for lecture courses, tasks arrangement and online tests. In learing models such as these, lecturers, students and the educational organization need smarter tools to deal with the problem of ongoing feedback from the education process. It is to offer a learning environment that can enhance the learning effectiveness of new learning modes as well as organizations and efficient institutional resources to gain knowledge on any topic, So an evaluation how the effect of implementing e-learning in the learning process in SPB STMIK Airlangga Samarinda using the evaluation through evaluating system user acceptance is done. The activity of this research is the evaluation of several variables related to user behavior towards the use of e-learning in SPB STMIK Airlangga Samarinda where the placing of the variables i done through TAM approach (Ibrahim, Leng et al. 2018). This research will measure the following independent variables: (1). Perceived Of Usefulness/POU) (2). Perceived Ease Of Use/PEOU, (3). Attitude Towards Using, these dependent variables: (4). Actual Use. The results of this research are expected to provide useful material for the development of science and research in the scope of e-learning and everything related to all aspects that influence it. The results of the evaluation of the use of E-Learning in the STMIK SPB Airlangga Samarinda Lecture System were obtained from the use of data collection through a questionnaire method obtained directly from students and lecturers at STMIK SPB Airlangga Samarinda, and the produced TAM factors assumed to influence the use of e-learning systems at SPB STMIK Airlangga Samarinda are 1). Perceived
Ease Of Use/PEOU, 2). Perceived Of Usefulness/POU, 3). Attitude Towards Using/ATU, and 4). Actual
use/AU
Keywords:E-Learning, STMIK, TI, Evaluation
1. INTRODUCTION
The growth of the internet, cloud technology, cellphone use in current scenario lately has been spreading in every aspect of human life. The use of e-learning (electronic learning) has expanded in every sector and created many opportunities. Market education has developed significantly over the past few years and e-learning has emerged as a major contributor to the development of the education sector [1]. The Internet has opened up new possibilities for all types of learning content, ranging from the school, graduate or master level, even employee training and research activities or any type of academic offering called e-Learning. E-Leaning has established its existence and popularity which can be measured by the fact that the transmission of data and information is not
4346 pattern and transformation of advanced education as we know it [4] widely by univerity and company in various learning programs and educational activities [5].Online tutorials, essays and its explanations, and easy access to information have made it easy to gain knowledge about any topic. In fact, it's almost normal for students to contact teachers or experts remotely via email or Skype and learn from them. The emergence of smartphones has also facilitated the e-learning process. It can be said that currently, e-learning has become an important supplement for traditional learning practices. Technology-based e-learning systems include the use of the internet and other important technologies to produce teaching materials, teach students, and also organize courses / training in an organization. e-learning has evolved from just an online course to a more advanced use of technology in material distribution and discussion of subjects without the need for permanent time and place. However, to make it easier to understand, e-learning is freely defined as a learning system through online media by utilizing information and communication technology that is used to deliver teaching material from teachers to improve students' knowledge.
2. BASIC THEORIES
The term e-learning is a new thing, so that it is still actual in the development of education. The term e-learning appears along with the development of the advancement of the world of science and technology and its use in human life nowadays. These developments are mainly on internet technology and computer-based technology as data and information processing tools. With E-Learning, some other similiar term also appeared, those terms are : e-Government (development strategy and development of digital technology-based public service systems), e-Tendering, and some others. E-learning or electronics learning itself has been around since 1970. The existence of e-learning as one of the distance-learning media will be an alternative solution in improving the quality of education in Indonesia. The Benfit of E-Learnings are as described by [2].
3. RESEARCH METHODOLOGY
The study was conducted at SPB STMIK Airlangga Samarinda. Based on the results of a study of several literatures, the relationship between variables found in this case will be used as a hypothesis in this study, namely as follows: 1. Perception of Ease of Use (PEOU) has a positive effect on Perception of Use (POU). The higher a person's assumption of the ease of use of a system, the higher one's trust in the benefits of using the system [6] and [7]. Perception of Ease of Use (PEOU) and Perception of Use (POU) have a positive effect on attitudes toward using behavior (ATU). The higher a person's assumptions about the ease of use of a system and the higher a person's belief in the benefits of using the system, will also increase the attitude of someone's behavior in using the system. [8]. Perception of Ease of Use (PEOU), Perception of Use (POU), and Attitudes toward behavior using (ATU) have a positive effect on Real Use (AU). The higher a person's assumption on the ease of use of a system, the higher a person's trust in the benefits of using the system, and the increasing attitude of a person's behavior in using the system, will further enhance one's actions in using the system [8],[9]. From the results of the literature study as mentioned above, in this study the hypothesis is set as follows: H1: Perception of ease of use (X1) has a positive effect on perceived usefulness (X2). H2: Perception of ease of use (X1) has a positive effect on attitudes toward use (X3). H3: Perception of ease of use (X1) has a positive
effect on real use (Y).
H4: Perception of usability (X2) has a positive effect on attitudes toward use (X3). H5: Perception of usability (X2) has a positive
effect on real use (Y).
H6: Attitudes toward use (X3) have a positive effect on real use (Y).
4347
Figure 1. The Questionnaire
The required data was obtained through questionnaire distribution. Each respondent answered all the questions in the questionnaire sheet with the choice of answers already provided. All filled questionnaires collected are then recapitulated the results of the answer into the form of tabulation using MS. Excel stored in CSV format. The results of questionnaire data recapitulation were then processed using SEM techniques performed using AMOS software.
4. RESULTS AND DISCUSSIONS
Research data description is intended to give an easier way of understanding the result of the questionnaires which have been distributed to the masses. Using the Purposive Sampling technique, we have obtained 100 sheets of filled questionnaire. The description for the result of the data collection are as follows:
[image:3.612.88.542.61.292.2]The recapitulation results of the questionnaires data for this variable are presented in figure 2. We see that most of the respondent (63%, 53%, 72%) answers “Agree” with the ease of use of the e-learning system at SPB STMik Airlangga Samarinda. The biggest percentage however (72%) is “Agree” with the indicator that the e-learning system is very flexible to interact with other parties.
Figure 2. The Indicator percentage
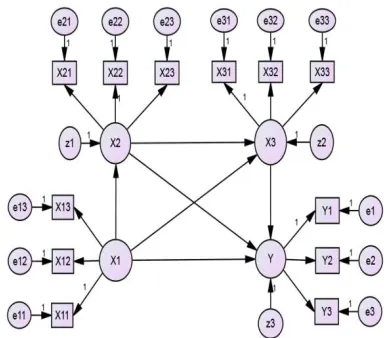
[image:3.612.344.536.333.502.2]The theoretical model as shown in Figure 1.2 is then arranged into a path diagram using AMOS software facilities. The results are shown in Figure 3 below
Figure 3. The Indicator Percentage
From Figure 1.3 we can obtain structural equation models as follows:
𝑋 = 𝛾 𝑋 + 𝑧 (4)
𝑋 = 𝛾 𝑋 + 𝛽 𝑋 + 𝑧 (5)
𝑌 = 𝛾 𝑋 + 𝛽 𝑋 + 𝛽 𝑋 + 𝑧 (6)
Parameter γ (gamma) is a constant direct relationship between an exogenous variable to another endogenous variable, β (betha) is a constant direct relationship between an endogenous variable to another endogenous variable, while z is a structural error.
The specifications for the measurement model are stated as follows:
1. Construct 𝑋 (Perceived Ease of Use)
𝑋 = 𝜆 . 𝑋 + 𝑒
4348
𝑋 = 𝜆 . 𝑋 + 𝑒
2. Construct 𝑋 (Perceived Actual Use)
𝑋 = 𝜆 . 𝑋 + 𝑒
𝑋 = 𝜆 . 𝑋 + 𝑒
𝑋 = 𝜆 . 𝑋 + 𝑒
3. Construct 𝑋 (Attitudes Towards Using)
𝑋 = 𝜆 . 𝑋 + 𝑒
𝑋 = 𝜆 . 𝑋 + 𝑒
𝑋 = 𝜆 . 𝑋 + 𝑒
4. Construct 𝑌 (Actual Use) 𝑌 = 𝜆 . 𝑌 + 𝑒
𝑌 = 𝜆 . 𝑌 + 𝑒 𝑌 = 𝜆 . 𝑌 + 𝑒
The parameter is the loading factor (the relationship between the exogenous and endogenous latent variables to the respective indicators), while e is measurement error.
The input data used in estimating the model using AMOS software comes from the data from the processed questionnaire. The processed results of questionnaire data in the form of score data tables stored in CSV format (MS.Excel). The model estimation technique used in this study is Maximum Likelihood Estimation (ML) with more efficient and unbiased considerations if the assumption of multivariate normality is fulfilled. In this case, the input data must be free from outliers and must be normally distributed. In this case, input data must be free from outlier data and meet the requirements of critical ratio (c.r) multivariate -2.58 <c.r <2.58 to be free from bias in interpretation and affect other data.
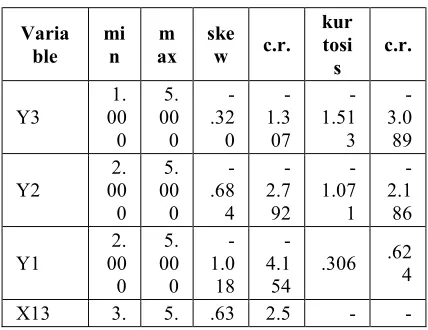
[image:4.612.82.296.564.729.2]The results of the normality test using AMOS are shown in the following. From the table the value of cr = 2,651 is obtained. The results of this test indicate that the input data used for estimating the model are classified as free outliers.
Table 1. Normality Test Results (Amos Output)
Varia ble mi n m ax ske
w c.r.
kur tosi
s c.r.
Y3 001. 0 5. 00 0 -.32 0 -1.3 07 -1.51 3 -3.0 89
Y2 002. 0 5. 00 0 -.68 4 -2.7 92 -1.07 1 -2.1 86
Y1 002. 0 5. 00 0 -1.0 18 -4.1
54 .306 .62
4
X13 3. 5. .63 2.5 -
-Varia ble mi n m ax ske
w c.r.
kur tosi
s c.r.
00
0 000 0 71 .242 .494
X12 003. 0 5. 00 0 -.11 4 -.46 4 -1.16 4 -2.3 75 X11 3. 00 0 5. 00 0 .26
7 1.089 .938 -1.9 14
X33 002. 0 5. 00 0 -1.3 66 -5.5 77 1.30 3 2.661
X32 003. 0 5. 00 0 -.07 6 -.30 9 -1.16 1 -2.3 70
X31 003. 0 5. 00 0 .34 2 1.3 98 -1.29 8 -2.6 50
X23 002. 0 5. 00 0 -.87 4 -3.5 66 1.30 5 2.663
X22 3. 00 0 5. 00 0 .03 8 .154
-1.12 7 -2.3 01
X21 003. 0
5. 00 0
.59
8 2.443 .949 -1.9 37
Multiv
ariate 9.720 2.651
4349
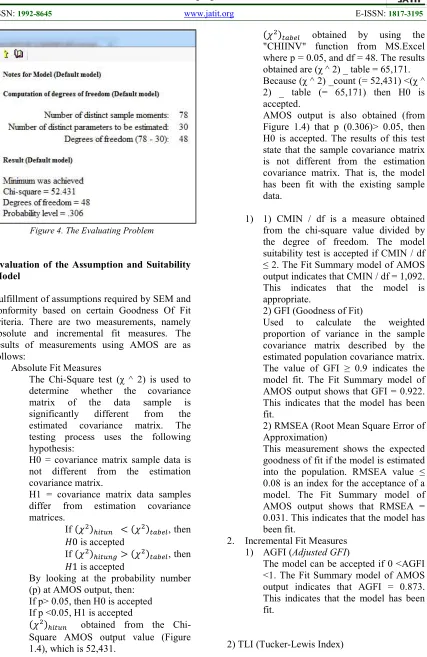
Figure 4. The Evaluating Problem
Evaluation of the Assumption and Suitability Model
Fulfillment of assumptions required by SEM and conformity based on certain Goodness Of Fit criteria. There are two measurements, namely absolute and incremental fit measures. The results of measurements using AMOS are as follows:
1. Absolute Fit Measures
The Chi-Square test (χ ^ 2) is used to determine whether the covariance matrix of the data sample is significantly different from the estimated covariance matrix. The testing process uses the following hypothesis:
H0 = covariance matrix sample data is not different from the estimation covariance matrix.
H1 = covariance matrix data samples differ from estimation covariance matrices.
If (𝜒 ) < (𝜒 ) , then 𝐻0 is accepted
If (𝜒 ) > (𝜒 ) , then 𝐻1 is accepted
By looking at the probability number (p) at AMOS output, then:
If p> 0.05, then H0 is accepted If p <0.05, H1 is accepted
(𝜒 ) obtained from the Chi-Square AMOS output value (Figure 1.4), which is 52,431.
(𝜒 ) obtained by using the "CHIINV" function from MS.Excel where p = 0.05, and df = 48. The results obtained are (χ ^ 2) _ table = 65,171. Because (χ ^ 2) _count (= 52,431) <(χ ^ 2) _ table (= 65,171) then H0 is accepted.
AMOS output is also obtained (from Figure 1.4) that p (0.306)> 0.05, then H0 is accepted. The results of this test state that the sample covariance matrix is not different from the estimation covariance matrix. That is, the model has been fit with the existing sample data.
1) 1) CMIN / df is a measure obtained from the chi-square value divided by the degree of freedom. The model suitability test is accepted if CMIN / df ≤ 2. The Fit Summary model of AMOS output indicates that CMIN / df = 1,092. This indicates that the model is appropriate.
2) GFI (Goodness of Fit)
Used to calculate the weighted proportion of variance in the sample covariance matrix described by the estimated population covariance matrix. The value of GFI ≥ 0.9 indicates the model fit. The Fit Summary model of AMOS output shows that GFI = 0.922. This indicates that the model has been fit.
2) RMSEA (Root Mean Square Error of Approximation)
This measurement shows the expected goodness of fit if the model is estimated into the population. RMSEA value ≤ 0.08 is an index for the acceptance of a model. The Fit Summary model of AMOS output shows that RMSEA = 0.031. This indicates that the model has been fit.
2. Incremental Fit Measures 1) AGFI (Adjusted GFI)
The model can be accepted if 0 <AGFI <1. The Fit Summary model of AMOS output indicates that AGFI = 0.873. This indicates that the model has been fit.
4350 The model can be accepted if TLI ≥ 0.9 and values close to 1 indicate excellent model fittings. The Fit Summary model of AMOS output shows that TLI = 0.978. This indicates that the model has been fit.
2) CFI (Comparative Fit Index)
A model is said to have good suitability if CFI ≥ 0.9. The Fit Summary model of AMOS output shows that CFI = 0.984. This indicates that the model has been fit.
Analysis of Indicator Relationships with Latent Variables
This section discusses the results of testing the relationship between indicators and related latent variables. Loading factor above 0.5 indicates an indicator is indeed part of a related latent variable. The results of the measurement of regression weights between indicators with related latent variables are shown in the following table. It appears that all indicators of each latent variable have estimated regression weights (factor loading) above 0.5. This shows that all indicators of each existing latent variable are indeed part of the intended latent variable.
Analysis of the Relationship Between Latent Variables Causality
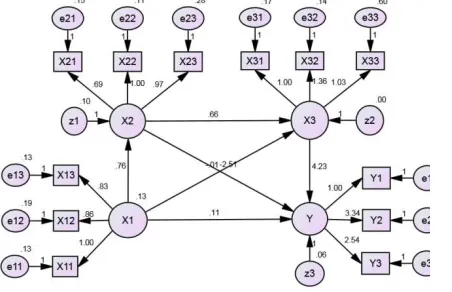
[image:6.612.91.317.511.657.2]This section presents the results of the analysis of causality relationships between latent variables using the AMOS output results as shown in Figure 5 below
Figure 5. The Results Of The Analysis Of Causality Relationships Between Latent Variables
From the output model, the structural equation model can be obtained as follows:
𝑋 = 𝛾 𝑋 + 𝑧 = (0.76)𝑋 + 0.1 (7)
𝑋 = 𝛾 𝑋 + 𝛽 𝑋 + 𝑧 = (−2.51)𝑋 + (0.66)𝑋 + 0
(8)
𝑌 = 𝛾 𝑋 + 𝛽 𝑋 + 𝛽 𝑋 + 𝑧
= (0.11)𝑋 + (−0.1)𝑋 + (4.23)𝑋 + 0.06
(9)
From the model of structural equation above can be known:
1. 𝑋 has a positive effect on 𝑋 with parameter 𝛾 = 0.76
2. 𝑋 has a negative effect on 𝑋 with parameter 𝛾 = −2.51
3. 𝑋 has a positive effect on 𝑌 with parameter 𝛾 = 0.11
4. 𝑋 has a positive effect on 𝑋 with parameter 𝛽 = 0.66
5. 𝑋 has a negative effect on 𝑌 with parameter 𝛽 = −0.1
6. 𝑋 has a positive effect on 𝑌 with parameter 𝛽 = 4.23
Interpretation of Research Results
From the results of the research that has been done, obtained several things as follows:
1. Perception of ease of use (X1) has a positive effect on perceived usefulness (X2) with a gamma parameter of 0.76. This is in accordance with Hypothesis 1 (H1). This means that it is proven that the higher the presumption of e-learning users at SPB STMIK Airlangga Samarinda for the ease of use, the higher the users' trust in the benefits of using the system.
2. Perception of ease of use (X1) has a negative effect on attitudes toward use (X3) with gamma parameters of -2.51. This is contrary to Hypothesis 2 (H2). These results indicate that the higher the presumption of e-learning users at SPB STMIK Airlangga Samarinda for the ease of use, the lower the attitude of the users in using the system..
4351 further enhance the actions of users in using the system....
4. Perception of usability (X2) has a positive effect on attitudes toward use (X3) with parameters betha of 0.66. This is in accordance with Hypothesis 4 (H4). That is, the higher the trust of e-learning users at SPB STMIK Airlangga Samarinda on the benefits of using the system, will further enhance the attitude of the users in using the system.
5. Perception of usability (X2) has a negative effect on real use (Y) with parameters betha of -0.1. This is contrary to Hypothesis 5 (H5). This indicates that the higher the trust of e-learning users at Airlangga Samarinda SPB STMIK towards the benefits of using the system, the more it decreases the user's actions in using the system.
Attitudes toward use (X3) have a positive effect on real use (Y) with parameters betha of 4.23. This is in accordance with Hypothesis 6 (H6). That is, the higher the behavior attitude of e-learning users at SPB STMIK Airlangga Samarinda, will further enhance the actions of users in using the system.
From the structural equation model whch has been weighted and the picture above, it can be seen that:
1. From the press. (7), Perception variable ease of use (X1) has a positive effect on Usage Perception (X2) with a gamma parameter of 0.76.
2. From the press. (8) can be known based on the coefficient, Perception of ease of use variable (X1) has more dominant influence (gamma = -2.51) on Attitude toward use variable (X3) compared to Usage Perception variable (X2) (betha = 0.66).
From the press. (9) can be determined based on the coefficient, Attitude towards use (X3) has more dominant influence (betha = 4.23) on Real Use variable (Y) compared to Perception variable ease of use (X1) (betha = 0.11) and Usability Perception (X2 ) (betha = -0.1).
5. CONCLUSION
After conducting a series of research activities that have described the results of the results in the previous chapter, there are several things that
can be used as research conclusions as follows: TAM factors that are assumed to have an influence on the use of e-learning systems at SPB STMIK Airlangga Samarinda are 1). Perceived Ease Of Use / PEOU, 2). Perceived Of Usefulness (POU), 3). Attitudes towards using behavior (Attitude Towards Using / ATU), and 4). Actual use / AU.
2.The results of the study were obtained as follows:The Perception of Ease of Use (PEOU) variable has a positive influence on the Usage Perception (POU) variable with a regression weight of 0.76.The Perception of Ease of Use (PEOU) variable has a negative influence on Attitude to Use (ATU) variables with a regression weight of -2.51.The Perception of Ease of Use (PEOU) variable has a positive influence on the Real Use variable (AU) with a regression weight of 0.11.The Perception of Use (POU) variable gives a positive influence on Attitude to Use (ATU) variables with a regression weight of 0.66.The Perception Usability (POU) variable has a negative influence on the Real Use variable (AU))dengan bobot regresi sebesar -0.1.The variable Attitude to Use (ATU) has a positive influence on the Real Use variable (AU)) with a regression weight of 4.23.
3.From the equation of the weighted structure model, the dominant influence between variables is obtained as follows:Perception variables ease of use (X1) have a positive effect on perceived usefulness (X2) with gamma parameters of 0.76.Based on the magnitude of the coefficient, the Perception of ease of use variable (X1) is more dominantly influential (gamma = -2.51) on the Attitude towards Use of X3) compared to the Usage Perception variable (X2) (betha = 0.66).Based on the magnitude of the coefficient, the attitude variable towards use (X3) is more dominant (betha = 4.23) on the Real Use variable (Y) compared to the Perception variable ease of use (X1) (betha = 0.11) and Perception of Use (X2) (betha = - 0.1).
4352 Attitude to Use variable (ATU) which has the most dominant respondent's answer is the indicator "interested in learning some programs that use the e-learning system" with the answer "agree" (62%). This can be interpreted that the two indicators are interconnected quite strongly. Interest in learning a number of programs and utilizing an e-learning system at SPB STMIK Airlangga Samarinda can be interpreted only as having the dominant impact on using an e-learning system if needed.The dominant attitude towards use (ATU) is negatively affected by Perception of Ease of Use (PEOU). From the description of the research data on the Attitude to Use variable (ATU), the respondent's most dominant answer is the indicator "interested in learning some programs that use the e-learning system" with the answer "agree" (62%). While the description of the research data on the Perception of Ease of Use (PEOU) variable having the most dominant respondent's answer is the indicator "e-learning system services can improve lecture performance" with the answer "agree" (68%). This can be interpreted that the perception of the e-learning system service at SPB STMIK Airlangga Samarinda which is believed to be able to improve lecture performance is believed to be very strong does not provide direct encouragement for users to be interested in learning several programs that utilize e-learning systems at SPB STMIK Airlangga Samarinda. The dominant perception of use (POU) is influenced positively by the perception of ease of use (PEOU). From the description of the research data on the Use Perception variable (POU), the respondent's most dominant answer is the "e-learning system is very flexible to interact with other parties" with the answer "agree" (72%). While the description of the research data on the Perception of Ease of Use (PEOU) variable as a whole has the answers of the most dominant respondents "agree". This can be interpreted that the Perception of Ease of Use (PEOU) on e-learning system services at SPB STMIK Airlangga Samarinda as a whole is believed to improve the perception of the use of e-learning systems in SPB STMIK Airlangga Samarinda is very flexible to interact with other parties.
REFERENCES
[1].Agrawal, V., A. Agrawal, et al. (2016). "Assessment of factors for e-learning: an empirical investigation." Industrial and Commercial Training 48(8): 409-415. [2].Pande, D., V. M. Wadhai, et al. (2016).
"E-Learning System and Higher Education." International Journal of Computer Science and Mobile Computing (IJCSMC) 5(2): 274-280.
[3]. Hartshorne, R. and H. Ajjan (2009). "Examining Student Decisions to Adopt Web 2.0 Technologies: Theory and Empirical Tests." Journal of Computing in Higher Education 21(3): 183-198.
[4]. Sun, P.-C., R. J. Tsai, et al. (2008). "What drives a successful e-Learning? An empirical investigation of the critical factors influencing learner satisfaction." Computers & Education 50(4): 1183-1202. [5]. Hassanzadeh, A., F. Kanaani, et al. (2012).
"A model for measuring e-learning systems success in universities." Expert Systems with Applications 39(12): 10959-10966. [6]. Ramirez-Anormaliza, R., F. Sabaté, et al.
(2016). "The acceptance and use of the e-learning systems among the University Teachers in Ecuador." Proceedings of EDULEARN16 Conference-4th-6th July 2016, Barcelona, Spain: 3666-3674. [7]. Ebrahimi, S., M. Moeinikia, et al. (2017).
"Simple and Multiple Relationships among Perceived Ease of Use and Perceived Usefulness with E-Learning Acceptance in Universities’ Instructors " Quarterly Journal of Iranian Distance Education (IDEJ) 1(2): 45-50
[8]. Elkaseh, A. M., K. W. Wong, et al. (2016). "Perceived Ease of Use and Perceived Usefulness of Social Media for e-Learning in Libyan Higher Education: A Structural Equation Modeling Analysis." International Journal of Information and Education Technology 6(3): 192-199