IJPSR (2014), Vol. 5, Issue 5 (Research Article)
Received on 09 December, 2013; received in revised form, 19 April, 2014; accepted, 29 April, 2014; published 01 May, 2014
FORMULATION DEVELOPMENT AND EVALUATION OF SUSTAINED RELEASE MATRIX TABLETS OF VERAPAMIL HYDROCHLORIDE
Kondeti Ranjith Reddy*, Grace Rathnam, I. Kiran, Shalem Raju and Kranti Sri Mulpuri
C.L. Baid Metha College of Pharmacy, Thoraipakkam, Old Mahabalipuram Road, Chennai-600096, Tami Nadu, India
ABSTRACT: Sustained release matrix tablets reduce the frequency of the dosing and increase the effectiveness of the drug by localization at the site of action, providing uniform drug delivery. Sustained release matrix tablets of verapamil hydrochloride were prepared by using HPMC K15M, Xanthan and Guar Gum polymers with different concentration in various batches of the formulations to facilitate the drug release which cause patient compliance as the dosing frequency is reduced. Verapamil HCl was considered as an ideal drug for designing sustained release formulation because of the high frequency of administration and short biological half-life. The sustained release matrices of Verapamil HCl were prepared by wet granulation technique. Drug release was studied by using Dissolution testing apparatus 2 (paddle method) with 0.1 N HCl buffer for 2 hours followed by pH 6.8 Phosphate buffer for 8 hours. The
in vitro drug release of various formulations was performed and compared. The results shows that the tablets formulated with HPMC K15M polymer shows more sustained action when compared to that of Xanthan and Guar gum. The high viscosity of the polymers binds the formulation of matrix thus sustains the release of drug. It was also observed that the increase in concentration of the polymer decreased the drug release from the polymer matrix.
INTRODUCTION: The goal in designing
sustained or controlled delivery systems is to reduce the frequency of the dosing or to increase effectiveness of the drug by localization at the site of action, reducing the dose required or providing uniform drug delivery. . So, controlled release dosage form is a dosage form that release one or more drugs continuously in a predetermined pattern for a fixed period of time, either systemically or to a specified target organ.
QUICK RESPONSE CODE
DOI:
10.13040/IJPSR.0975-8232.5(5).2066-73
Article can be accessed online on: www.ijpsr.com
DOI link: http://dx.doi.org/10.13040/IJPSR.0975-8232.5(5).2066-73
Controlled release dosage forms provide a better control of plasma drug levels, less dosage frequency, less side effect, increased efficacy and
constant delivery 1, 2.
In pharmaceutical CRDDS, matrix based systems are the most commonly used type of release controlling methodology owing to their simple manufacturing be granulated to make the mix suitable for the preparation of tablets by wet
granulation or beads 3.
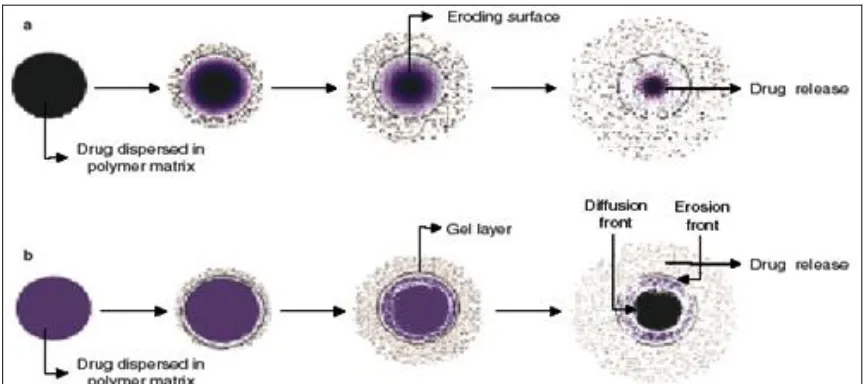
In erodible matrices, polymer erosion from the surface of the matrix determines the drug release; whilst in hydrophilic matrices, formation of the gel layer and its dynamics as a function of time determines the drug release.
Keywords:
Verapamil hydrochloride, sustained release, In vitro dissolution, Wet
granulation, HPMC K15M Correspondence to Author:
Kondeti Ranjith Reddy
C.L. Baid Metha College of Pharmacy, Thoraipakkam, Old Mahabalipuram Road, Chennai-600096, Tami Nadu, India
E-mail:
Gel layer thickness, which determines the diffusion path length of the drug, corresponds to the distance between the diffusion and erosion fronts. As the swelling process proceeds, the gel layer gradually becomes thicker, resulting in progressively slower
drug-release rates; however, due to continuous hydration, polymer disentanglement occurs from the surface of the matrix, resulting in a gradually decreasing depletion zone and an increased dissolution rate 4, 5.
FIGURE 1: SCHEMATIC DRUG RELEASE FROM MATRIX DIFFUSION CONTROLLED-RELEASE DRUG DELIVERY SYSTEMS WITH THE DRUG HOMOGENOUSLY DISPERSED IN: (a) an erodible polymer matrix; and (b) a hydrophilic, sellable polymer matrix 6, 7
The investigation is concerned with development of sustained released matrix tablet of Verapamil hydrochloride, which acts as a calcium channel blocker, used as an anti-hypertensive drug. The Sustain release matrix tablet form of Verapamil hydrochloride was prepared by Wet Granulation
technique to compare and evaluate the in vitro drug
release profile of the formulation. Another objective of the investigation is to include different polymers with different concentration in various batches of the formulations to facilitate the drug release, which cause patient compliance as the dosing frequency is reduced.
MATERIALS & METHODS: The various
materials used in our study include Verapamil hydrochloride, HPMC K15M, Xanthan Gum, Guar Gum, Polyvinyl pyrrolidone, Isopropyl alcohol,
Magnesium stearate, Aerosil and Lactose 8, 9, 10.
Calibration curve of Verapamil hydrochloride in pH 0.1 N HCl:
Stock solution I: 10 mg of Verapamil
hydrochloride is taken in a 100 ml volumetric flask and added to 5 ml of water. Shake well and make up the volume to 100 ml with 0.1 N HCl to get concentration of 100 µg/ml.
Stock solution II: From the stock solution I, 1 ml is taken in 10 ml standard flask and make up the volume to 10 ml with 0.1 N HCl. From this various dilutions were made to get a final concentration of 2, 4, 6, 8, 10, 12 µg/ml. The absorbance of the above solution was measured at 278 nm using UV spectrophotometer.
Calibration curve of Verapamil hydrochloride in 6.8 pH Phosphate buffe
Stock solution I: 10 mg of Verapamil
hydrochloride is taken in a 100 ml volumetric flask and added to 5 ml of water. Shake well and make up the volume to 100 ml with 6.8 pH phosphate buffer to get concentration of 100 µg/ml.
Stock solution II: From the stock solution I, 1 ml is taken in 10 ml standard flask and make up the volume to 10 ml with 6.8 pH phosphate buffer.
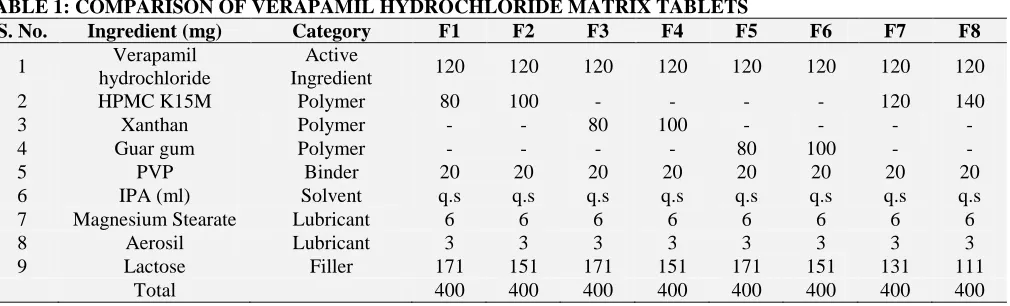
[image:2.612.90.523.122.314.2]Preparation of Tablets by Wet Granulation: The matrix tablets of Verapamil hydrochloride were prepared by wet granulation method using polymers as described in Table 1. The various excipients used are PVP (binder), IPA (alcohol), magnesium stearate (lubricant), aerosil (lubricant), lactose (filler). Drug and the Excipients except magnesium stearate and talc were blended geometrically in mortar and then IPA was added. Granules were obtained by passing the mass
[image:3.612.58.563.196.349.2]through sieve no. 22. The resulting granules were air dried at for 30 minutes and the dried granules were passed through sieve no. 12 and lubricated with magnesium stearate and aerosil. The granules so obtained were compressed into tablets of average weight 400 mg using 16*8 mm cylindrical punch. Eight formulations were prepared and coded as F1 to F8. F1, F2, F7 and F8 contain HPMC K15M and F3 and F4 contains Xanthan polymer while F5 and F6 contains Guar gum polymer.
TABLE 1: COMPARISON OF VERAPAMIL HYDROCHLORIDE MATRIX TABLETS
S. No. Ingredient (mg) Category F1 F2 F3 F4 F5 F6 F7 F8
1 Verapamil
hydrochloride
Active
Ingredient 120 120 120 120 120 120 120 120
2 HPMC K15M Polymer 80 100 - - - - 120 140
3 Xanthan Polymer - - 80 100 - - - -
4 Guar gum Polymer - - - - 80 100 - -
5 PVP Binder 20 20 20 20 20 20 20 20
6 IPA (ml) Solvent q.s q.s q.s q.s q.s q.s q.s q.s
7 Magnesium Stearate Lubricant 6 6 6 6 6 6 6 6
8 Aerosil Lubricant 3 3 3 3 3 3 3 3
9 Lactose Filler 171 151 171 151 171 151 131 111
Total 400 400 400 400 400 400 400 400
Assay of Verapamil hydrochloride tablets:
Twenty tablets were selected randomly from each batch and powdered in a mortar and accurately weighed tablet powder was placed in 50 ml volumetric flask. The drug was extracted into 25 ml 6.8 pH 6.8 Phosphate buffer with vigorous shaking on a mechanical shaker for few minutes. The volume was made up to the mark with 6.8 pH Phosphate buffer. The solution was filtered through Whattman filter paper and appropriate dilutions were further made with 6.8 pH Phosphate buffer. The dilutions samples were measured for the absorbance at 278 nm against blank (6.8 pH Phosphate buffer) and the drug content was calculated.
In vitro Dissolution Studies: The release rate of Verapamil hydrochloride tablets was determined using Dissolution Testing Apparatus 2 (paddle method). The dissolution test was performed using 900 ml of O.1 N HCl buffer for 2 h followed by pH 6.8 Phosphate buffer for 8 h. A sample (10 ml) of the solution was withdrawn from the dissolution apparatus hourly and the samples were replaced with fresh dissolution medium. The samples were filtered through a Whattman filter paper and diluted to a suitable concentration with of pH 0.1 N HCl
buffer for 2 h followed by pH 6.8 Phosphate buffer for 8 h. Absorbance of these solutions was measured at 278 nm using a UV Spectrophoto-meter. The dissolution conditions are mentioned in
table 2 and table 3.
TABLE 2: DISSOLUTION CONDITIONS FOR 2 HRS Medium pH 0.1 N HCl
Volume 900 ml
Temperature 37oC ± 0.5oC Apparatus USP type –II (paddle)
RPM 50
Time Interval 1 h
TABLE 3: DISSOLUTION CONDITIONS FOR 2 TO 10 HRS
Medium pH 6.8 Phosphate buffer
Volume 900 ml
Temperature 37oC ± 0.5oC Apparatus USP type –II (paddle)
RPM 50
Time Interval 1 h
formulated. The Verapamil hydrochloride tablets of the best formulation are tested for stability for 3 months in accelerated and long term test
conditions. The tablets are exposed to 400±20C and
75±5% RH conditions for 3 months. The tablets are observed for change in physical appearance, moisture content, assay values, impurities and dissolution values at end of first second and third month. Stability was determined.
Release kinetics: The results of in-vitro release profile obtained for all the formulations were plotted in modes of data treatment as follows.
1. Log cumulative percent drug remaining
versus time (first order kinetic model)
2. Cumulative percent drug release versus
square root of time (Higuchi’s model)
3. Cumulative percent drug release versus
time (zero order kinetic model)
4. Log cumulative Percent Drug released
versus log time (Korsmeyer model)
Drug release kinetics-model fitting of the dissolution Data: Whenever a new solid dosage form is developed or produced, it is necessary to ensure that drug dissolution occurs in an appropriate manner. Drug dissolution from solid dosage forms has been described by kinetic models in which the dissolved amount of drug (Q) is a function of the test time, t or Q = f (t). Some analytical definitions of the Q (t) function are commonly used such as zero order, first order, Higuchi, Korsmeyers-Peppas models. Other release parameters, such as dissolution time (tx%), dissolution efficacy (ED), difference factor (f1), similarity factor (f2) can be used to characterize drug dissolution / release profile.
Zero-order kinetics: A zero-order release would be predicted by the following equation.
At = Ao - Kot
Where, At = Drug release at time t; Ao = Initial
drug concentration; Ko = Zero-order rate constant
When the data is plotted as cumulative percent drug release versus time if the plot is linear then the data obeys zero-order release kinetics, with a slope
equal to Ko.
Use: This relation can be used to describe the drug dissolution of several types of modified release pharmaceutical dosage forms, as in case of some transdermal systems etc. the pharmaceutical dosage forms following this profile release the same amount of drug by unit of time and it is the ideal method of drug release in order to achieve a prolonged pharmacological action.
First-order kinetics: A first order release would be predicted by the following equation.
Log C = Log Co - Kt / 2.303
Where C = Amount of drug remained at time t; Co
= Initial amount of drug; K = First-order rate constant
When the data is plotted as log cumulative percent drug remaining versus time yields a straight line indicating the release follows first-order kinetics, the constant K can be obtained by multiplying 2.303 with slope values
Use: The pharmaceutical dosage forms containing water-soluble drugs in porous matrices, follows this type of dissolution profile. The release of the drug is proportional to the amount of drug remaining in its interior so that the amount of drug release by unit of time diminishes.
Higuchi Model: A form of the Higuchi Square Root Law is given by equation:
Q = Ks √t
Where, Q = Amount of drug dissolved at time t; Ks = Higuchi rate constant
The Higuchi square root equation describes the release from systems where the solid drug is dispersed in an insoluble matrix, and the rate of
Korsmeyer and Peppas Release Model: In order to understand the mode of release of drug from swellable matrices, the data were fitted to the following equation
Mt / M∞ = Ktn
Where, Mt / Mά = Fraction of drug released at time ‘t’; K = Constant incorporating the structural and geometrical characteristics of the drug/polymer system; n = Diffusion exponent related to the mechanism of release.
The above equation can be simplified by applying log on both sides we get
Log Mt / M∞ = Log K+ n Log t
When the data is plotted as a log of drug released versus log time, yields a straight line with a slope equal to n and the k can be obtained from y- intercept.
The value of n for a cylinder is <0.45 for Fickian release, > 0.45 and < 0.89 for Non-Fickian release, 0.89 for the case 2 release and > 0.89 for super case 2 type release.
RESULTS & DISCUSSION:
Pre compression studies: The pre compression properties of eight formulations (F1 to F8) were studied which includes bulk density, tapped density, compressibility index, Hausner’s ratio and angle of repose.
All the results were found to be within limits and
indicate the free flow (table 4).
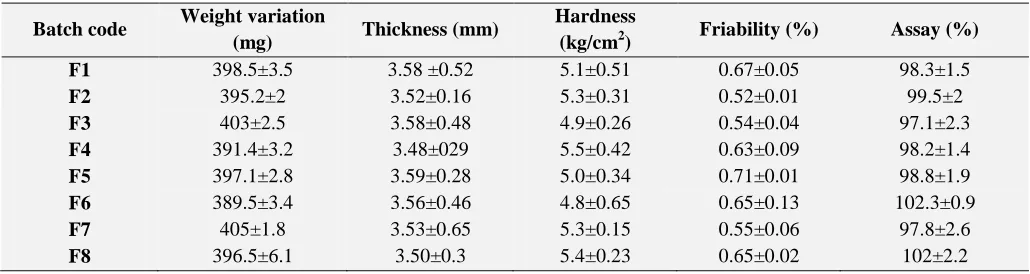
Post compression studies: The post compression properties were performed for all the formulations, which include hardness, friability, thickness, weight variation.
All the formulations were found to be within limits
[image:5.612.46.566.365.511.2]according to IP specifications (table 5).
TABLE 4: EVALUATION OF PRECOMPRESSED GRANULES OF VERAPAMIL HYDROCHLORIDE
Batch Code Bulk density (g/ml)
Tapped density (g/ml)
Compressibility
index (%) Hausner’s Ratio
Angle of Repose (θ)
F1 0.326±0.04 0.446±0.04 26.9±0.3 1.32±0.03 24.56 ±0.4
F2 0.412±0.03 0.506±0.06 18.5±0.1 1.25±0.04 25.12±0.2
F3 0.721±0.04 0.87±0.02 17.1±0.4 1.20±0.05 25.90±0.3
F4 0.710±0.05 0.873±0.03 19.7±0.5 1.25±0.01 23.75±0.4
F5 0.450±0.02 0.5855±0.04 23.07±0.2 1.30±0.03 25.70±0.5
F6 0.484±0.03 0.615±0.02 21.30±0.4 1.27±0.01 24.89±0.2
F7 0.41±0.04 0.483±0.04 15.11±0.3 1.17±0.04 24.65±0.8
F8 0.541±0.06 0.691±0.01 21.62±0.1 1.27±0.02 23.92± 0.6
Note: All values are expressed as mean ± SD, n=3
TABLE 5: EVALUATION OF COMPRESSED GRANULES OF VERAPAMIL HYDROCHLORIDE
Batch code Weight variation
(mg) Thickness (mm)
Hardness
(kg/cm2) Friability (%) Assay (%)
F1 398.5±3.5 3.58 ±0.52 5.1±0.51 0.67±0.05 98.3±1.5
F2 395.2±2 3.52±0.16 5.3±0.31 0.52±0.01 99.5±2
F3 403±2.5 3.58±0.48 4.9±0.26 0.54±0.04 97.1±2.3
F4 391.4±3.2 3.48±029 5.5±0.42 0.63±0.09 98.2±1.4
F5 397.1±2.8 3.59±0.28 5.0±0.34 0.71±0.01 98.8±1.9
F6 389.5±3.4 3.56±0.46 4.8±0.65 0.65±0.13 102.3±0.9
F7 405±1.8 3.53±0.65 5.3±0.15 0.55±0.06 97.8±2.6
F8 396.5±6.1 3.50±0.3 5.4±0.23 0.65±0.02 102±2.2
[image:5.612.52.567.542.679.2]TABLE 6: % DRUG RELEASE OF VERAPAMIL HCl (BATCH F1 TO F8) TIME
(h)
Batch code (% Drug Release)
F1 F2 F3 F4 F5 F6 F7 F8
1 11.1±0.5 9.7±0.4 12.2±0.6 14.5±0.5 13.8±0.9 16.7±1.5 7.2±0.4 7.6± 0.6
2 16.4±0.3 15.3±0.5 20.6±0.5 19.6±0.3 21.9±1.2 17.5±0.6 13.5±1.3 11.9±1.8
3 35.8±0.7 31.5±0.4 46.7±0.7 35.2±0.8 39.4±0.5 29.6±0.8 25.1±1.2 21.8±
4 49.6±0.4 42.4±0.6 61.4±0.2 54.3±0.5 65.1±0.7 48.2±0.2 36.3±0.8 29.3±2.2 5 61.4±0.3 59.9±0.8 78.8±0.4 69.1±0.9 81.2±0.6 65.8±0.3 54.1±0.9 44.9±0.9
6 85.8±0.5 72.7±0.3 97.5±0.3 85.3±1 97.9±0.8 87.2±0.6 65.5±0.5 53.4±1
8 95.1±0.4 86.7±0.5 - 97±0.4 - 97.7±0.9 72.3±0.9 67.2±0.6
10 - 98.5±0.7 - - - 89.4±0.8 81.9±0.7
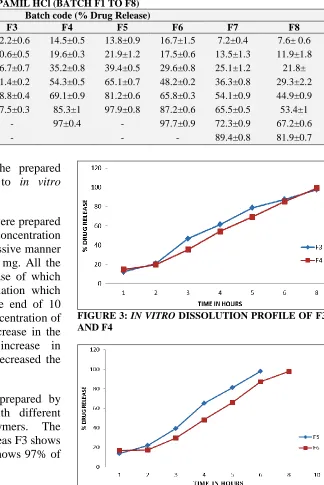
In vitro dissolution studies: All the prepared
batches of tablets were subjected to in vitro
dissolution studies (figures 2, 3, 4).
The formulations F1, F2, F7, and F8 were prepared by using HPMC as the polymer. The concentration of the polymer was increased in successive manner of 80 mg, 100 mg, 120 mg, and 140 mg. All the polymers showed effective drug release of which F2 was found to be the best formulation which exhibits 98.5% of drug release at the end of 10 hours. In case of F7 and F8, as the concentration of the polymer increased, there is an increase in the polymer matrix resulting in an increase in diffusional path length. This finally decreased the drug release from the polymer matrix.
The formulations F3 and F4 were prepared by using Xanthan as the polymer with different concentrations in both the polymers. The percentage drug release was fast, whereas F3 shows 97.5 % of release in 6 hours and F4 shows 97% of drug release in 8 hours.
[image:6.612.237.561.52.537.2]FIGURE 2: IN VITRO DISSOLUTION PROFILE OF F1, F2, F7 AND F8
FIGURE 3: IN VITRO DISSOLUTION PROFILE OF F3 AND F4
FIGURE 4: IN VITRO DISSOLUTION PROFILE OF F5 AND F6
The formulations F5 and F6 were prepared by using Guar gum as the polymer with the concentration of 80 mg and 100 mg respectively. The concentration of the polymer differs in both the formulations. F5 exhibits 97.9 % of drug release in 6 hours while F6 exhibits 97.7 % of the release after 8 hours. The increase in the concentration of the polymer decreased the drug release from the polymer matrix. Out of all the formulations, F2 was found to be the best formulation as it shows sustained release of the drug with 98.5%
[image:6.612.48.299.538.712.2]TABLE 7: DETERMINATION OF RELEASE KINETICS
Sl. No Time (h)
Square root
of time Log time
Cum % drug release
Log cum % drug release
Cum % drug remaining
Log cum % drug remaining
1 1 1.000 0.000 9.7 0.987 90.3 1.956
2 2 1.414 0.301 15.3 1.185 84.7 1.928
3 3 1.732 0.477 31.5 1.498 68.5 1.836
4 4 2.000 0.602 42.4 1.627 57.6 1.760
5 5 2.236 0.699 59.9 1.777 40.1 1.603
6 6 2.449 0.778 72.7 1.862 27.3 1.436
7 8 2.828 0.903 86.7 1.938 13.3 1.124
8 10 3.162 1.000 98.5 1.993 1.5 0.176
FIGURE 5: ZERO ORDER KINETICS FOR BEST FORMULATION (F2)
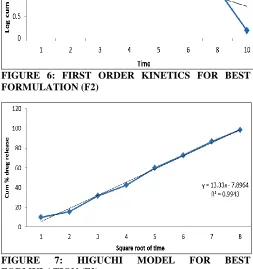
[image:7.612.216.554.56.357.2] [image:7.612.49.309.87.743.2]FIGURE 6: FIRST ORDER KINETICS FOR BEST FORMULATION (F2)
FIGURE 7: HIGUCHI MODEL FOR BEST FORMULATION (F2)
FIGURE 8: KORSMEYER AND PAPPAS MODEL FOR BEST FORMULATION
Release kinetics for best formulation: The release kinetics of Verapamil from the sustained release matrix tablets was studied by Zero order, First order, Higuchi model and Korsmeyer- Peppas model.
The results explain that the dissolution profile of the Verapamil hydrochloride will follow zero order and obeys Higuchi and Korsmeyer- Peppas model. The n value in the Peppas equation for the best formulation was found to be 0.143. Hence it indicates that release mechanism was Fickian diffusion.
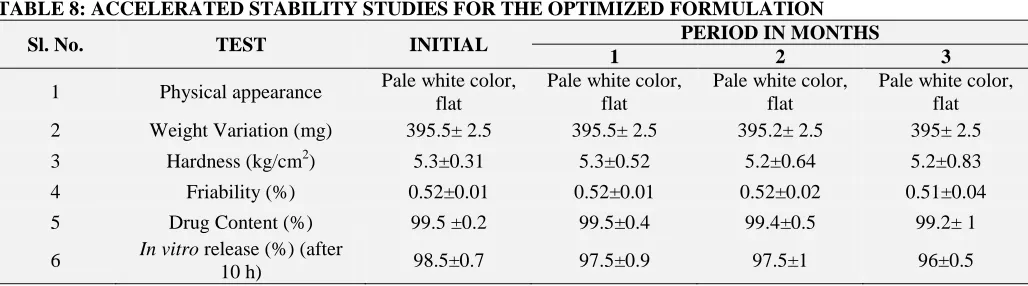
Stability studies: Stability studies were conducted
for the formulation F2 were performed at 400C / 75
% RH condition for a period of 3 months. The formulated tablets were analyzed for appearance,
weight variation, drug content and in vitro drug
release.
[image:7.612.47.300.464.733.2]TABLE 8: ACCELERATED STABILITY STUDIES FOR THE OPTIMIZED FORMULATION
Sl. No. TEST INITIAL PERIOD IN MONTHS
1 2 3
1 Physical appearance Pale white color, flat
Pale white color, flat
Pale white color, flat
Pale white color, flat
2 Weight Variation (mg) 395.5± 2.5 395.5± 2.5 395.2± 2.5 395± 2.5
3 Hardness (kg/cm2) 5.3±0.31 5.3±0.52 5.2±0.64 5.2±0.83
4 Friability (%) 0.52±0.01 0.52±0.01 0.52±0.02 0.51±0.04
5 Drug Content (%) 99.5 ±0.2 99.5±0.4 99.4±0.5 99.2± 1
6 In vitro release (%) (after
10 h) 98.5±0.7 97.5±0.9 97.5±1 96±0.5
Note: All values are expressed as mean ± SD, n=3.
CONCLUSION: The Sustain released matrix
tablet form of Verapamil hydrochloride was prepared by wet granulation technique. Various pre
compression properties of the prepared
formulations were done which include bulk density, tapped density, Carr’s index, Hausner’s ratio and angle of repose which were found to be in limits indicating the free flow. The post compression properties were performed for all the formulations, which include hardness, friability, thickness, weight variation and the formulations
were found to be within limits. The in vitro drug
release profile of the various formulations was performed and compared. The tablets formulated with HPMC K15M polymer shows more sustained action when compared to that of Xanthan and Guar gum. The high viscosity of the polymers binds the formation of matrix thus sustains the release of drug. It was also observed that the increase in concentration of the polymer decreased the drug release from the polymer matrix. F2 formulation showed best release profile where the release of drug from the matrix tablet was sustained for 10 hours.
ACKNOWLEDGEMENT: We are deeply
indebted & grateful to Alpex International Pvt. Ltd, Hyderabad for providing gift sample of pure drug. We are deeply thankful to the Management of C.L
Baid Metha College of Pharmacy, Chennai for granting us permission and encouragement to utilize the facilities in the college premises and support to bring this research in an effective way.
REFERNCES:
1. James Swarbrick. Encyclopedia of Pharmaceutical Technology. Informa healthcare; 2007.
2. Khan MG. Controlled release oral dosage forms: Some recent advances in matrix type drug delivery systems. The Sciences, 2001; 1(5): 350-354
3. Chien YW, Swarbrick J, Balyan JC. Encyclopedia of Pharmaceutical Technology. New York: CRS press; 1990 4. Ratial DA, Gaikwad PD, Bankar VH, Pawar SP. A review
on sustained released technology. Int J Res Ayur and Phar 2011; 2(6): 1701-1708.
5. Ray Brijesh, Gupta MM. Formulation and evaluation of once daily sustained release matrix tablet of verapamil hydrochloride. Journal of Drug Delivery & Therapeutics 2013; 3(1): 55-58
6. Sarika Pundir, Ashutosh Badola, Deepak Sharma. Sustained release matrix technology and recent advance in matrix drug delivery system: a review. Int J Drug Res Tech 2013; 3(1): 12-20
7. Sharma A, Sharma S, Jha KK. The study of salbutamol matrix tablets using different polymers as release retarding agent. The Pharma Research 2009; 01:15-22.
8. Reddy KR, Mutalik S, Reddy S. Once daily sustained release matrix tablets of nicorandil-formulation and in vitro evaluation. AAPS Pharm Sci Tech 2003; 4:1-9. 9. Available from: http://www.drugbank.com. [online]. 10. Available from: www.rxlist.com. [online].
11. Raymond C Rowe, Paul J Sheskey, Marian E Quinn. Hand book of pharmaceutical excipients. 6th ed. Wahington: RPS Publishing; 2006.
All © 2013 are reserved by International Journal of Pharmaceutical Sciences and Research. This Journal licensed under a Creative Commons Attribution-NonCommercial-ShareAlike 3.0 Unported License.
This article can be downloaded to ANDROID OS based mobile. Scan QR Code using Code/Bar Scanner from your mobile. (Scanners are available on Google Playstore)
How to cite this article: