0095-1137/11/$12.00
doi:10.1128/JCM.02270-10
Copyright © 2011, American Society for Microbiology. All Rights Reserved.
Application of TaqMan Low-Density Arrays for Simultaneous
Detection of Multiple Respiratory Pathogens
䌤
Maja Kodani,
1* Genyan Yang,
1Laura M. Conklin,
1Tatiana C. Travis,
1Cynthia G. Whitney,
1Larry J. Anderson,
2Stephanie J. Schrag,
1Thomas H. Taylor, Jr.,
1Bernard W. Beall,
1Robert F. Breiman,
4Daniel R. Feikin,
6M. Kariuki Njenga,
5Leonard W. Mayer,
1M. Steven Oberste,
2Maria Lucia C. Tondella,
1Jonas M. Winchell,
1Stephen L. Lindstrom,
3Dean D. Erdman,
2and Barry S. Fields
1Division of Bacterial Diseases,
1Division of Viral Diseases,
2Influenza Division,
3National Center for Immunization and
Respiratory Diseases, Office of The Director,
4Division of Global Disease Detection and Emergency Response,
Center for Global Health,
5and Division of Emerging Infections and Surveillance Services,
National Center for Preparedness, Detection and Control of Infectious Diseases,
6Centers for
Disease Control and Prevention, Atlanta, Georgia 30333
Received 10 November 2010/Returned for modification 4 January 2011/Accepted 25 March 2011
The large and growing number of viral and bacterial pathogens responsible for respiratory infections poses
a challenge for laboratories seeking to provide rapid and comprehensive pathogen identification. We evaluated
a novel application of the TaqMan low-density array (TLDA) cards for real-time PCR detection of 21
respiratory-pathogen targets. The performance of the TLDA was compared to that of individual real-time PCR
(IRTP) assays with the same primers and probes using (i) nucleic acids extracted from the 21 pathogen strains
and 66 closely related viruses and bacteria and (ii) 292 clinical respiratory specimens. With spiked samples,
TLDA cards were about 10-fold less sensitive than IRTP assays. By using 292 clinical specimens to generate
2,238 paired individual assays, the TLDA card exhibited 89% sensitivity (95% confidence interval [CI], 86 to
92%; range per target, 47 to 100%) and 98% specificity (95% CI, 97 to 99%; range per target, 85 to 100%) overall
compared to IRTP assays as the gold standard with a threshold cycle (
CT
) cutoff of 43. The TLDA card
approach offers promise for rapid and simultaneous identification of multiple respiratory pathogens for
outbreak investigations and disease surveillance.
Despite the high prevalence of acute respiratory infections
(ARI), no etiologic agent is identified in approximately 50%
of cases tested in studies of community-acquired pneumonia
(CAP) (20). In addition, mounting evidence indicates that
bac-terial and viral coinfections can play a major role in both CAP
and ARI (9–11, 13, 17). Accurate and rapid diagnosis of
etio-logic agents in respiratory illness can be challenging,
particu-larly during investigations of respiratory disease outbreaks of
unknown etiology, when there is an urgent need for
identifi-cation of a causative pathogen. While viral and bacterial
cul-ture, serology, immunoassays, and molecular diagnostics can
be employed to detect the presence of coinfections in
respira-tory illness, these techniques can be both costly and
time-consuming. More-efficient diagnostic tools are needed that can
provide rapid results for a number of pathogens without
com-promising sensitivity or specificity.
In recent years, a number of multiple-pathogen detection
systems have been developed and evaluated on respiratory
clinical specimens. These systems use multiplex PCR assays
combined with various detection systems, including mass
spec-troscopy, bead sorting, dye-labeled probes, and microarray
technology (1, 3, 18, 19). One drawback shared by all of the
technologies based on multiplex PCR is that each change to
existing primers or each addition of new primer pairs and
probes necessitates reevaluation of the sensitivity and
spec-ificity of the entire tool. As new sequence data and other
information on known pathogens become available, specific
quantitative PCR (qPCR) primers and probes may need to be
altered or added, but revalidation of an entire
multiple-pathogen detection assay is difficult and costly. Although not
previously applied to infectious-pathogen detection, a novel
microfluidic-technology format, the TaqMan low-density
ar-ray (TLDA) (Life Technologies, Carlsbad, CA), may provide a
useful platform for multiple-pathogen detection. TLDA is
based on singleplex qPCR assays and has been used extensively
in cancer research for multiple gene expression and
micro-RNA expression analyses (8, 21, 22).
In this study, we evaluated the TLDA format for rapid and
simultaneous singleplex detection of multiple viral and
bacte-rial respiratory pathogens. The advantage of the TLDA
plat-form is that it is a closed system incorporating validated
single-plex PCR methodology, which allows the flexibility to add new
primers and probes without recalibration of the others already
incorporated on the cards. Since the reagents for each assay
are preallocated to the reaction wells, this format is easy to use,
and the sample needs to be added only once. The TLDA card
is designed to run 24 duplicate assays, each providing a
real-time semiquantitative readout: one internal positive control
(IPC), two nucleic acid quality controls, and 21 pathogen
as-says. Our evaluation of the TLDA card, developed to detect
* Corresponding author. Mailing address: Division of Bacterial
Dis-eases, Centers for Disease Control and Prevention, 1600 Clifton Rd.,
Mailstop G03, Atlanta, GA 30333. Phone: (404) 639-4387. Fax: (404)
718-1855. E-mail: [email protected].
䌤
Published ahead of print on 6 April 2011.
2175
on May 16, 2020 by guest
http://jcm.asm.org/
both DNA and RNA from respiratory viruses and bacteria,
includes results from both analytical and clinical evaluations of
specificity and sensitivity relative to individual real-time PCR
(IRTP) assays.
MATERIALS AND METHODS
Strains and clinical specimens.All viral and bacterial isolates used in this study were obtained from Centers for Disease Control and Prevention (CDC) collections. Nasopharyngeal/oropharyngeal (NP/OP) swabs (n⫽272), lung tis-sue samples (n⫽15), and sputum samples (n⫽5) in these specialized collec-tions were obtained through routine surveillance and/or from respiratory illness outbreaks from 1990 to 2009 by the CDC in Atlanta, GA, as well as by the CDC surveillance, research, and outbreak response platform in Nairobi, Kenya (based at the Kenya Medical Research Institute [KEMRI]).
TNA extraction.Total nucleic acids (TNA) were extracted from viral isolates, bacterial isolates, and specimens (lung tissue or sputum specimens for assays used forLegionella; NP/OP specimens for all others) using the InviMag Bacteria DNA kit (Invitek, Germany) and the KingFisher ML extraction platform (Thermo Scientific, Waltham, MA) using the InviMag Viral settings. Despite the name, the InviMag Bacteria kit extracts both DNA and RNA from both viruses and bacteria (27). The procedure was performed according to the manufacturer’s instructions unless otherwise stated. Briefly, 200l of viral transport medium (VTM) containing NP swabs was incubated in a lysis buffer that includes a proprietary mix of digestive enzymes for 10 min at 65°C, followed by 10 min at 95°C. Approximately 30 mm3
of lung tissue or 125 mm3
of sputum was lysed in the same lysis buffer, but the incubation at 65°C was increased to overnight. Lysed samples were extracted using the KingFisher ML platform as recom-mended by the manufacturer with an elution volume of 260l (this is a deviation from a standard elution in 120l to accommodate the large volume required for performing many IRTPs). The samples were centrifuged for 1 min at maximum speed to collect leftover beads in the bottom of each tube. Isolated TNA were stored at⫺80°C.
Genomic DNA extraction and quantification.Genomic DNA, required for genome equivalent calculations, was purified from bacterial isolates using the Qiagen Genomic-tip 20/G according to the manufacturer’s instructions (Qiagen, Germany). Approximately 4.5⫻109bacterial cells were pelleted and lysed in the
presence of lysozyme and proteinase K for 30 min at 37°C, followed by 30 min at 50°C. These lysates were loaded onto the equilibrated Qiagen Genomic-tip 20/G. The samples were allowed to run through the column by gravity flow. The captured genomic DNA was washed three times with buffer QC (Qiagen, Ger-many) and was eluted with 1 ml of buffer QF (Qiagen, GerGer-many) twice. The DNA in the eluate was precipitated with isopropanol and was pelleted by centrifugation at 14,000⫻g. The pellet was washed and allowed to dissolve in elution buffer at room temperature overnight with shaking. The DNA was quantified using a NanoDrop spectrophotometer (Thermo Scientific, Wil-mington, DE).
IRTP.All individual real-time PCRs (IRTPs) were performed on the Applied Biosystems 7900HT real-time PCR platform in a 96-well format using the AgPath-ID One-Step kit (Applied Biosystems, Foster City, CA) (28). Each reaction mixture contained 1⫻reverse transcription-PCR (RT-PCR) buffer, 1⫻RT-PCR enzyme, 1⫻primer and probe mix, and 5l of TNA in a total volume of 25l. Primers and probes for each assay were premixed, aliquoted, and stored at ⫺20°C until use. All master mixes for reactions were prepared and aliquoted into 96-well plates in a clean room to limit the possibility of contamination with the template or PCR products. The template was subsequently added to the prealiquoted master mix in another room. The plates were sealed, centrifuged at 750⫻gfor 2 min, and placed in the thermal cycler. The following cycling conditions were used for all IRTP applications: 45°C for 10 min, 94°C for 10 min, and 45 cycles of 94°C for 30 s followed by 60°C for 1 min.
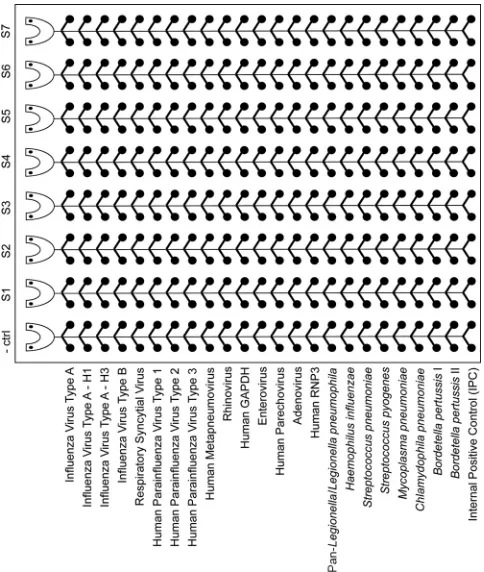
TLDA card design.TaqMan low-density array (TLDA) cards (Applied Bio-systems, Foster City, CA) are 384-well microfluidic cards with eight ports, each containing 48 connected wells (Fig. 1). The primers and probe for each assay are preloaded and dried onto the designated duplicate wells. All probes used on our card are conjugated to 6-carboxyfluorescein (FAM) except for theLegionella pneumophilaprobe, which is conjugated to hexachlorofluorescein (HEX). Black hole quencher 1 (BHQ1) was used as a quencher for all probes (28). The TLDA respiratory-pathogen card is designed to run seven samples and a negative-control sample on one card. Alternatively, a positive negative-control can be added to one port, allowing six samples to be run per card. Each port tests against 13 viral targets and 8 bacterial targets in duplicate. All the assays and their respective target genes are listed in Table 1. The card also features three control assays,
including the internal positive control (IPC) and two specimen quality control assays, for the glyceraldehyde 3-phosphate dehydrogenase (GAPDH) and RNase P (RNP3) genes.
TLDA card processing.All TLDA cards were run on the Applied Biosystems 7900HT real-time PCR platform using the AgPath-ID One-Step kit (Applied Biosystems, Foster City, CA). The master mix for each TLDA card was prepared in a clean room, and it included 1⫻RT-PCR buffer and 1⫻RT-PCR enzyme in a final volume of 80l per port. Twenty microliters of TNA was added to the master mix, resulting in the same primer-probe and template concentrations as those for the IRTPs. Each reaction was mixed by pipetting and was dispensed into loading wells on the TLDA card. The final volume in each TLDA well is approximately 1l. The excess volume was necessary for proper loading of small microfluidic ports. Each run included at least one negative control. The cards were centrifuged twice at 336⫻gfor 1 min each time, sealed, and placed in the thermal cycler. The following cycling conditions were used for all TLDA appli-cations: 45°C for 10 min, 94°C for 10 min, and 45 cycles of 94°C for 30 s followed by 60°C for 1 min.
Analysis of the reproducibility of the TLDA assays.Samples of total nucleic acids from all bacteria and viruses represented on the card were pooled, ali-quoted, and stored at⫺80°C. One aliquot was loaded into all seven wells of one TLDA card, for a total of 14 separate reactions per target. Finally, additional aliquots of the nucleic acid pool were run on two additional days in either one or two ports per day for a total of five different TLDA cards.
Analytical specificity.The analytical specificity of the assays was tested in two stages. First, TNA from all viruses and bacteria from the card were loaded into individual wells and were tested for cross-reactivity between the pathogens
pres-FIG. 1. TaqMan low-density array (TLDA) card layout including
the respiratory pathogens. TLDA cards were customized to include
singleplex real-time PCR assays for 13 viruses and 8 bacteria known to
cause acute respiratory infections. These microfluidic cards contain
384 individual wells separated into eight loading ports with 48 assay
wells each (
⫺
ctrl, negative control; S1 to S7, samples 1 through 7).
This format allows for easy loading of eight specimens and for the
performance of each assay in duplicate. Upon completion of specimen
loading, all wells are sealed individually for singleplex reactions. Each
CDC respiratory panel TLDA card has built-in controls, including the
internal positive control (IPC) and two human DNA/RNA controls,
GAPDH and RNP3, respectively.
on May 16, 2020 by guest
http://jcm.asm.org/
[image:2.585.300.542.69.355.2]ent on the card. Second, 20-ng portions of TNA from representative isolates of commensal flora and viral pathogens not represented on the card were analyzed for cross-reactivity (see Table 3).
Analytical sensitivity.Two different sets of experiments were performed to test for analytical sensitivity: comparative analytical-sensitivity experiments and com-parative limit-of-detection (LOD) experiments. First, a 10-fold serial dilution of the pooled template mixture was performed, and each dilution was aliquoted and frozen at⫺80°C. Each member of the dilution series was analyzed in
quadru-plicate using two TLDA cards, and the highest dilution at which at least three out of four replicates tested positive was considered the lowest detectable concen-tration for that assay. For comparison, the appropriate IRTPs were performed on the serial dilution series in quadruplicate to determine the lowest dilution at which at least three out of four replicates were positive.
[image:3.585.58.538.83.578.2]The limit of detection was determined for each target by comparing TLDA cards and the corresponding IRTPs. Different methods of determining the lower limit of detection were used for different assays. The 50% egg infectious dose
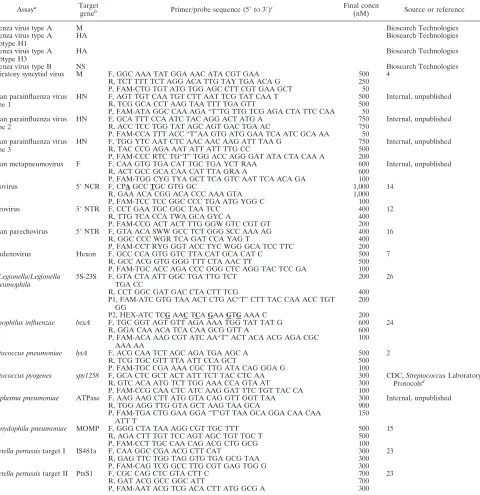
TABLE 1. Primers and probes used in this study
Assaya Target
geneb Primer/probe sequence (5⬘to 3⬘)c Final concn
(nM) Source or reference
Influenza virus type A M Biosearch Technologies
Influenza virus type A subtype H1
HA Biosearch Technologies
Influenza virus type A subtype H3
HA Biosearch Technologies
Influenza virus type B NS Biosearch Technologies
Respiratory syncytial virus M F, GGC AAA TAT GGA AAC ATA CGT GAA 500 4
R, TCT TTT TCT AGG ACA TTG TAY TGA ACA G 250
P, FAM-CTG TGT ATG TGG AGC CTT CGT GAA GCT 50
Human parainfluenza virus type 1
HN F, AGT TGT CAA TGT CTT AAT TCG TAT CAA T 500 Internal, unpublished
R, TCG GCA CCT AAG TAA TTT TGA GTT 500
P, FAM-ATA GGC CAA AGA “T”TG TTG TCG AGA CTA TTC CAA 50 Human parainfluenza virus
type 2
HN F, GCA TTT CCA ATC TAC AGG ACT ATG A 750 Internal, unpublished
R, ACC TCC TGG TAT AGC AGT GAC TGA AC 750
P, FAM-CCA TTT ACC “T”AA GTG ATG GAA TCA ATC GCA AA 50 Human parainfluenza virus
type 3
HN F, TGG YTC AAT CTC AAC AAC AAG ATT TAA G 750 Internal, unpublished
R, TAC CCG AGA AAT ATT ATT TTG CC 500
P, FAM-CCC RTC TG“T” TGG ACC AGG GAT ATA CTA CAA A 200
Human metapneumovirus F F, CAA GTG TGA CAT TGC TGA YCT RAA 600 Internal, unpublished
R, ACT GCC GCA CAA CAT TTA GRA A 600
P, FAM-TGG CYG TYA GCT TCA GTC AAT TCA ACA GA 100
Rhinovirus 5⬘NCR F, CPAGCCTGC GTG GC 1,000 14
R, GAA ACA CGG ACA CCC AAA GTA 1,000
P, FAM-TCC TCC GGC CCC TGA ATG YGG C 100
Enterovirus 5⬘NTR F, CCT GAA TGC GGC TAA TCC 400 12
R, TTG TCA CCA TWA GCA GYC A 400
P, FAM-CCG ACT ACT TTG GGW GTC CGT GT 200
Human parechovirus 5⬘NTR F, GTA ACA SWW GCC TCT GGG SCC AAA AG 400 16
R, GGC CCC WGR TCA GAT CCA YAG T 400
P, FAM-CCT RYG GGT ACC TYC WGG GCA TCC TTC 200
Pan-adenovirus Hexon F, GCC CCA GTG GTC TTA CAT GCA CAT C 500 7
R, GCC ACG GTG GGG TTT CTA AAC TT 500
P, FAM-TGC ACC AGA CCC GGG CTC AGG TAC TCC GA 100
Pan-Legionella/Legionella pneumophila
5S-23S F, GTA CTA ATT GGC TGA TTG TCT TGA CC
200 26
R, CCT GGC GAT GAC CTA CTT TCG 400
P1, FAM-ATC GTG TAA ACT CTG AC“T” CTT TAC CAA ACC TGT GG
200
P2, HEX-ATC TCGAACTCAGAAGTGAAA C 200
Haemophilus influenzae bexA F, TGC GGT AGT GTT AGA AAA TGG TAT TAT G 600 24
R, GGA CAA ACA TCA CAA GCG GTT A 600
P, FAM-ACA AAG CGT ATC AA“T” ACT ACA ACG AGA CGC AAA AA
100
Streptococcus pneumoniae lytA F, ACG CAA TCT AGC AGA TGA AGC A 500 2
R, TCG TGC GTT TTA ATT CCA GCT 500
P, FAM-TGC CGA AAA CGC TTG ATA CAG GGA G 100
Streptococcus pyogenes spy1258 F, GCA CTC GCT ACT ATT TCT TAC CTC AA 300 CDC,StreptococcusLaboratory Protocolsd
R, GTC ACA ATG TCT TGG AAA CCA GTA AT 300
P, FAM-CCG CAA CTC ATC AAG GAT TTC TGT TAC CA 100
Mycoplasma pneumoniae ATPase F, AAG AAG CTT ATG GTA CAG GTT GGT TAA 300 Internal, unpublished
R, TGG AGG TTG GTA GCT AAG TAA GCA 900
P, FAM-TGA CTG GAA GGA “T”GT TAA GCA GGA CAA CAA ATT T
150
Chlamydophila pneumoniae MOMP F, GGG CTA TAA AGG CGT TGC TTT 500 15
R, AGA CTT TGT TCC AGT AGC TGT TGC T 500
P, FAM-CCT TGC CAA CAG ACG CTG GCG 100
Bordetella pertussistarget I IS481a F, CAA GGC CGA ACG CTT CAT 300 23
R, GAG TTC TGG TAG GTG TGA GCG TAA 300
P, FAM-CAG TCG GCC TTG CGT GAG TGG G 300
Bordetella pertussistarget II PtxS1 F, CGC CAG CTC GTA CTT C 700 23
R, GAT ACG GCC GGC ATT 700
P, FAM-AAT ACG TCG ACA CTT ATG GCG A 300
a
The rhinovirus, enterovirus, andMycoplasma pneumoniaeassays have been updated and will be replaced on future cards. For theMycoplasma pneumoniaeassay, see reference 25.
b
NCR, noncoding region; NTR, nontranslated region; MOMP, major outer membrane protein.
c
F, forward primer; R, reverse primer; P, probe. Quotation marks around a letter indicate an internal quencher. Underlining and boldface indicate a locked nucleic acid.
d
http://www.cdc.gov/ncidod/biotech/strep/protocols.htm.
on May 16, 2020 by guest
http://jcm.asm.org/
(EID50) per milliliter was used for all influenza assays; quantified transcripts
were used for human parechovirus (HPeV) and enterovirus (EV); quantified armored RNA was used for respiratory syncytial virus (RSV), human parainflu-enza virus types 1 to 3 (HPIV1 to HPIV3), human metapneumovirus (HMPV), and rhinovirus (RV); and genome equivalents were used for adenovirus and all bacterial assays. Ten-fold serial dilutions of each viral and bacterial strain were analyzed for the lowest detectable concentration range where at least three out of four replicates tested positive. Although this is a relatively low number of replicates for determination of the LOD, the main goal was to compare TLDA and IRTP performance on the same set of dilutions.
Clinical validation.Samples were processed in groups of seven, and both TLDA cards and IRTPs were run on the same day without a freeze-thaw cycle in between. IRTPs were run in duplicate to match the format of the TLDA cards. A TLDA or IRTP result was considered positive if it passed internal positive controls, had an exponential growth curve, and had at least one run less than or equal to the threshold cycle (CT) cutoff value.
Study design. The study design was a paired-specimen evaluation where matched results by TLDA and IRTP for a range of 21 pathogens were compared in terms of sensitivity and specificity. Each specimen was tested on a TLDA card for the 21 targets described above using cards manufactured in the same batch. Specimens were handled in “analysis groups” or “collections” of about 30 spec-imens to accommodate efficient processing, especially of the IRTP assays. From an available collection of 292 specimens, a random sample of 79 specimens was selected for complete paired testing for each of the 21 pathogens by both the TLDA and IRTPs. Additional specimens were selected for testing by both assays. These were any specimens that were positive by TLDA but were not tested by IRTP. Selection of specimens with a positive TLDA result ensured additional data points for analysis. In addition, due to the large number of positive results obtained forStreptococcus pneumoniaeby the TLDA, all specimens were ana-lyzed by IRTP assay forS. pneumoniae.
Statistical analysis.The performance of the TLDA was analyzed for repro-ducibility and in comparison to IRTP. Reprorepro-ducibility experiments were per-formed on four TLDA cards within the same batch to determine if there was a statistically significant difference in results within the seven ports of a card and between cards. The clinical sensitivity and specificity of TLDA were determined by comparison to the IRTP as the “gold standard,” i.e., assuming that the IRTP was 100% sensitive and specific. We performed all clinical sensitivity and spec-ificity analyses usingCTcutoffs of 43 and 35.
RESULTS
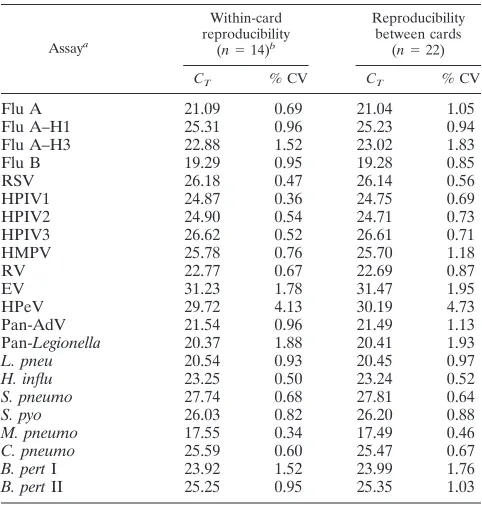
Reproducibility of the TLDA.
The reproducibility of the
C
Tvalues within one card or between different cards from the
same production lot was based on 828 total observations with
a
P
value of
ⱕ
0.0001 by analysis of variance (ANOVA). Within
individual pathogens and across four cards, the highest
coeffi-cient of variance (CV) was 4.7% (HPeV), the lowest CV was
0.46% (
Mycoplasma pneumoniae
), and 13/22 (59%) pathogens
exhibited CVs under 1% (Table 2). Within individual cards, for
a given pathogen, the median CV was 0.51% and the mean was
0.80%. There were only two instances of CVs above 4%, both
for HPeV, on cards 3 (6.1%) and 4 (4.1%) (Table 2 and data
not shown). Among all four cards and all pathogens, 95% of
the within-card and within-pathogen CVs were below 2.91%.
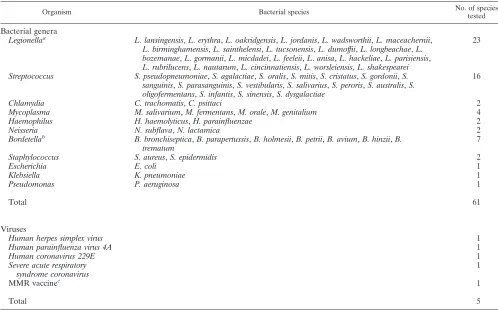
Analytical specificity and sensitivity of the TLDA.
All assays
on the TLDA card showed high specificity when testing was
performed on bacterial and viral isolates and the
near-neigh-bor panel. By design, some assays detected multiple species or
subtypes; these included the influenza virus type A
(unpub-lished data), pan-
Legionella
/
L. pneumophila
(26), and
Borde-tella pertussis
assays (23). Specimens positive for influenza virus
type A were also further subtyped by the TLDA into H1 or H3.
Any influenza virus type A specimens negative for both the H1
and H3 epitopes were characterized as unsubtypeable. The
pan-
Legionella
assay (26) was designed to amplify all
Legionella
species, and all species listed in Table 3 were amplified, as
expected. On the other hand, the
Legionella pneumophila
(all
serogroups) assay was specific for this species, as expected. By
design, the
B. pertussis
target I assay amplified
Bordetella
per-tussis
and
Bordetella holmesii
, while the
B. pertussis
target II
assay amplified
B. pertussis
,
Bordetella parapertussis
, and
Bor-detella bronchiseptica
(23). Only one cross-reaction was
discov-ered during the analytical validation: the rhinovirus assay
non-specifically amplified characterized enterovirus type strain
TNA on TLDA cards and in the IRTP assays. None of the
61 commensal flora and closely related bacteria and none of
the 5 viruses were detected by the TLDA respiratory panel
(Table 3).
The LOD was determined for all viruses and bacteria on the
TLDA respiratory-panel card and was compared to the LOD
for the respective IRTP (Table 4). Highly purified, quantified
genomic DNA was used for these experiments. Some assays
exhibited the same LOD for the TLDA and the IRTP,
includ-ing the HPIV2, HMPV,
Haemophilus influenzae
,
B. pertussis
[image:4.585.300.541.80.333.2]target I, and
B. pertussis
target II assays. Assays that were
10-fold less sensitive by the TLDA included the influenza virus
type A, influenza virus type A subtype H1, influenza virus type
A subtype H3, influenza virus type B, HPIV1, HPIV3, RV, EV,
and HPeV assays, the pan-adenovirus assay tested by
adeno-virus 11, and the pan-
Legionella
,
L. pneumophila
,
S.
pneu-moniae
,
Streptococcus pyogenes
, and
M. pneumoniae
assays. A
few assays exhibited a 100-fold reduction in analytical
sensitiv-ity, specifically, the RSV assay, the pan-adenovirus assay tested
by adenovirus 15, and the
Chlamydophila pneumoniae
assay.
TABLE 2. TLDA reproducibility
Assaya
Within-card reproducibility
(n⫽14)b
Reproducibility between cards
(n⫽22)
CT % CV CT % CV
Flu A
21.09
0.69
21.04
1.05
Flu A–H1
25.31
0.96
25.23
0.94
Flu A–H3
22.88
1.52
23.02
1.83
Flu B
19.29
0.95
19.28
0.85
RSV
26.18
0.47
26.14
0.56
HPIV1
24.87
0.36
24.75
0.69
HPIV2
24.90
0.54
24.71
0.73
HPIV3
26.62
0.52
26.61
0.71
HMPV
25.78
0.76
25.70
1.18
RV
22.77
0.67
22.69
0.87
EV
31.23
1.78
31.47
1.95
HPeV
29.72
4.13
30.19
4.73
Pan-AdV
21.54
0.96
21.49
1.13
Pan-
Legionella
20.37
1.88
20.41
1.93
L. pneu
20.54
0.93
20.45
0.97
H. influ
23.25
0.50
23.24
0.52
S. pneumo
27.74
0.68
27.81
0.64
S. pyo
26.03
0.82
26.20
0.88
M. pneumo
17.55
0.34
17.49
0.46
C. pneumo
25.59
0.60
25.47
0.67
B. pert
I
23.92
1.52
23.99
1.76
B. pert
II
25.25
0.95
25.35
1.03
aFlu A, influenza virus type A; Flu A–H1, influenza virus type A subtype H1;
RSV, respiratory syncytial virus; HPIV1, human parainfluenza virus type 1; HMPV, human metapneumovirus; RV, rhinovirus; EV, enterovirus; HPeV, hu-man parechovirus; pan-AdV, pan-adenovirus;L.pneu,Legionella pneumophila; H.influ,Haemophilus influenzae;S.pneumo,Streptococcus pneumoniae;S.pyo, Streptococcus pyogenes;M.pneumo,Mycoplasma pneumoniae;C.pneumo, Chla-mydophila pneumoniae;B.pertI,Bordetella pertussistarget I.
bn, number of replicates;C
T, threshold cycle; % CV, percent coefficient of
variance.
on May 16, 2020 by guest
http://jcm.asm.org/
Clinical sensitivity and specificity of TLDA.
Clinical
valida-tion of the TLDA cards was performed on 292 clinical
speci-mens obtained retrospectively from CDC frozen-specimen
col-lections. Of these, 14 were excluded from the analysis because
they gave negative results for both human controls (RNP3 and
GAPDH) on the TLDA. Of the remaining 278 samples, all
tested positive for at least one pathogen by either the IRTP
assay or the TLDA card. Exactly 50% (146/292) of the
speci-mens were positive for more than one pathogen. Forty-two
percent (61/146) of these were positive for three or more
pathogens. None of the 44 negative controls gave a positive test
result for any of the pathogens.
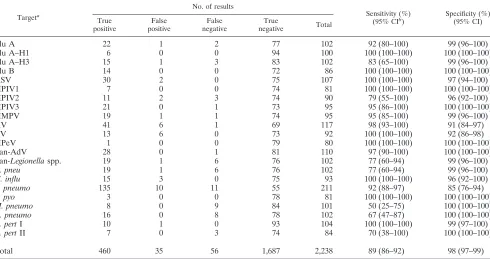
We first analyzed the performance of the TLDA card
com-pared to the IRTP assay as the “gold standard” by using a
C
Tcutoff of 43. This cutoff was chosen as a liberal definition of
“positive” and was applied to both the TLDA and IRTP assays.
Table 5 shows the number of specimens analyzed for each
pathogen and the corresponding sensitivity and specificity of
the TLDA card at this
C
Tcutoff. Although the sample sizes for
some pathogens were small and confidence intervals were
wide, the overall performance of the TLDA card fell within
10% of that of the combined IRTPs. The card was most
sen-sitive for 10 of the 21 pathogens, detecting
ⱖ
95% of
IRTP-positive influenza virus type A subtype H1, RSV, HPIV1,
HPIV3, HMPV, RV, HPeV, pan-adenovirus,
H. influenzae
,
and
S. pyogenes
samples. The pathogens for which the TLDA
card had the lowest sensitivity (
ⱕ
75%) were
M. pneumoniae
,
C. pneumoniae
, and
B. pertussis
target II. The TLDA card was
comparable in specificity to the IRTP assays for most
patho-gens, ranging from 92 to 100%, except for
S. pneumoniae
, for
which it had a specificity of 85%.
For a more conservative definition of a positive result, we
lowered the
C
Tcutoff from 43 to 35, which resulted in a small
net gain in TLDA card sensitivity without changes in specificity
relative to the IRTP assay, although the performance by
patho-gen differed greatly (data not shown). The TLDA card showed
higher sensitivity for eight pathogens, lower sensitivity for nine,
and unchanged sensitivity for four at this threshold. The most
notable differences with the cutoff of 35 were the
M.
pneu-moniae
and
C. pneumoniae
results, which increased in
sensi-tivity by 33%. The change in the specificity of the TLDA card
was less notable, with results differing 0 to 9% from their
values at the
C
Tcutoff of 43.
DISCUSSION
Viruses and bacteria are responsible for a large number of
community-acquired pneumonia and upper respiratory tract
infection cases on a global level, both as independent
infec-tions and as coinfecinfec-tions (5, 10, 11, 13). In this study, we
evaluated the sensitivity and specificity of the TaqMan
low-density array (TLDA) cards for the identification of 21
respi-TABLE 3. Cross-reactivity panel used to assess the analytical specificity of the TLDA assay
Organism Bacterial species No. of species
tested
Bacterial genera
Legionella
aL. lansingensis
,
L. erythra
,
L. oakridgensis
,
L. jordanis
,
L. wadsworthii
,
L. maceachernii
,
L. birminghamensis
,
L. sainthelensi
,
L. tucsonensis
,
L. dumoffii
,
L. longbeachae
,
L.
bozemanae
,
L. gormanii
,
L. micdadei
,
L. feeleii
,
L
.
anisa
,
L. hackeliae
,
L. parisiensis
,
L. rubrilucens
,
L. nautarum
,
L. cincinnatiensis
,
L. worsleiensis
,
L. shakespearei
23
Streptococcus
S. pseudopneumoniae
,
S. agalactiae
,
S. oralis
,
S. mitis
,
S. cristatus
,
S. gordonii
,
S.
sanguinis
,
S. parasanguinis
,
S. vestibularis
,
S. salivarius
,
S. peroris
,
S. australis
,
S.
oligofermentans
,
S. infantis
,
S. sinensis
,
S. dysgalactiae
16
Chlamydia
C. trachomatis
,
C. psittaci
2
Mycoplasma
M. salivarium
,
M. fermentans
,
M. orale
,
M. genitalium
4
Haemophilus
H. haemolyticus
,
H. parainfluenzae
2
Neisseria
N. subflava
,
N. lactamica
2
Bordetella
bB. bronchiseptica
,
B. parapertussis
,
B. holmesii
,
B. petrii
,
B. avium
,
B. hinzii
,
B.
trematum
7
Staphylococcus
S. aureus
,
S. epidermidis
2
Escherichia
E. coli
1
Klebsiella
K. pneumoniae
1
Pseudomonas
P. aeruginosa
1
Total
61
Viruses
Human herpes simplex virus
1
Human parainfluenza virus 4A
1
Human coronavirus 229E
1
Severe acute respiratory
syndrome coronavirus
1
MMR vaccine
c1
Total
5
aThe pan-Legionellaassay recognized all of the species, as expected. No species other thanL. pneumophilacross-reacted with theL. pneumophilaassay. bB. parapertussisandB. bronchisepticawere amplified only by the BP2 assay, as expected.B. holmesiiwas amplified only by the BP1 assay, as expected. cMMR, measles, mumps, and rubella.
on May 16, 2020 by guest
http://jcm.asm.org/
[image:5.585.42.540.81.391.2]ratory-pathogen targets compared to individual real-time
PCRs (IRTPs) using the same extraction techniques and the
same primers and probes.
The TLDA card format offers several advantages over
IRTP. First, it allows for the detection of multiple pathogens
simultaneously, thereby eliminating the need to transport,
reg-ister, aliquot, and process clinical specimens for different
pathogens sequentially. This reduces the amount of handling
required and the chance for human error. In an outbreak
investigation, one laboratory technician can complete the
de-tection of 21 pathogens from multiple patient samples within
3 h, whereas running IRTP assays would take significantly
longer. Second, the TLDA card requires a much smaller
amount of nucleic acids than an IRTP; more than 210
l of
TNA is required for the detection of 21 pathogens using
indi-vidual assays in duplicate, but only 20
l of TNA is needed for
the TLDA. This allows for the testing of multiple pathogens
even when the available clinical sample is small, obviating the
need to choose between suspected pathogens. In addition, the
TLDA card offers a singleplex, preformulated panel that helps
to avoid extensive assay optimization and to minimize
cross-contamination.
[image:6.585.42.283.81.321.2]In analytical studies, we found that TLDA cards require
somewhat higher concentrations of nucleic acids than IRTPs
(i.e., 10-fold more RNA or DNA; range, 1 to 1,000), although
this difference was not reflected in the detection of most
pathogens after evaluation of clinical specimens. One of the
limitations of this experiment was a low number of
repli-cates. However, the goal was not validation of individual
TABLE 4. Limits of detection of the TLDA and IRTP assays
Assay and targeta
LOD range
Unit of measureb
Fold decrease in TLDA
LOD IRTP
assay TLDA
Flu A
Template A 0.6–6 6–60 EID50/ml (H1) 10
Template B 6–60 60–600 EID50/ml (H3) 10
Flu A–H1 0.6–6 6–60 EID50/ml 10
Flu A–H3 6–60 60–600 EID50/ml 10
Flu B 0.6–6 6–60 EID50/ml 10
RSV 0.6–6 60–600 Transcripts/l 100
HPIV1 60–600 600–6000 Transcripts/l 10
HPIV2 6–60 6–60 Transcripts/l 1
HPIV3 6–60 60–600 Transcripts/l 10
HMPV 600–6000 600–6000 Transcripts/l 1
RV 0.6–6 6–60 Transcripts/l 10
EV 6–60 60–600 Transcripts/l 10
HPeV 0.6–6 6–60 Transcripts/l 10
Pan-AdV
AV11 0.6–6 6–60 GE/l (AV11) 10
AV15 6–60 600–6000 GE/l (AV15) 100
Pan-Legionellaspp. 0.06–0.6 0.6–6 GE/l 10 L. pneu 0.06–0.6 0.6–6 GE/l 10 H. influ 0.6–6 0.6–6 GE/l 1 S. pneumo 0.6–6 6–60 GE/l 10 S. pyo 6–60 60–600 GE/l 10 M. pneumo 0.06–0.6 0.6–6 GE/l 10 C. pneumo 0.04–0.4 4–40 IFU/ml 100 B. pertI 6–60 6–60 GE/l 1 B. pertII 6–60 6–60 GE/l 1
a
Flu A, influenza virus type A; Flu A–H1, influenza virus type A subtype H1; RSV, respiratory syncytial virus; HPIV1, human parainfluenza virus type 1; HMPV, human metapneumovirus; RV, rhinovirus; EV, enterovirus; HPeV, hu-man parechovirus; pan-AdV, pan-adenovirus; AV11, adenovirus 11;L.pneu, Legionella pneumophila;H.influ,Haemophilus influenzae;S.pneumo, Streptococ-cus pneumoniae;S.pyo,Streptococcus pyogenes;M.pneumo,Mycoplasma pneu-moniae;C.pneumo,Chlamydophila pneumoniae;B.pertI,Bordetella pertussis target I.
b
EID50, 50% egg infectious dose; GE, genome equivalents; IFU,
inclusion-forming units.
TABLE 5. Sensitivity and specificity of TLDA assays compared to individual real-time PCR assays using a
C
Tcutoff of 43
Targeta
No. of results
Sensitivity (%) (95% CIb
)
Specificity (%) (95% CI) True
positive
False positive
False negative
True
negative Total
Flu A
22
1
2
77
102
92 (80–100)
99 (96–100)
Flu A–H1
6
0
0
94
100
100 (100–100)
100 (100–100)
Flu A–H3
15
1
3
83
102
83 (65–100)
99 (96–100)
Flu B
14
0
0
72
86
100 (100–100)
100 (100–100)
RSV
30
2
0
75
107
100 (100–100)
97 (94–100)
HPIV1
7
0
0
74
81
100 (100–100)
100 (100–100)
HPIV2
11
2
3
74
90
79 (55–100)
96 (92–100)
HPIV3
21
0
1
73
95
95 (86–100)
100 (100–100)
HMPV
19
1
1
74
95
95 (85–100)
99 (96–100)
RV
41
6
1
69
117
98 (93–100)
91 (84–97)
EV
13
6
0
73
92
100 (100–100)
92 (86–98)
HPeV
1
0
0
79
80
100 (100–100)
100 (100–100)
Pan-AdV
28
0
1
81
110
97 (90–100)
100 (100–100)
Pan
-Legionella
spp.
19
1
6
76
102
77 (60–94)
99 (96–100)
L. pneu
19
1
6
76
102
77 (60–94)
99 (96–100)
H. influ
15
3
0
75
93
100 (100–100)
96 (92–100)
S. pneumo
135
10
11
55
211
92 (88–97)
85 (76–94)
S. pyo
3
0
0
78
81
100 (100–100)
100 (100–100)
M. pneumo
8
0
9
84
101
50 (25–75)
100 (100–100)
C. pneumo
16
0
8
78
102
67 (47–87)
100 (100–100)
B. pert
I
10
1
0
93
104
100 (100–100)
99 (97–100)
B. pert
II
7
0
3
74
84
70 (38–100)
100 (100–100)
Total
460
35
56
1,687
2,238
89 (86–92)
98 (97–99)
a
Flu A, influenza virus type A; Flu A–H1, influenza virus type A subtype H1; RSV, respiratory syncytial virus; HPIV1, human parainfluenza virus type 1; HMPV, human metapneumovirus; RV, rhinovirus; EV, enterovirus; HPeV, human parechovirus; pan-AdV, pan-adenovirus;L.pneu,Legionella pneumophila;H.influ, Haemophilus influenzae;S.pneumo,Streptococcus pneumoniae;S.pyo,Streptococcus pyogenes;M.pneumo,Mycoplasma pneumoniae;C.pneumo,Chlamydophila pneumoniae;B.pertI,Bordetella pertussistarget I.
b
CI, confidence interval.
on May 16, 2020 by guest
http://jcm.asm.org/
[image:6.585.48.538.425.684.2]assays but comparison of TLDA and IRTP performance. We
selected four replicates based on available resources. For the
same reason, we did not exceed seven 10-fold serial dilutions in
comparative LOD determinations; however, more frequent
di-lutions would have decreased the discrepancy between TLDA
and IRTP LODs.
We evaluated TLDA performance on clinical specimens at
C
Tcutoffs of 35 and 43 for both the TLDA and IRTP assays.
These cutoffs were chosen to evaluate TLDA performance
under both conservative and liberal definitions of positive
re-sults and to allow for various specimen concentrations in
dif-ferent samples, such as would occur in a real-world scenario.
Under both liberal and conservative conditions, the overall
specificity of the TLDA compared to the IRTP was unchanged,
while the sensitivity was 4% lower at the
C
Tcutoff of 43. This
decrease in sensitivity seen with the TLDA at higher
C
Tlevels
is consistent with the more sensitive LODs of IRTP assays
found in the analytical validation. Concordance with TLDA
results improved with a
C
Tcutoff of 35, because specimens that
were considered positive with IRTP values between 35 and
43 were recategorized as negative. The TLDA card
consis-tently showed the lowest sensitivity for two pathogens,
M.
pneumoniae
and
C. pneumoniae
, possibly due to sample quality
and the prior dilution status of the clinical specimens available
for these specific pathogens, indicated by high
C
Tvalues for IRTP
assays (
ⱖ
35). The sensitivity of the TLDA for these pathogens
increased by 33% when the
C
Tcutoff was lowered to 35.
In total, less than 3% (56/2,238) of assays performed by both
the TLDA and IRTP gave false-negative results at a
C
Tcutoff
of 43. In a normal outbreak or surveillance setting, clinical
specimens would be eluted in a 120-
l or smaller volume;
however, in order to perform 48 IRTPs in addition to the
TLDA, the samples were eluted in 260
l for this study. This
specimen dilution step may have led to the TLDA missing
some clinical specimens that would otherwise have tested
pos-itive, which could potentially explain some of the false-negative
results on TLDA cards. In this study, we were unable to
per-form IRTP testing on many specimens for which TLDA results
were negative for a given pathogen. The decision to test only a
subset of negative results was based on available resources,
since complete testing of all specimens would have required
performing approximately 7,000 additional IRTP assays. We
believe this limitation introduced a minor bias against the
IRTP assays.
False-positive TLDA results were seen in less than 1.6%
(35/2,238) of TLDA assay reactions at a
C
Tcutoff of 43. One
explanation for this may be that each 25-
l IRTP mixture
contained the nucleic acid equivalent of 7.5
l of the original
clinical specimen, while each 1-
l TLDA reaction mixture
con-tained only a 0.2-
l nucleic acid equivalent of the original
clinical specimen. Forty-five cycles at 94°C may have caused
this small reaction volume to evaporate over time, potentially
modifying PCR chemistry enough to prevent proper
amplifi-cation and to introduce nonspecific amplicons.
Another factor that may have impacted the sensitivity and
specificity of the TLDA was the need to use a single extraction
method, real-time PCR chemistry, and cycling conditions for
all reactions. Some pathogens might be detected better using
assays optimized under individualized conditions, but we used
a method likely to give the best overall results for this
combi-nation of RNA and DNA targets. The IRTPs used in this study
were run under this unified set of conditions. However, the
ability to use the same chemistry for the identification of
both viruses and bacteria makes our respiratory-pathogen
card possible.
Despite these limitations, our results show that the
sensitiv-ity and specificsensitiv-ity of the TLDA card are close to those of IRTP
assays. These findings suggest that the TLDA card would be a
useful tool for pathogen detection, particularly in surveillance
and outbreak settings, where results can be interpreted in a
broader context than with individual clinical care. As with any
multiple-pathogen detection tool, special consideration must
be given to situations in which more than one pathogen has a
positive result, and clinical judgment is important for
distin-guishing between carriage and disease. More experience with
the assay is essential to determine if the level of detection is
appropriate for clinical care. The TLDA card is an efficient
tool for rapid screening of many respiratory pathogens when
the etiology of respiratory disease is not known or multiple
pathogens are suspected, which gives it an advantage over most
currently used diagnostics. Further evaluation of the TLDA
is needed to assess its performance in a clinical context,
including distinguishing between carriage and disease and
determining whether the level of detection is appropriate for
clinical care. Multiple pathogens were frequently detected
us-ing TLDA technology. It is not clear whether all these multiple
pathogens were responsible for the patients’ illnesses. It is
likely that carriage is responsible for the presence of some
multiple pathogens. For example,
S. pneumonia
e carriage is
commonly detected in nasopharyngeal swabs and may be
pres-ent in as many as 50% of some populations (6). One of the
challenges of utilizing the TLDA technology will be to develop
algorithms to determine which pathogens are primarily
respon-sible for disease, which pathogens can work synergistically to
produce disease, and which pathogens represent carriage.
TLDA cards could have useful applications to various
syn-dromes beyond respiratory infections, such as diarrhea, sepsis,
and meningitis/encephalitis, where a variety of pathogens
could be causing similar symptoms.
ACKNOWLEDGMENT
The findings and the conclusions in this report are those of the
authors and do not necessarily represent the official position of the
Centers for Disease Control and Prevention.
REFERENCES
1.Briese, T., et al.2005. Diagnostic system for rapid and sensitive differential detection of pathogens. Emerg. Infect. Dis.11:310–313.
2.Carvalho, M. D. G. S., et al.2007. Evaluation and improvement of real-time PCR assays targetinglytA,ply, andpsaAgenes for detection of pneumococcal DNA. J. Clin. Microbiol.45:2460–2466.
3.Dominguez, S. R., et al.2008. Multiplex MassTag-PCR for respiratory patho-gens in pediatric nasopharyngeal washes negative by conventional diagnostic testing shows a high prevalence of viruses belonging to a newly recognized rhinovirus clade. J. Clin. Virol.43:219–222.
4.Fry, A. M., et al.2010. The burden of hospitalized lower respiratory tract infection due to respiratory syncytial virus in rural Thailand. PLoS One
5:e15098.
5.Hamano-Hasegawa, K., et al.2008. Comprehensive detection of causative pathogens using real-time PCR to diagnose pediatric community-acquired pneumonia. J. Infect. Chemother.14:424–432.
6.Hammitt, L. L., et al.2006. Indirect effect of conjugate vaccine on adult carriage ofStreptococcus pneumoniae: an explanation of trends in invasive pneumococcal disease. J. Infect. Dis.193:1487–1494.
7.Heim, A., C. Ebnet, G. Harste, and P. Pring-Akerblom.2003. Rapid and
on May 16, 2020 by guest
http://jcm.asm.org/
quantitative detection of human adenovirus DNA by real-time PCR. J. Med. Virol.70:228–239.
8.Hui, A. B., et al.2009. Robust global micro-RNA profiling with formalin-fixed paraffin-embedded breast cancer tissues. Lab. Invest.89:597–606. 9.Jacoby, P., et al.2007. Modelling the co-occurrence ofStreptococcus
pneu-moniaewith other bacterial and viral pathogens in the upper respiratory tract. Vaccine25:2458–2464.
10.Johansson, N., M. Kalin, A. Tiveljung-Lindell, C. G. Giske, and J. Hedlund.
2010. Etiology of community-acquired pneumonia: increased microbiologi-cal yield with new diagnostic methods. Clin. Infect. Dis.50:202–209. 11.Johnstone, J., S. R. Majumdar, J. D. Fox, and T. J. Marrie.2008. Viral
infection in adults hospitalized with community-acquired pneumonia: prev-alence, pathogens, and presentation. Chest134:1141–1148.
12.Kilpatrick, D. R., et al.2009. Rapid group-, serotype-, and vaccine strain-specific identification of poliovirus isolates by real-time reverse transcription-PCR using degenerate primers and probes containing deoxyinosine residues. J. Clin. Microbiol.47:1939–1941.
13.Kleemola, M., et al.2006. Is there any specific association between respira-tory viruses and bacteria in acute otitis media of young children? J. Infect.
52:181–187.
14.Lu, X., et al.2008. Real-time reverse transcription-PCR assay for compre-hensive detection of human rhinoviruses. J. Clin. Microbiol.46:533–539. 15.Mitchell, S. L., S. Budhiraja, K. A. Thurman, W. Lanier Thacker, and J. M.
Winchell.2009. Evaluation of two real-time PCR chemistries for the detec-tion ofChlamydophila pneumoniaein clinical specimens. Mol. Cell. Probes
23:309–311.
16.Nix, W. A., et al.2008. Detection of all known parechoviruses by real-time PCR. J. Clin. Microbiol.46:2519–2524.
17.Oosterheert, J. J., et al.2005. Impact of rapid detection of viral and atypical bacterial pathogens by real-time polymerase chain reaction for patients with lower respiratory tract infection. Clin. Infect. Dis.41:1438–1444. 18.Pabbaraju, K., K. L. Tokaryk, S. Wong, and J. D. Fox.2008. Comparison of
the Luminex xTAG respiratory viral panel with in-house nucleic acid
ampli-fication tests for diagnosis of respiratory virus infections. J. Clin. Microbiol.
46:3056–3062.
19.Reijans, M., et al.2008. RespiFinder: a new multiparameter test to differ-entially identify fifteen respiratory viruses. J. Clin. Microbiol.46:1232–1240. 20.Reimer, L. G., and K. C. Carroll.1998. Role of the microbiology laboratory in the diagnosis of lower respiratory tract infections. Clin. Infect. Dis.26:
742–748.
21.Sa´nchez-Espiridio´n, B., et al.2009. A TaqMan low-density array to predict outcome in advanced Hodgkin’s lymphoma using paraffin-embedded sam-ples. Clin. Cancer Res.15:1367–1375.
22.Steg, A., et al.2006. Multiple gene expression analyses in paraffin-embedded tissues by TaqMan low-density array: application to hedgehog and Wnt pathway analysis in ovarian endometrioid adenocarcinoma. J. Mol. Diagn.
8:76–83.
23.Tatti, K. M., et al.2008. Development and evaluation of dual-target real-time polymerase chain reaction assays to detectBordetellaspp. Diagn. Mi-crobiol. Infect. Dis.61:264–272.
24.Wang, X., et al.2011. Detection of bacterial pathogens in Mongolia menin-gitis surveillance with a new real-time PCR assay to detectHaemophilus influenzae. Int. J. Med. Microbiol.301:303–309.
25.Winchell, J. M., K. A. Thurman, S. L. Mitchell, W. L. Thacker, and B. S. Fields. 2008. Evaluation of three real-time PCR assays for detection of Mycoplasma pneumoniaein an outbreak investigation. J. Clin. Microbiol.
46:3116–3118.
26.Yang, G., et al.2010. Dual detection ofLegionella pneumophilaand Legion-ellaspecies by real-time PCR targeting the 23S–5S rRNA gene spacer region. Clin. Microbiol. Infect.16:255–261.
27.Yang, G., et al.2011. Comparison of commercial systems for extraction of nucleic acids from DNA/RNA respiratory pathogens. J. Virol. Methods
171:195–199.
28.Yang, G. P., D. D. Erdman, M. L. Tondella, and B. S. Fields.2009. Evalu-ation of tetramethylrhodamine and black hole quencher 1 labeled probes and five commercial amplification mixes in TaqMan real-time RT-PCR assays for respiratory pathogens. J. Virol. Methods162:288–290.