Munich Personal RePEc Archive
The currency union effect on trade is
decreasing over time
De Sousa, Jose
Department of Economics, University of Paris Sud
November 2011
Online at
https://mpra.ub.uni-muenchen.de/40327/
The currency union effect on trade is
decreasing over time
∗
Jos´e de Sousa
†July 2012
Forthcoming in
Ecomonics Letters
Abstract
Estimating a theoretical gravity model over a sixty-year period, from 1948 to 2009,
I found an unexpected trend: the currency union impact on trade is decreasing over
time. This result suggests that with trade and financial globalization currency unions
become less and less important for promoting trade.
Keywords: Currency Unions; Dollarization; Trade; Gravity; Poisson.
JEL classification codes: F15, F33.
1
Introduction
Rose (2000) documented a striking result: two countries that share a currency trade three
times as much as they would with different currencies, ceteris paribus. By web-posting his
In this paper, I document an unexpected trend: the CU impact on trade is decreasing
over time. In contrast, the literature finds that the size of the CU effect is stable (Rose,
2000, Table 1) or increasing over time (Glick and Rose, 2002, Table 3).
Why is the CU effect decreasing over time? It could be that with trade and financial
globalization CUs become less and less important for promoting trade. If this economic
argu-ment is valid, then the downward trend should be relatively insensitive to the different kinds
of CUs. Using the data and specification of Rose (2000), Levy-Yeyati (2003) documented
differential effects on trade between multilateral and unilateral CUs. However, I find a
down-ward trend for both currency arrangements, i.e., when countries negotiate multilaterally to
set up a CU and when they adopt unilaterally the currency of an anchor.
The documented downward CU effect is based on a theoretically consistent estimation
of the gravity equation: year by year, from 1948 to 2009, in its multiplicative form by the
poisson pseudo-maximum likelihood (PPML) estimator with importer and exporter fixed
effects. This estimator addresses two typical problems in estimating gravity equations with
the OLS: sample selection and inconsistency (Santos Silva and Tenreyro, 2006). The sample
selection results from the conventional logarithmic transformation of the dependent variable
that converts the zeros of the non-trading pairs to missing. The OLS inconsistency comes
from the fact that the expected value of the log-linearized error will depend on covariates.
This inconsistency is a first-order issue. I find that the OLS estimates of the CU are quite
stable while the PPML estimates are decreasing over time, with or without incorporation of
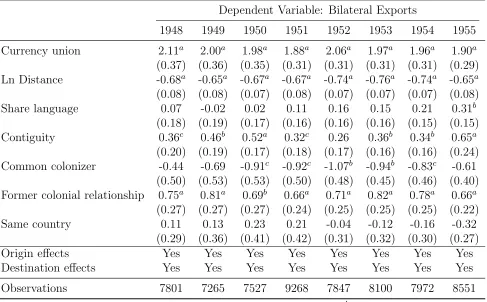
the zeros. Thus, in 1948, two countries that share a currency trade eight times as much as
they would with different currencies, ceteris paribus, while in 2009 CUs are found to have
no positive effect on trade.
The rest of the paper is organized as follows. In the next section, I briefly describe the
specification and data. In section (3), I present the results. The last section concludes.
2
Specification and Data
(2003) derive a theoretical gravity equation:
Xij = (YiEj/Yw)(τij/PiPj)1−σ
, (1)
whereXij is the nominal value of exports from countryito countryj,Yi is the total sales by
origini,Ej is the total expenditure of destinationj,Yw is the nominal value of world output,
σ is the elasticity of substitution between the countries’ goods, τij ≥ 1 is the iceberg-type
trade costs (i.e., the units of the product that must be shipped to j for one unit to arrive)
andPi is i’s multilateral trade resistance (i.e., a price index that depends positively on trade
barriers between i and all of its trading partners). From Eq. (1), two steps are necessary to
get an estimable equation.
The functional form for trade costs (τij) has first to be specified. We follow, as a
bench-mark, Rose and van Wincoop (2001), who used Eq. (1) to estimate the CU effect on trade,
and assume that τij is a stochastic log-linear function of observables
lnτij =ρln distij +zijβ+γCUij +uij, (2)
where uis a random error, CU is the common Currency Union dummy, distis the bilateral
distance, a typical proxy for transportation costs, and zij is a vector whose elements are dummies indicating whether two countries share a land border, share a language, share a
Free Trade Agreement (FTA), have had a common colonizer after 1945, are currently in a
colonial relationship, or were/are the same state for a long period.
The second step is to model the monadic i (Yi, Pi) and j (Ej, Pj) terms in Eq. (1). I
use the simplest solution that consists to replace monadic terms by exporter and importer
the log model (3) drops zero values of trade and can cause severe inconsistency. In contrast,
I use the PPML technique and estimate consistently
Xij = exp(αi+αj+δln distij +zij(1−σ)β+λCUij)ǫij, (4)
where ǫij = exp((1−σ)uij).1
2.2. Data Following the advice of Rose (2001) that “a larger data set is unambiguously more informative than a smaller one”, I extend the Glick and Rose (2002) sample, on the
basis of the same source of trade data, i.e., the International Monetary Fund’s Direction
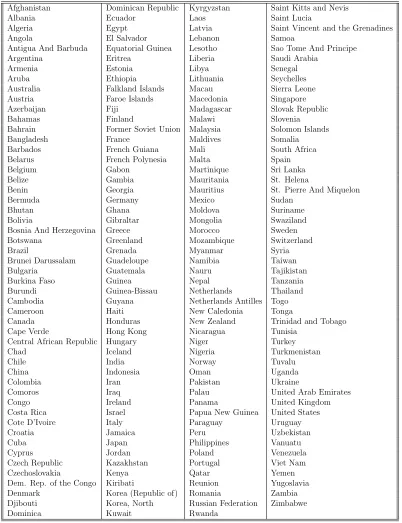
of Trade Statistics. The sample covers 203 countries and the period 1948-2009, which is of
crucial importance since this includes the euro creation in 1999. Table (1) in appendix A
lists the countries in the sample. Bilateral distance and various dummies contained in zij
come from the CEPII distance database,2
except the Free Trade Agreement and Currency
Union dummies.3
3
Results
To get theoretically consistent parameter estimates, I run Eq. (3) and (4) year by year, from
1948 to 2009, with directional country fixed effects.4
Standard errors are clustered at the
1
My interest is in the direct effect of the CU dummy,λ, as in Rose and van Wincoop (2001). I abstract
from the indirect effect that may be computed through the multilateral trade resistances.
2
Available athttp://www.cepii.fr/anglaisgraph/bdd/distances.htm.
3
Programs for constructing these two dummies are available athttp://jdesousa.univ.free.fr/data. htm. The data on CU are based on the list provided by Glick and Rose (2002), to which I added the Euro currency union.
4
country-pair level. I consider that the pair of countriesij is in the same cluster asjibecause
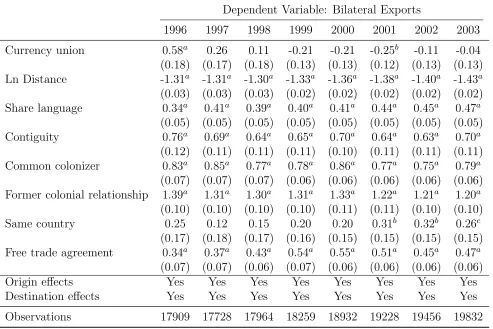
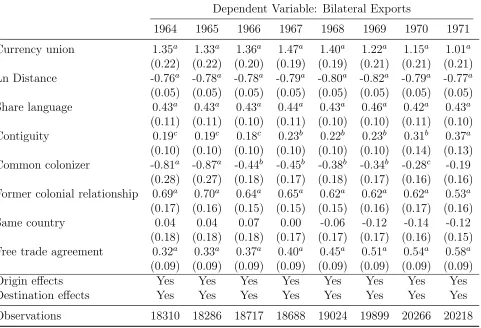
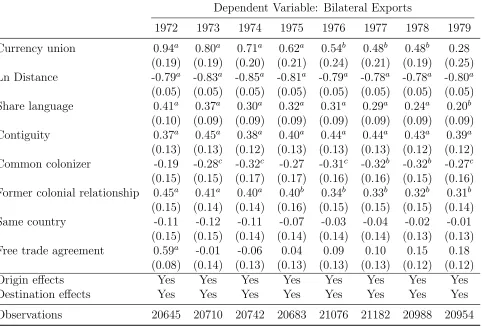
a common shock may affect both directions of trade. To save, I plot in Figure (1) the annual
estimates of the CU dummy and the clustered 95% confidence interval around the point
estimate. The overall PPML and OLS estimation results are reported in Tables (2) to (17)
(in Appendices B and C).
−1
0
1
2
3
1948 1953 1958 1963 1968 1973 1978 1983 1988 1993 1998 2003 2008 year
Currency union effect 95% CI
OLS estimates
−1
0
1
2
3
1948 1953 1958 1963 1968 1973 1978 1983 1988 1993 1998 2003 2008 year
Currency union effect 95% CI
Poisson−PML estimates
Figure 1: OLS (left) and Poisson-PML (right) currency union effects – 1948-2009
Figure (1) depicts interesting differences. In the left panel, the OLS CU effect is quite
stable until 1992, despite a temporary drop at the end of the seventies. As an illustration of
this stability, given the sampling error, the CU effect in 1948 is not statistically different from
the one in 1992, that is forty-four years later. In 1948, two countries that share a currency
trade 187% [= (exp(1.05)−1)×100] as much as they would with different currencies, against
135% [= (exp(0.85) −1)×100] in 1992. After 1992, the OLS CU effect decreases and is
equal to zero from 1998 onwards.
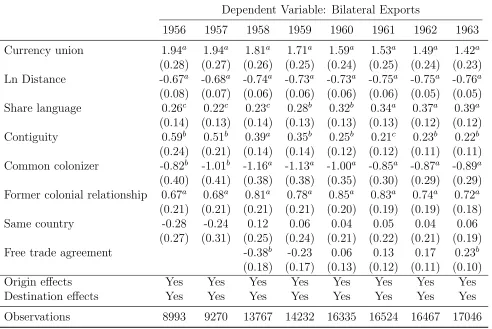
The OLS results somewhat contrast with the PPML results shown in the right panel
There is one interesting similarity between OLS and PPML estimates: from 1999 onwards
the average CU effect is not statistically different from zero. However, the interpretation
of this similarity differs. The OLS pre-euro effect tends to be larger, which suggests a
comparatively smaller effect of the euro on trade. In contrast, the PPML pre-euro effect
tends to be lower. This suggests a comparatively bigger effect of the euro on trade.
The contrasting results of Figure (1) imply that the choice of the estimator matters.
The PPML can address both inconsistency of the OLS and sample selection. The latter
results from the logarithmic transformation converting the zeros of the non-trading pairs to
missing. On average, depending on the year, this transformation leaves out about 50% of
the observations. Dropping these observations can cause additional biases in the estimation.
This can be “particularly problematic when one considers small or poor countries (such as
the ones that have been clients in or part of multilateral currency unions in Rose’s data)”
(Santos Silva and Tenreyro, 2010, p. 57). However, the PPML estimates are remarkably
similar using the whole sample or the positive-trade subsample. 5
Thus, the inconsistency of
the OLS, addressed with the PPML, appears to explain the contrasting results of Figure (1).
Interestingly, the distance puzzle, that the volume of trade has become increasingly
sen-sitive to distance, is an empirical regularity that also depends crucially on the choice of the
estimator. The role of geographical distance as a trade deterrent is significantly lower under
PPML (Santos Silva and Tenreyro, 2006). My annual regressions confirm this finding [see
Tables (10) to (17) in Appendix C]. Figure (2) depicts the increase in the absolute value of
the OLS distance elasticity over time, documented in Disdier and Head (2008). With PPML
the puzzling increase of the distance elasticity vanishes.6
Why does sharing a currency have smaller effects on trade over time? It could be that
with trade and financial globalization, the CUs become less and less important for
promot-ing trade. As pointed out above, if this is a valid economic argument, then the downward
trend should be relatively insensitive to the different kinds of CUs. Using the Rose (2000)
5
See Tables (18) to (25) (in Appendix D) report the estimation results on the positive-trade subsample. Figure (4) replicates the right panel of Figure (1) using the positive-trade subsample. It is worth noting that the PPML estimator performs very well even when the proportion of zeros is very large (see Santos Silva and Tenreyro, 2011).
6
.6
.8
1
1.2
1.4
1.6
Absolute value of distance elasticity
1948 1953 1958 1963 1968 1973 1978 1983 1988 1993 1998 2003 2008 year
Poisson−PML OLS
Figure 2: Absolute value of the distance elasticity for trade – 1948-2009
data and specification, Levy-Yeyati (2003) documented differential effects on trade between
multilateral and unilateral currency unions. The latter are hub and spokes currency
arrange-ments (Baldwin, 2006), i.e., some countries (the spokes) unilaterally adopt the currency of
a larger country (the hub) as legal tender. They represent two kinds of bilateral trade flows:
between the hub and a spoke and between the spokes. To check whether the downward CU
effect is driven by the differences in currency arrangements, I separate the CU dummy in
Eq. (4) into two parts: (1) a multilateral CU dummy and (2) a unilateral CU dummy. They
each represent about 1% of the observations. Figure (3) plots the annual PPLM estimates
of both dummies.7
The evolution of both effects mirrors the evolution of the average CU
effect (right panel of Figure 1): i.e., a downward trend over time. There are some apparent
differences: (1) between the mid-80’s and mid-90’s, the multilateral CU effect is zero (before
−1
0
1
2
3
1948 1953 1958 1963 1968 1973 1978 1983 1988 1993 1998 2003 2008 year
Multilateral Currency Unions Unilateral Currency Unions
Figure 3: Poisson-PML multilateral and unilateral currency union effects – 1948-2009
4
Conclusion
Estimating a theoretical gravity model over a sixty-year period, I found an unexpected trend:
the CU impact on trade is decreasing over time. This effect is found to be economically and
statistically large until the seventies, then negative and finally insignificant at the beginning
of the 21st century. This result holds when separating unilateral from multilateral currency
unions. It could be that with trade and financial globalization the currency unions appear
to become less and less important for promoting trade.
References
[1] Anderson, J. and E. van Wincoop (2003), “Gravity with Gravitas: A Solution to the Border Puzzle,” American Economic Review 93(1): 170-192.
[2] Anderson, J. and E. van Wincoop (2004), “Trade Costs”, Journal of Economic Litera-ture, 42(3): 691-751.
[3] Baier, S. and J.H. Bergstrand (2007), “Do free trade agreements actually increase mem-bers’ international trade?,” Journal of International Economics, 71(1): 72-95.
[6] Dias, D. (2011), “Gravity and Globalization,” mimeo.
[7] Disdier, A.C. and K. Head (2008), “The Puzzling Persistence of the Distance Effect on Bilateral Trade,” Review of Economics and Statistics 90(1): 37-48.
[8] Glick, R. and A. Rose (2002), “Does a Currency Union affect Trade? The Time Series Evidence,” European Economic Review 46: 1125-1151.
[9] Levy Yeyati, E., (2003), “On the Impact of Common Currency on Bilateral Trade,” Economics Letters 79: 125-129.
[10] Rose, A (2000), “One Money, One Market: Estimating the Effect of Common Currencies on Trade,” Economic Policy 30: 9-45.
[11] Rose, A (2001), “Currency Unions and Trade: the Effect is Large,” Economic Policy 33: 441-469.
[12] Rose, A and E. van Wincoop (2001), “National Money as a Barrier to International Trade: The Real Case for Currency Union,” American Economic Review 91(2): 386-390.
[13] Santos Silva, J.M.C. and S. Tenreyro (2006), “The Log of Gravity.”Review of Economics and Statistics 88(4): 641-658.
[14] Santos Silva, J.M.C. and S. Tenreyro (2010), “Currency Unions in Prospect and Retro-spect,” Annual Review of Economics 2: 51-74.
[15] Santos Silva, J.M.C. and S. Tenreyro (2011), “Further Simulation Evidence on the Per-formance of the Poisson Pseudo-Maximum Likelihood Estimator,” Economics Letters 112(2): 220-222.
Appendices
[image:11.612.106.508.170.693.2]A. List of countries in our sample
Table 1: List of countries
Afghanistan Dominican Republic Kyrgyzstan Saint Kitts and Nevis
Albania Ecuador Laos Saint Lucia
Algeria Egypt Latvia Saint Vincent and the Grenadines
Angola El Salvador Lebanon Samoa
Antigua And Barbuda Equatorial Guinea Lesotho Sao Tome And Principe
Argentina Eritrea Liberia Saudi Arabia
Armenia Estonia Libya Senegal
Aruba Ethiopia Lithuania Seychelles
Australia Falkland Islands Macau Sierra Leone
Austria Faroe Islands Macedonia Singapore
Azerbaijan Fiji Madagascar Slovak Republic
Bahamas Finland Malawi Slovenia
Bahrain Former Soviet Union Malaysia Solomon Islands
Bangladesh France Maldives Somalia
Barbados French Guiana Mali South Africa
Belarus French Polynesia Malta Spain
Belgium Gabon Martinique Sri Lanka
Belize Gambia Mauritania St. Helena
Benin Georgia Mauritius St. Pierre And Miquelon
Bermuda Germany Mexico Sudan
Bhutan Ghana Moldova Suriname
Bolivia Gibraltar Mongolia Swaziland
Bosnia And Herzegovina Greece Morocco Sweden
Botswana Greenland Mozambique Switzerland
Brazil Grenada Myanmar Syria
Brunei Darussalam Guadeloupe Namibia Taiwan
Bulgaria Guatemala Nauru Tajikistan
Burkina Faso Guinea Nepal Tanzania
Burundi Guinea-Bissau Netherlands Thailand Cambodia Guyana Netherlands Antilles Togo
Cameroon Haiti New Caledonia Tonga
Canada Honduras New Zealand Trinidad and Tobago
Cape Verde Hong Kong Nicaragua Tunisia
Central African Republic Hungary Niger Turkey
Chad Iceland Nigeria Turkmenistan
Chile India Norway Tuvalu
China Indonesia Oman Uganda
Colombia Iran Pakistan Ukraine
Comoros Iraq Palau United Arab Emirates
Congo Ireland Panama United Kingdom
Costa Rica Israel Papua New Guinea United States
Cote D’Ivoire Italy Paraguay Uruguay
Croatia Jamaica Peru Uzbekistan
Cuba Japan Philippines Vanuatu
Cyprus Jordan Poland Venezuela
Czech Republic Kazakhstan Portugal Viet Nam
Czechoslovakia Kenya Qatar Yemen
Dem. Rep. of the Congo Kiribati Reunion Yugoslavia Denmark Korea (Republic of) Romania Zambia Djibouti Korea, North Russian Federation Zimbabwe
B. OLS currency union effects – 1948-2009
Results used to construct the left panel of Figure (1)
Table 2: OLS currency union effects – 1948-1955
Dependent Variable: Bilateral Exports
1948 1949 1950 1951 1952 1953 1954 1955
Currency union 1.06a 0.99a 0.88a 0.87a 0.86a 0.87a 1.08a 0.97a (0.16) (0.17) (0.16) (0.17) (0.17) (0.17) (0.18) (0.16) Ln Distance -0.85a -0.80a -0.75a -0.72a -0.77a -0.74a -0.70a -0.69a (0.04) (0.04) (0.04) (0.04) (0.04) (0.04) (0.04) (0.04) Share language 0.16c -0.01 0.09 0.02 0.07 0.18b 0.11 0.14c
(0.09) (0.09) (0.08) (0.08) (0.08) (0.08) (0.09) (0.08) Contiguity 0.38a 0.18 0.34b 0.30b 0.19 0.28c 0.17 0.30c
(0.15) (0.14) (0.14) (0.14) (0.16) (0.16) (0.15) (0.16) Common colonizer 0.83a 1.02a 0.58a 0.84a 0.69a 0.76a 0.77a 0.97a
(0.18) (0.18) (0.19) (0.19) (0.17) (0.17) (0.17) (0.16) Former colonial relationship 1.24a 1.35a 1.37a 1.28a 1.33a 1.21a 1.10a 1.20a
(0.17) (0.17) (0.16) (0.16) (0.16) (0.17) (0.16) (0.16) Same country 0.11 -0.05 -0.06 -0.01 0.15 -0.10 0.11 0.02
(0.24) (0.27) (0.30) (0.32) (0.30) (0.27) (0.27) (0.24) Origin effects Yes Yes Yes Yes Yes Yes Yes Yes Destination effects Yes Yes Yes Yes Yes Yes Yes Yes
Observations 3238 3024 3214 3339 3761 3829 3777 4018
Note: Robust standard errors clustered by country-pair in parentheses witha
,b
andc
Table 3: OLS currency union effects – 1956-1963
Dependent Variable: Bilateral Exports
1956 1957 1958 1959 1960 1961 1962 1963
Currency union 0.78a 0.70a 0.60a 0.60a 0.39a 0.67a 0.57a 0.60a (0.16) (0.17) (0.14) (0.14) (0.14) (0.13) (0.13) (0.13) Ln Distance -0.71a -0.70a -0.72a -0.74a -0.73a -0.71a -0.78a -0.81a (0.04) (0.04) (0.03) (0.03) (0.03) (0.03) (0.03) (0.03) Share language 0.16b 0.18b 0.14c 0.18b 0.18a 0.22a 0.18a 0.17a
(0.08) (0.08) (0.07) (0.07) (0.07) (0.07) (0.06) (0.06) Contiguity 0.42a 0.40a 0.42a 0.36a 0.15 0.27b 0.18 0.07
(0.15) (0.14) (0.13) (0.13) (0.12) (0.12) (0.12) (0.12) Common colonizer 0.82a 0.78a 0.86a 0.73a 0.94a 0.86a 0.82a 0.85a
(0.15) (0.16) (0.12) (0.14) (0.11) (0.11) (0.11) (0.10) Former colonial relationship 1.11a 1.16a 1.35a 1.20a 1.41a 1.34a 1.32a 1.34a
(0.15) (0.16) (0.14) (0.13) (0.13) (0.12) (0.13) (0.12) Same country -0.10 -0.30 -0.21 -0.15 -0.03 0.02 0.03 0.00
(0.23) (0.25) (0.22) (0.20) (0.18) (0.18) (0.17) (0.17) Free trade agreement -0.75a -0.58a 0.12 0.25c 0.25c 0.34a
(0.15) (0.14) (0.13) (0.13) (0.13) (0.12) Origin effects Yes Yes Yes Yes Yes Yes Yes Yes Destination effects Yes Yes Yes Yes Yes Yes Yes Yes
Observations 4187 4173 4622 4566 4992 4989 5188 5574
Note: Robust standard errors clustered by country-pair in parentheses witha
,b
andc
Table 4: OLS currency union effects – 1964-1971
Dependent Variable: Bilateral Exports
1964 1965 1966 1967 1968 1969 1970 1971
Currency union 0.43a 0.50a 0.49a 0.88a 0.99a 1.01a 1.13a 1.02a (0.11) (0.12) (0.11) (0.14) (0.13) (0.17) (0.16) (0.18) Ln Distance -0.79a -0.81a -0.82a -0.86a -0.88a -0.89a -0.91a -0.94a (0.03) (0.03) (0.03) (0.03) (0.03) (0.03) (0.03) (0.03) Share language 0.25a 0.26a 0.22a 0.24a 0.27a 0.37a 0.36a 0.38a
(0.06) (0.06) (0.06) (0.06) (0.06) (0.06) (0.06) (0.06) Contiguity 0.15 0.10 0.02 -0.05 -0.03 0.01 0.07 0.16
(0.11) (0.11) (0.11) (0.11) (0.11) (0.12) (0.13) (0.12) Common colonizer 0.68a 0.65a 0.63a 0.52a 0.53a 0.48a 0.42a 0.45a
(0.10) (0.09) (0.09) (0.09) (0.09) (0.09) (0.09) (0.09) Former colonial relationship 1.30a 1.27a 1.38a 1.39a 1.33a 1.37a 1.43a 1.41a
(0.11) (0.11) (0.11) (0.11) (0.11) (0.11) (0.11) (0.11) Same country 0.13 0.32c 0.44b 0.56a 0.25 0.79a 0.77a 0.81a
(0.17) (0.17) (0.19) (0.20) (0.17) (0.18) (0.20) (0.20) Free trade agreement 0.47a 0.46a 0.54a 0.55a 0.60a 0.63a 0.60a 0.56a
(0.11) (0.12) (0.13) (0.13) (0.12) (0.15) (0.16) (0.16) Origin effects Yes Yes Yes Yes Yes Yes Yes Yes Destination effects Yes Yes Yes Yes Yes Yes Yes Yes
Observations 6172 6496 6879 6941 6891 7949 8340 8684
Note: Robust standard errors clustered by country-pair in parentheses witha
,b
andc
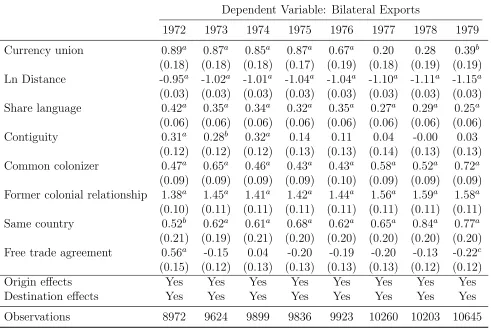
Table 5: OLS currency union effects – 1972-1979
Dependent Variable: Bilateral Exports
1972 1973 1974 1975 1976 1977 1978 1979
Currency union 0.89a 0.87a 0.85a 0.87a 0.67a 0.20 0.28 0.39b (0.18) (0.18) (0.18) (0.17) (0.19) (0.18) (0.19) (0.19) Ln Distance -0.95a -1.02a -1.01a -1.04a -1.04a -1.10a -1.11a -1.15a (0.03) (0.03) (0.03) (0.03) (0.03) (0.03) (0.03) (0.03) Share language 0.42a 0.35a 0.34a 0.32a 0.35a 0.27a 0.29a 0.25a
(0.06) (0.06) (0.06) (0.06) (0.06) (0.06) (0.06) (0.06) Contiguity 0.31a 0.28b 0.32a 0.14 0.11 0.04 -0.00 0.03
(0.12) (0.12) (0.12) (0.13) (0.13) (0.14) (0.13) (0.13) Common colonizer 0.47a 0.65a 0.46a 0.43a 0.43a 0.58a 0.52a 0.72a
(0.09) (0.09) (0.09) (0.09) (0.10) (0.09) (0.09) (0.09) Former colonial relationship 1.38a 1.45a 1.41a 1.42a 1.44a 1.56a 1.59a 1.58a
(0.10) (0.11) (0.11) (0.11) (0.11) (0.11) (0.11) (0.11) Same country 0.52b 0.62a 0.61a 0.68a 0.62a 0.65a 0.84a 0.77a
(0.21) (0.19) (0.21) (0.20) (0.20) (0.20) (0.20) (0.20) Free trade agreement 0.56a -0.15 0.04 -0.20 -0.19 -0.20 -0.13 -0.22c (0.15) (0.12) (0.13) (0.13) (0.13) (0.13) (0.12) (0.12) Origin effects Yes Yes Yes Yes Yes Yes Yes Yes Destination effects Yes Yes Yes Yes Yes Yes Yes Yes
Observations 8972 9624 9899 9836 9923 10260 10203 10645
Note: Robust standard errors clustered by country-pair in parentheses witha
,b
andc
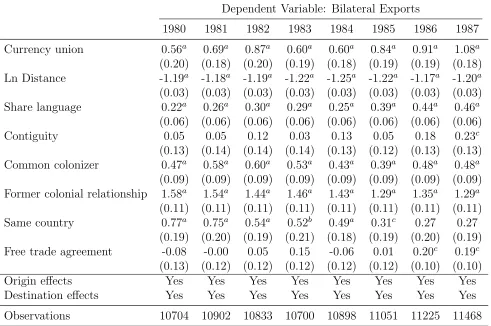
Table 6: OLS currency union effects – 1980-1987
Dependent Variable: Bilateral Exports
1980 1981 1982 1983 1984 1985 1986 1987
Currency union 0.56a 0.69a 0.87a 0.60a 0.60a 0.84a 0.91a 1.08a (0.20) (0.18) (0.20) (0.19) (0.18) (0.19) (0.19) (0.18) Ln Distance -1.19a -1.18a -1.19a -1.22a -1.25a -1.22a -1.17a -1.20a (0.03) (0.03) (0.03) (0.03) (0.03) (0.03) (0.03) (0.03) Share language 0.22a 0.26a 0.30a 0.29a 0.25a 0.39a 0.44a 0.46a
(0.06) (0.06) (0.06) (0.06) (0.06) (0.06) (0.06) (0.06) Contiguity 0.05 0.05 0.12 0.03 0.13 0.05 0.18 0.23c
(0.13) (0.14) (0.14) (0.14) (0.13) (0.12) (0.13) (0.13) Common colonizer 0.47a 0.58a 0.60a 0.53a 0.43a 0.39a 0.48a 0.48a
(0.09) (0.09) (0.09) (0.09) (0.09) (0.09) (0.09) (0.09) Former colonial relationship 1.58a 1.54a 1.44a 1.46a 1.43a 1.29a 1.35a 1.29a
(0.11) (0.11) (0.11) (0.11) (0.11) (0.11) (0.11) (0.11) Same country 0.77a 0.75a 0.54a 0.52b 0.49a 0.31c 0.27 0.27
(0.19) (0.20) (0.19) (0.21) (0.18) (0.19) (0.20) (0.19) Free trade agreement -0.08 -0.00 0.05 0.15 -0.06 0.01 0.20c 0.19c
(0.13) (0.12) (0.12) (0.12) (0.12) (0.12) (0.10) (0.10) Origin effects Yes Yes Yes Yes Yes Yes Yes Yes Destination effects Yes Yes Yes Yes Yes Yes Yes Yes
Observations 10704 10902 10833 10700 10898 11051 11225 11468
Note: Robust standard errors clustered by country-pair in parentheses witha
,b
andc
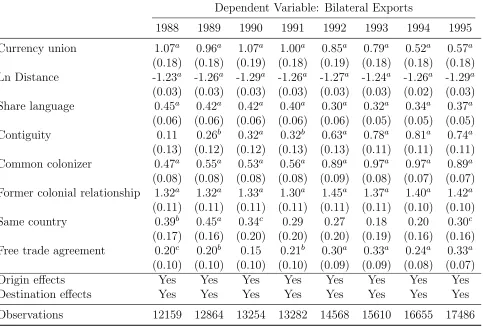
Table 7: OLS currency union effects – 1988-1995
Dependent Variable: Bilateral Exports
1988 1989 1990 1991 1992 1993 1994 1995
Currency union 1.07a 0.96a 1.07a 1.00a 0.85a 0.79a 0.52a 0.57a (0.18) (0.18) (0.19) (0.18) (0.19) (0.18) (0.18) (0.18) Ln Distance -1.23a -1.26a -1.29a -1.26a -1.27a -1.24a -1.26a -1.29a (0.03) (0.03) (0.03) (0.03) (0.03) (0.03) (0.02) (0.03) Share language 0.45a 0.42a 0.42a 0.40a 0.30a 0.32a 0.34a 0.37a
(0.06) (0.06) (0.06) (0.06) (0.06) (0.05) (0.05) (0.05) Contiguity 0.11 0.26b 0.32a 0.32b 0.63a 0.78a 0.81a 0.74a
(0.13) (0.12) (0.12) (0.13) (0.13) (0.11) (0.11) (0.11) Common colonizer 0.47a 0.55a 0.53a 0.56a 0.89a 0.97a 0.97a 0.89a
(0.08) (0.08) (0.08) (0.08) (0.09) (0.08) (0.07) (0.07) Former colonial relationship 1.32a 1.32a 1.33a 1.30a 1.45a 1.37a 1.40a 1.42a
(0.11) (0.11) (0.11) (0.11) (0.11) (0.11) (0.10) (0.10) Same country 0.39b 0.45a 0.34c 0.29 0.27 0.18 0.20 0.30c
(0.17) (0.16) (0.20) (0.20) (0.20) (0.19) (0.16) (0.16) Free trade agreement 0.20c 0.20b 0.15 0.21b 0.30a 0.33a 0.24a 0.33a
(0.10) (0.10) (0.10) (0.10) (0.09) (0.09) (0.08) (0.07) Origin effects Yes Yes Yes Yes Yes Yes Yes Yes Destination effects Yes Yes Yes Yes Yes Yes Yes Yes
Observations 12159 12864 13254 13282 14568 15610 16655 17486
Note: Robust standard errors clustered by country-pair in parentheses witha
,b
andc
Table 8: OLS currency union effects – 1996-2003
Dependent Variable: Bilateral Exports
1996 1997 1998 1999 2000 2001 2002 2003
Currency union 0.58a 0.26 0.11 -0.21 -0.21 -0.25b -0.11 -0.04 (0.18) (0.17) (0.18) (0.13) (0.13) (0.12) (0.13) (0.13) Ln Distance -1.31a -1.31a -1.30a -1.33a -1.36a -1.38a -1.40a -1.43a (0.03) (0.03) (0.03) (0.02) (0.02) (0.02) (0.02) (0.02) Share language 0.34a 0.41a 0.39a 0.40a 0.41a 0.44a 0.45a 0.47a
(0.05) (0.05) (0.05) (0.05) (0.05) (0.05) (0.05) (0.05) Contiguity 0.76a 0.69a 0.64a 0.65a 0.70a 0.64a 0.63a 0.70a
(0.12) (0.11) (0.11) (0.11) (0.10) (0.11) (0.11) (0.11) Common colonizer 0.83a 0.85a 0.77a 0.78a 0.86a 0.77a 0.75a 0.79a
(0.07) (0.07) (0.07) (0.06) (0.06) (0.06) (0.06) (0.06) Former colonial relationship 1.39a 1.31a 1.30a 1.31a 1.33a 1.22a 1.21a 1.20a
(0.10) (0.10) (0.10) (0.10) (0.11) (0.11) (0.10) (0.10) Same country 0.25 0.12 0.15 0.20 0.20 0.31b 0.32b 0.26c
(0.17) (0.18) (0.17) (0.16) (0.15) (0.15) (0.15) (0.15) Free trade agreement 0.34a 0.37a 0.43a 0.54a 0.55a 0.51a 0.45a 0.47a
(0.07) (0.07) (0.06) (0.07) (0.06) (0.06) (0.06) (0.06) Origin effects Yes Yes Yes Yes Yes Yes Yes Yes Destination effects Yes Yes Yes Yes Yes Yes Yes Yes
Observations 17909 17728 17964 18259 18932 19228 19456 19832
Note: Robust standard errors clustered by country-pair in parentheses witha
,b
andc
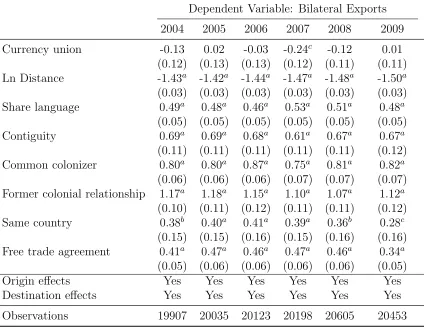
Table 9: OLS currency union effects – 2004-2009
Dependent Variable: Bilateral Exports
2004 2005 2006 2007 2008 2009
Currency union -0.13 0.02 -0.03 -0.24c -0.12 0.01 (0.12) (0.13) (0.13) (0.12) (0.11) (0.11) Ln Distance -1.43a -1.42a -1.44a -1.47a -1.48a -1.50a (0.03) (0.03) (0.03) (0.03) (0.03) (0.03) Share language 0.49a 0.48a 0.46a 0.53a 0.51a 0.48a
(0.05) (0.05) (0.05) (0.05) (0.05) (0.05) Contiguity 0.69a 0.69a 0.68a 0.61a 0.67a 0.67a
(0.11) (0.11) (0.11) (0.11) (0.11) (0.12) Common colonizer 0.80a 0.80a 0.87a 0.75a 0.81a 0.82a
(0.06) (0.06) (0.06) (0.07) (0.07) (0.07) Former colonial relationship 1.17a 1.18a 1.15a 1.10a 1.07a 1.12a
(0.10) (0.11) (0.12) (0.11) (0.11) (0.12) Same country 0.38b 0.40a 0.41a 0.39a 0.36b 0.28c
(0.15) (0.15) (0.16) (0.15) (0.16) (0.16) Free trade agreement 0.41a 0.47a 0.46a 0.47a 0.46a 0.34a
(0.05) (0.06) (0.06) (0.06) (0.06) (0.05) Origin effects Yes Yes Yes Yes Yes Yes Destination effects Yes Yes Yes Yes Yes Yes
Observations 19907 20035 20123 20198 20605 20453
Note: Robust standard errors clustered by country-pair in parentheses witha
,b
andc
C. Poisson-PLM currency union effects – 1948-2009.
Results used to construct the right panel of Figure (1)
Table 10: PPML currency union effects – 1948-1955
Dependent Variable: Bilateral Exports
1948 1949 1950 1951 1952 1953 1954 1955
Currency union 2.11a 2.00a 1.98a 1.88a 2.06a 1.97a 1.96a 1.90a (0.37) (0.36) (0.35) (0.31) (0.31) (0.31) (0.31) (0.29) Ln Distance -0.68a -0.65a -0.67a -0.67a -0.74a -0.76a -0.74a -0.65a (0.08) (0.08) (0.07) (0.08) (0.07) (0.07) (0.07) (0.08) Share language 0.07 -0.02 0.02 0.11 0.16 0.15 0.21 0.31b
(0.18) (0.19) (0.17) (0.16) (0.16) (0.16) (0.15) (0.15) Contiguity 0.36c 0.46b 0.52a 0.32c 0.26 0.36b 0.34b 0.65a
(0.20) (0.19) (0.17) (0.18) (0.17) (0.16) (0.16) (0.24) Common colonizer -0.44 -0.69 -0.91c -0.92c -1.07b -0.94b -0.83c -0.61
(0.50) (0.53) (0.53) (0.50) (0.48) (0.45) (0.46) (0.40) Former colonial relationship 0.75a 0.81a 0.69b 0.66a 0.71a 0.82a 0.78a 0.66a
(0.27) (0.27) (0.27) (0.24) (0.25) (0.25) (0.25) (0.22) Same country 0.11 0.13 0.23 0.21 -0.04 -0.12 -0.16 -0.32
(0.29) (0.36) (0.41) (0.42) (0.31) (0.32) (0.30) (0.27) Origin effects Yes Yes Yes Yes Yes Yes Yes Yes Destination effects Yes Yes Yes Yes Yes Yes Yes Yes
Observations 7801 7265 7527 9268 7847 8100 7972 8551
Note: Robust standard errors clustered by country-pair in parentheses witha
,b
andc
Table 11: PPML currency union effects – 1956-1963
Dependent Variable: Bilateral Exports
1956 1957 1958 1959 1960 1961 1962 1963
Currency union 1.94a 1.94a 1.81a 1.71a 1.59a 1.53a 1.49a 1.42a (0.28) (0.27) (0.26) (0.25) (0.24) (0.25) (0.24) (0.23) Ln Distance -0.67a -0.68a -0.74a -0.73a -0.73a -0.75a -0.75a -0.76a (0.08) (0.07) (0.06) (0.06) (0.06) (0.06) (0.05) (0.05) Share language 0.26c 0.22c 0.23c 0.28b 0.32b 0.34a 0.37a 0.39a
(0.14) (0.13) (0.14) (0.13) (0.13) (0.13) (0.12) (0.12) Contiguity 0.59b 0.51b 0.39a 0.35b 0.25b 0.21c 0.23b 0.22b
(0.24) (0.21) (0.14) (0.14) (0.12) (0.12) (0.11) (0.11) Common colonizer -0.82b -1.01b -1.16a -1.13a -1.00a -0.85a -0.87a -0.89a (0.40) (0.41) (0.38) (0.38) (0.35) (0.30) (0.29) (0.29) Former colonial relationship 0.67a 0.68a 0.81a 0.78a 0.85a 0.83a 0.74a 0.72a
(0.21) (0.21) (0.21) (0.21) (0.20) (0.19) (0.19) (0.18) Same country -0.28 -0.24 0.12 0.06 0.04 0.05 0.04 0.06
(0.27) (0.31) (0.25) (0.24) (0.21) (0.22) (0.21) (0.19) Free trade agreement -0.38b -0.23 0.06 0.13 0.17 0.23b
(0.18) (0.17) (0.13) (0.12) (0.11) (0.10) Origin effects Yes Yes Yes Yes Yes Yes Yes Yes Destination effects Yes Yes Yes Yes Yes Yes Yes Yes
Observations 8993 9270 13767 14232 16335 16524 16467 17046
Note: Robust standard errors clustered by country-pair in parentheses witha
,b
andc
Table 12: PPML currency union effects – 1964-1971
Dependent Variable: Bilateral Exports
1964 1965 1966 1967 1968 1969 1970 1971
Currency union 1.35a 1.33a 1.36a 1.47a 1.40a 1.22a 1.15a 1.01a (0.22) (0.22) (0.20) (0.19) (0.19) (0.21) (0.21) (0.21) Ln Distance -0.76a -0.78a -0.78a -0.79a -0.80a -0.82a -0.79a -0.77a (0.05) (0.05) (0.05) (0.05) (0.05) (0.05) (0.05) (0.05) Share language 0.43a 0.43a 0.43a 0.44a 0.43a 0.46a 0.42a 0.43a
(0.11) (0.11) (0.10) (0.11) (0.10) (0.10) (0.11) (0.10) Contiguity 0.19c 0.19c 0.18c 0.23b 0.22b 0.23b 0.31b 0.37a
(0.10) (0.10) (0.10) (0.10) (0.10) (0.10) (0.14) (0.13) Common colonizer -0.81a -0.87a -0.44b -0.45b -0.38b -0.34b -0.28c -0.19
(0.28) (0.27) (0.18) (0.17) (0.18) (0.17) (0.16) (0.16) Former colonial relationship 0.69a 0.70a 0.64a 0.65a 0.62a 0.62a 0.62a 0.53a
(0.17) (0.16) (0.15) (0.15) (0.15) (0.16) (0.17) (0.16) Same country 0.04 0.04 0.07 0.00 -0.06 -0.12 -0.14 -0.12
(0.18) (0.18) (0.18) (0.17) (0.17) (0.17) (0.16) (0.15) Free trade agreement 0.32a 0.33a 0.37a 0.40a 0.45a 0.51a 0.54a 0.58a
(0.09) (0.09) (0.09) (0.09) (0.09) (0.09) (0.09) (0.09) Origin effects Yes Yes Yes Yes Yes Yes Yes Yes Destination effects Yes Yes Yes Yes Yes Yes Yes Yes
Observations 18310 18286 18717 18688 19024 19899 20266 20218
Note: Robust standard errors clustered by country-pair in parentheses witha
,b
andc
Table 13: PPML currency union effects – 1972-1979
Dependent Variable: Bilateral Exports
1972 1973 1974 1975 1976 1977 1978 1979
Currency union 0.94a 0.80a 0.71a 0.62a 0.54b 0.48b 0.48b 0.28 (0.19) (0.19) (0.20) (0.21) (0.24) (0.21) (0.19) (0.25) Ln Distance -0.79a -0.83a -0.85a -0.81a -0.79a -0.78a -0.78a -0.80a (0.05) (0.05) (0.05) (0.05) (0.05) (0.05) (0.05) (0.05) Share language 0.41a 0.37a 0.30a 0.32a 0.31a 0.29a 0.24a 0.20b
(0.10) (0.09) (0.09) (0.09) (0.09) (0.09) (0.09) (0.09) Contiguity 0.37a 0.45a 0.38a 0.40a 0.44a 0.44a 0.43a 0.39a
(0.13) (0.13) (0.12) (0.13) (0.13) (0.13) (0.12) (0.12) Common colonizer -0.19 -0.28c -0.32c -0.27 -0.31c -0.32b -0.32b -0.27c (0.15) (0.15) (0.17) (0.17) (0.16) (0.16) (0.15) (0.16) Former colonial relationship 0.45a 0.41a 0.40a 0.40b 0.34b 0.33b 0.32b 0.31b
(0.15) (0.14) (0.14) (0.16) (0.15) (0.15) (0.15) (0.14) Same country -0.11 -0.12 -0.11 -0.07 -0.03 -0.04 -0.02 -0.01
(0.15) (0.15) (0.14) (0.14) (0.14) (0.14) (0.13) (0.13) Free trade agreement 0.59a -0.01 -0.06 0.04 0.09 0.10 0.15 0.18
(0.08) (0.14) (0.13) (0.13) (0.13) (0.13) (0.12) (0.12) Origin effects Yes Yes Yes Yes Yes Yes Yes Yes Destination effects Yes Yes Yes Yes Yes Yes Yes Yes
Observations 20645 20710 20742 20683 21076 21182 20988 20954
Note: Robust standard errors clustered by country-pair in parentheses witha
,b
andc
Table 14: PPML currency union effects – 1980-1987
Dependent Variable: Bilateral Exports
1980 1981 1982 1983 1984 1985 1986 1987
Currency union 0.41c 0.32 0.35c 0.24 0.08 0.16 0.40 0.41 (0.23) (0.20) (0.20) (0.22) (0.22) (0.24) (0.29) (0.31) Ln Distance -0.79a -0.80a -0.83a -0.83a -0.83a -0.83a -0.76a -0.74a (0.05) (0.05) (0.05) (0.06) (0.05) (0.05) (0.05) (0.05) Share language 0.22a 0.21b 0.22a 0.27a 0.30a 0.32a 0.29a 0.31a
(0.09) (0.08) (0.08) (0.08) (0.08) (0.08) (0.08) (0.08) Contiguity 0.33a 0.34a 0.32a 0.34a 0.33a 0.35a 0.41a 0.41a
(0.11) (0.11) (0.10) (0.10) (0.09) (0.09) (0.09) (0.09) Common colonizer -0.22 -0.09 -0.17 -0.22 -0.13 -0.18 -0.13 -0.16
(0.17) (0.17) (0.17) (0.17) (0.18) (0.19) (0.18) (0.18) Former colonial relationship 0.37a 0.37b 0.37b 0.26c 0.18 0.18 0.21 0.18
(0.14) (0.15) (0.15) (0.15) (0.15) (0.14) (0.13) (0.13) Same country 0.07 0.17 0.17 0.12 0.15 0.18 0.28 0.37
(0.15) (0.18) (0.19) (0.21) (0.24) (0.24) (0.25) (0.28) Free trade agreement 0.28b 0.20 0.14 0.18 0.18 0.20c 0.41a 0.48a
(0.14) (0.13) (0.12) (0.12) (0.12) (0.12) (0.13) (0.13) Origin effects Yes Yes Yes Yes Yes Yes Yes Yes Destination effects Yes Yes Yes Yes Yes Yes Yes Yes
Observations 21105 21720 21802 21850 21954 22132 22332 22852
Note: Robust standard errors clustered by country-pair in parentheses witha
,b
andc
Table 15: PPML currency union effects – 1988-1995
Dependent Variable: Bilateral Exports
1988 1989 1990 1991 1992 1993 1994 1995
Currency union 0.49 0.35 0.34 0.34 -0.14 -0.32 -0.44 -0.62b (0.31) (0.29) (0.29) (0.28) (0.30) (0.25) (0.28) (0.30) Ln Distance -0.71a -0.66a -0.68a -0.70a -0.73a -0.71a -0.65a -0.63a (0.05) (0.04) (0.05) (0.05) (0.05) (0.04) (0.05) (0.05) Share language 0.28a 0.19a 0.23a 0.20b 0.19b 0.17b 0.18b 0.19b
(0.07) (0.07) (0.08) (0.08) (0.08) (0.08) (0.08) (0.08) Contiguity 0.47a 0.45a 0.43a 0.45a 0.50a 0.58a 0.54a 0.52a
(0.09) (0.09) (0.10) (0.10) (0.10) (0.10) (0.09) (0.09) Common colonizer -0.21 -0.18 -0.21 -0.25 -0.08 -0.01 0.06 0.13
(0.17) (0.17) (0.17) (0.17) (0.16) (0.15) (0.16) (0.16) Former colonial relationship 0.16 0.18 0.17 0.13 0.08 0.04 0.18 0.19
(0.13) (0.12) (0.12) (0.12) (0.12) (0.12) (0.13) (0.13) Same country 0.43 0.48 0.42 0.43 0.39 0.25 0.25 0.22
(0.29) (0.31) (0.34) (0.33) (0.30) (0.26) (0.24) (0.23) Free trade agreement 0.51a 0.55a 0.48a 0.45a 0.34a 0.34a 0.58a 0.68a
(0.12) (0.09) (0.09) (0.10) (0.10) (0.09) (0.10) (0.11) Origin effects Yes Yes Yes Yes Yes Yes Yes Yes Destination effects Yes Yes Yes Yes Yes Yes Yes Yes
Observations 22978 23478 24222 24739 27254 28912 29844 30336
Note: Robust standard errors clustered by country-pair in parentheses witha
,b
andc
Table 16: PPML currency union effects – 1996-2003
Dependent Variable: Bilateral Exports
1996 1997 1998 1999 2000 2001 2002 2003
Currency union -0.58c -0.93a -0.92a -0.17c -0.18b -0.16c -0.16c -0.14c (0.31) (0.21) (0.20) (0.09) (0.09) (0.08) (0.08) (0.08) Ln Distance -0.62a -0.64a -0.63a -0.70a -0.68a -0.73a -0.75a -0.78a (0.05) (0.05) (0.05) (0.05) (0.05) (0.04) (0.04) (0.04) Share language 0.19b 0.20a 0.19a 0.20a 0.21a 0.22a 0.22a 0.24a
(0.08) (0.07) (0.07) (0.07) (0.07) (0.07) (0.07) (0.07) Contiguity 0.53a 0.46a 0.43a 0.44a 0.46a 0.44a 0.44a 0.39a
(0.09) (0.07) (0.07) (0.08) (0.08) (0.07) (0.07) (0.07) Common colonizer 0.11 0.26c 0.28b 0.09 0.04 0.13 0.11 0.13
(0.16) (0.14) (0.12) (0.20) (0.20) (0.18) (0.18) (0.18) Former colonial relationship 0.21 0.21 0.23c 0.16 0.15 0.15 0.14 0.13
(0.13) (0.14) (0.13) (0.14) (0.14) (0.14) (0.14) (0.15) Same country 0.19 0.34c 0.36c 0.23 0.20 0.13 0.06 -0.03
(0.22) (0.20) (0.20) (0.20) (0.19) (0.18) (0.16) (0.16) Free trade agreement 0.72a 0.73a 0.80a 0.64a 0.66a 0.56a 0.55a 0.51a
(0.11) (0.10) (0.09) (0.09) (0.09) (0.08) (0.09) (0.08) Origin effects Yes Yes Yes Yes Yes Yes Yes Yes Destination effects Yes Yes Yes Yes Yes Yes Yes Yes
Observations 30796 29781 30119 30412 31971 31971 31971 31971
Note: Robust standard errors clustered by country-pair in parentheses witha
,b
andc
Table 17: PPML currency union effects – 2004-2009
Dependent Variable: Bilateral Exports
2004 2005 2006 2007 2008 2009
Currency union -0.08 -0.09 -0.11 -0.11 -0.10 -0.04 (0.08) (0.08) (0.08) (0.08) (0.08) (0.08) Ln Distance -0.74a -0.77a -0.78a -0.76a -0.78a -0.77a (0.04) (0.04) (0.04) (0.04) (0.04) (0.04) Share language 0.23a 0.20a 0.21a 0.20a 0.14c 0.11
(0.07) (0.07) (0.07) (0.07) (0.07) (0.08) Contiguity 0.38a 0.39a 0.39a 0.39a 0.42a 0.40a
(0.07) (0.07) (0.07) (0.07) (0.07) (0.08) Common colonizer 0.25 0.25 0.33c 0.44a 0.49a 0.51a
(0.18) (0.17) (0.17) (0.16) (0.17) (0.16) Former colonial relationship 0.15 0.17 0.15 0.20 0.18 0.23c
(0.13) (0.14) (0.13) (0.13) (0.14) (0.13) Same country -0.07 -0.11 -0.13 -0.12 -0.11 -0.18
(0.15) (0.15) (0.15) (0.15) (0.15) (0.15) Free trade agreement 0.61a 0.49a 0.50a 0.54a 0.42a 0.42a
(0.08) (0.09) (0.08) (0.08) (0.08) (0.08) Origin effects Yes Yes Yes Yes Yes Yes Destination effects Yes Yes Yes Yes Yes Yes
Observations 31971 31971 31762 31762 31762 31762
Note: Robust standard errors clustered by country-pair in parentheses witha
,b
andc
D. Poisson-PML currency union effects – 1948-2009
(positive-trade subsample)
−1
0
1
2
3
1948 1953 1958 1963 1968 1973 1978 1983 1988 1993 1998 2003 2008 year
Currency union effect 95% CI
Table 18: PPML currency union effects (positive trade) – 1948-1955 Dependent Variable: Bilateral Exports
1948 1949 1950 1951 1952 1953 1954 1955
Currency union 1.86a 1.72a 1.72a 1.63a 1.85a 1.79a 1.80a 1.74a (0.35) (0.34) (0.34) (0.31) (0.30) (0.30) (0.30) (0.29) Ln Distance -0.61a -0.59a -0.62a -0.62a -0.69a -0.72a -0.70a -0.60a (0.07) (0.07) (0.07) (0.07) (0.07) (0.07) (0.07) (0.08) Share language 0.03 -0.07 0.02 0.10 0.14 0.14 0.21 0.33b
(0.18) (0.18) (0.16) (0.15) (0.15) (0.15) (0.15) (0.14) Contiguity 0.43b 0.58a 0.61a 0.43b 0.34b 0.44a 0.43b 0.68a
(0.20) (0.19) (0.17) (0.18) (0.16) (0.16) (0.17) (0.22) Common colonizer -0.46 -0.57 -0.83 -0.72 -0.94c -0.96b -0.92b -0.71c (0.49) (0.51) (0.52) (0.50) (0.49) (0.45) (0.46) (0.39) Former colonial relationship 0.74a 0.84a 0.69a 0.67a 0.70a 0.81a 0.77a 0.60a
(0.25) (0.25) (0.26) (0.23) (0.24) (0.24) (0.23) (0.22) Same country 0.09 0.06 0.14 0.12 -0.08 -0.09 -0.08 -0.25
(0.28) (0.35) (0.38) (0.39) (0.30) (0.31) (0.26) (0.24) Origin effects Yes Yes Yes Yes Yes Yes Yes Yes Destination effects Yes Yes Yes Yes Yes Yes Yes Yes
Observations 3048 2881 3070 3134 3598 3657 3616 3810
Note: Robust standard errors clustered by country-pair in parentheses witha
,b
andc
Table 19: PPML currency union effects (positive trade) – 1956-1963 Dependent Variable: Bilateral Exports
1956 1957 1958 1959 1960 1961 1962 1963
Currency union 1.73a 1.74a 1.55a 1.45a 1.36a 1.28a 1.26a 1.21a (0.28) (0.27) (0.25) (0.25) (0.25) (0.25) (0.23) (0.22) Ln Distance -0.62a -0.62a -0.70a -0.69a -0.69a -0.70a -0.71a -0.73a (0.07) (0.07) (0.06) (0.06) (0.06) (0.05) (0.05) (0.05) Share language 0.25c 0.22c 0.19 0.22c 0.27b 0.32a 0.34a 0.36a
(0.13) (0.13) (0.13) (0.12) (0.12) (0.12) (0.11) (0.11) Contiguity 0.65a 0.59a 0.49a 0.46a 0.32a 0.28b 0.28b 0.27b
(0.21) (0.19) (0.14) (0.14) (0.12) (0.12) (0.11) (0.11) Common colonizer -0.73c -0.92b -0.98b -0.94b -0.86b -0.62b -0.67b -0.67b (0.40) (0.41) (0.39) (0.39) (0.36) (0.30) (0.30) (0.29) Former colonial relationship 0.65a 0.67a 0.83a 0.80a 0.82a 0.77a 0.69a 0.68a
(0.20) (0.20) (0.19) (0.19) (0.18) (0.18) (0.17) (0.17) Same country -0.26 -0.23 0.05 -0.01 0.02 0.03 0.01 -0.01
(0.29) (0.34) (0.25) (0.25) (0.22) (0.22) (0.22) (0.19) Free trade agreement -0.34b -0.20 0.13 0.20c 0.23b 0.28a
(0.17) (0.17) (0.12) (0.11) (0.11) (0.10) Origin effects Yes Yes Yes Yes Yes Yes Yes Yes Destination effects Yes Yes Yes Yes Yes Yes Yes Yes
Observations 4187 4173 4622 4566 4992 4989 5188 5574
Note: Robust standard errors clustered by country-pair in parentheses witha
,b
andc
Table 20: PPML currency union effects (positive trade) – 1964-1971 Dependent Variable: Bilateral Exports
1964 1965 1966 1967 1968 1969 1970 1971
Currency union 1.15a 1.15a 1.17a 1.17a 1.17a 0.95a 0.94a 0.82a (0.21) (0.21) (0.20) (0.19) (0.18) (0.19) (0.19) (0.19) Ln Distance -0.74a -0.75a -0.76a -0.77a -0.78a -0.79a -0.77a -0.75a (0.05) (0.05) (0.04) (0.04) (0.04) (0.05) (0.05) (0.05) Share language 0.37a 0.38a 0.37a 0.38a 0.38a 0.41a 0.40a 0.41a
(0.10) (0.10) (0.10) (0.10) (0.10) (0.10) (0.10) (0.10) Contiguity 0.27a 0.26a 0.26a 0.30a 0.29a 0.30a 0.36a 0.40a
(0.10) (0.10) (0.09) (0.10) (0.09) (0.09) (0.13) (0.13) Common colonizer -0.68b -0.74a -0.33c -0.36b -0.28 -0.22 -0.24 -0.15
(0.29) (0.27) (0.19) (0.18) (0.18) (0.16) (0.16) (0.15) Former colonial relationship 0.70a 0.70a 0.66a 0.67a 0.63a 0.63a 0.58a 0.49a
(0.15) (0.15) (0.14) (0.14) (0.14) (0.14) (0.16) (0.15) Same country -0.00 0.01 0.05 -0.01 -0.08 -0.09 -0.13 -0.09
(0.18) (0.17) (0.16) (0.16) (0.16) (0.16) (0.15) (0.15) Free trade agreement 0.34a 0.36a 0.40a 0.43a 0.47a 0.53a 0.57a 0.60a
(0.10) (0.09) (0.09) (0.09) (0.09) (0.09) (0.09) (0.09) Origin effects Yes Yes Yes Yes Yes Yes Yes Yes Destination effects Yes Yes Yes Yes Yes Yes Yes Yes
Observations 6172 6496 6879 6941 6891 7949 8340 8684
Note: Robust standard errors clustered by country-pair in parentheses witha
,b
andc
Table 21: PPML currency union effects (positive trade)– 1972-1979 Dependent Variable: Bilateral Exports
1972 1973 1974 1975 1976 1977 1978 1979
Currency union 0.73a 0.65a 0.57a 0.48b 0.42c 0.39b 0.40b 0.16 (0.18) (0.18) (0.19) (0.20) (0.23) (0.20) (0.19) (0.24) Ln Distance -0.77a -0.80a -0.81a -0.77a -0.75a -0.73a -0.74a -0.77a (0.05) (0.05) (0.05) (0.05) (0.05) (0.05) (0.05) (0.05) Share language 0.39a 0.35a 0.29a 0.32a 0.29a 0.27a 0.22a 0.17b
(0.09) (0.09) (0.09) (0.09) (0.09) (0.09) (0.08) (0.08) Contiguity 0.40a 0.48a 0.43a 0.44a 0.47a 0.47a 0.47a 0.42a
(0.13) (0.13) (0.11) (0.12) (0.12) (0.12) (0.12) (0.11) Common colonizer -0.11 -0.18 -0.24 -0.18 -0.23 -0.23 -0.26c -0.18
(0.15) (0.15) (0.17) (0.17) (0.16) (0.16) (0.15) (0.16) Former colonial relationship 0.42a 0.39a 0.38a 0.38a 0.33b 0.32b 0.32b 0.31b
(0.14) (0.13) (0.13) (0.15) (0.14) (0.14) (0.14) (0.13) Same country -0.10 -0.07 -0.06 -0.03 0.01 -0.00 0.02 0.05
(0.15) (0.14) (0.14) (0.13) (0.13) (0.13) (0.12) (0.12) Free trade agreement 0.61a 0.08 0.06 0.16 0.22c 0.24c 0.26b 0.26b
(0.08) (0.14) (0.12) (0.13) (0.12) (0.12) (0.12) (0.12) Origin effects Yes Yes Yes Yes Yes Yes Yes Yes Destination effects Yes Yes Yes Yes Yes Yes Yes Yes
Observations 8972 9624 9899 9836 9923 10260 10203 10645
Note: Robust standard errors clustered by country-pair in parentheses witha
,b
andc
Table 22: PPML currency union effects (positive trade) – 1980-1987 Dependent Variable: Bilateral Exports
1980 1981 1982 1983 1984 1985 1986 1987
Currency union 0.34 0.26 0.27 0.21 0.06 0.16 0.39 0.44 (0.22) (0.20) (0.19) (0.22) (0.22) (0.24) (0.28) (0.30) Ln Distance -0.74a -0.73a -0.76a -0.77a -0.78a -0.78a -0.71a -0.69a (0.05) (0.05) (0.05) (0.05) (0.05) (0.05) (0.05) (0.05) Share language 0.19b 0.18b 0.20a 0.24a 0.27a 0.30a 0.27a 0.28a
(0.08) (0.08) (0.08) (0.07) (0.07) (0.07) (0.07) (0.07) Contiguity 0.37a 0.39a 0.36a 0.39a 0.39a 0.40a 0.46a 0.46a
(0.11) (0.11) (0.10) (0.10) (0.09) (0.09) (0.09) (0.08) Common colonizer -0.21 -0.06 -0.16 -0.25 -0.18 -0.22 -0.18 -0.24
(0.16) (0.16) (0.17) (0.18) (0.20) (0.21) (0.21) (0.22) Former colonial relationship 0.31b 0.31b 0.28b 0.17 0.09 0.08 0.12 0.10
(0.12) (0.13) (0.14) (0.14) (0.13) (0.13) (0.12) (0.11) Same country 0.16 0.26 0.26 0.22 0.24 0.26 0.37 0.47c
(0.15) (0.18) (0.19) (0.20) (0.23) (0.23) (0.24) (0.27) Free trade agreement 0.42a 0.40a 0.30b 0.34a 0.32a 0.33a 0.52a 0.59a
(0.13) (0.13) (0.12) (0.12) (0.12) (0.12) (0.13) (0.12) Origin effects Yes Yes Yes Yes Yes Yes Yes Yes Destination effects Yes Yes Yes Yes Yes Yes Yes Yes
Observations 10704 10902 10833 10700 10898 11051 11225 11468
Note: Robust standard errors clustered by country-pair in parentheses witha
,b
andc
Table 23: PPML currency union effects (positive trade) – 1988-1995 Dependent Variable: Bilateral Exports
1988 1989 1990 1991 1992 1993 1994 1995
Currency union 0.56c 0.27 0.28 0.28 -0.20 -0.37 -0.48c -0.65b (0.32) (0.28) (0.28) (0.27) (0.29) (0.25) (0.28) (0.30) Ln Distance -0.67a -0.65a -0.67a -0.69a -0.71a -0.69a -0.65a -0.63a (0.05) (0.04) (0.05) (0.05) (0.05) (0.04) (0.04) (0.05) Share language 0.25a 0.17b 0.20a 0.18b 0.17b 0.16b 0.18b 0.19b
(0.07) (0.07) (0.07) (0.08) (0.08) (0.08) (0.08) (0.08) Contiguity 0.50a 0.45a 0.43a 0.45a 0.51a 0.59a 0.55a 0.52a
(0.08) (0.08) (0.09) (0.10) (0.10) (0.10) (0.09) (0.09) Common colonizer -0.31 -0.14 -0.18 -0.20 -0.04 0.02 0.09 0.16
(0.22) (0.18) (0.17) (0.17) (0.16) (0.15) (0.16) (0.16) Former colonial relationship 0.08 0.18 0.17 0.15 0.10 0.06 0.18 0.19
(0.11) (0.11) (0.11) (0.11) (0.12) (0.11) (0.12) (0.13) Same country 0.54b 0.57c 0.52 0.45 0.41 0.26 0.26 0.23
(0.27) (0.31) (0.34) (0.32) (0.30) (0.25) (0.24) (0.23) Free trade agreement 0.58a 0.61a 0.54a 0.50a 0.39a 0.38a 0.59a 0.68a
(0.12) (0.09) (0.09) (0.10) (0.09) (0.09) (0.10) (0.11) Origin effects Yes Yes Yes Yes Yes Yes Yes Yes Destination effects Yes Yes Yes Yes Yes Yes Yes Yes
Observations 12159 12864 13254 13282 14568 15610 16655 17486
Note: Robust standard errors clustered by country-pair in parentheses witha
,b
andc
Table 24: PPML currency union effects (positive trade) – 1996-2003 Dependent Variable: Bilateral Exports
1996 1997 1998 1999 2000 2001 2002 2003
Currency union -0.60c -0.94a -0.94a -0.15c -0.17b -0.15c -0.15c -0.13 (0.31) (0.21) (0.20) (0.09) (0.09) (0.08) (0.08) (0.08) Ln Distance -0.61a -0.63a -0.62a -0.69a -0.68a -0.73a -0.75a -0.78a (0.05) (0.05) (0.05) (0.04) (0.05) (0.04) (0.04) (0.04) Share language 0.18b 0.19a 0.19a 0.20a 0.20a 0.20a 0.21a 0.23a
(0.08) (0.07) (0.07) (0.07) (0.07) (0.07) (0.07) (0.07) Contiguity 0.53a 0.46a 0.43a 0.44a 0.45a 0.44a 0.43a 0.40a
(0.09) (0.07) (0.07) (0.08) (0.08) (0.07) (0.07) (0.07) Common colonizer 0.14 0.27b 0.29b 0.09 0.01 0.12 0.09 0.14
(0.16) (0.14) (0.12) (0.21) (0.20) (0.19) (0.18) (0.18) Former colonial relationship 0.21 0.21 0.23c 0.16 0.15 0.15 0.14 0.13
(0.13) (0.14) (0.13) (0.14) (0.14) (0.14) (0.14) (0.15) Same country 0.20 0.34c 0.37c 0.23 0.21 0.13 0.07 -0.03
(0.22) (0.20) (0.20) (0.20) (0.19) (0.18) (0.16) (0.16) Free trade agreement 0.74a 0.73a 0.81a 0.65a 0.67a 0.57a 0.55a 0.50a
(0.10) (0.10) (0.09) (0.09) (0.09) (0.08) (0.09) (0.08) Origin effects Yes Yes Yes Yes Yes Yes Yes Yes Destination effects Yes Yes Yes Yes Yes Yes Yes Yes
Observations 17909 17728 17964 18259 18932 19228 19456 19832
Note: Robust standard errors clustered by country-pair in parentheses witha
,b
andc
Table 25: PPML currency union effects (positive trade) – 2004-2009 Dependent Variable: Bilateral Exports
2004 2005 2006 2007 2008 2009
Currency union -0.07 -0.08 -0.10 -0.10 -0.09 -0.03 (0.08) (0.08) (0.08) (0.08) (0.08) (0.08) Ln Distance -0.74a -0.77a -0.78a -0.76a -0.78a -0.77a (0.04) (0.04) (0.04) (0.04) (0.04) (0.04) Share language 0.22a 0.20a 0.20a 0.20a 0.14c 0.11
(0.07) (0.07) (0.07) (0.07) (0.07) (0.08) Contiguity 0.38a 0.39a 0.39a 0.39a 0.42a 0.40a
(0.07) (0.07) (0.07) (0.07) (0.07) (0.08) Common colonizer 0.25 0.25 0.34c 0.45a 0.50a 0.51a
(0.18) (0.18) (0.17) (0.17) (0.17) (0.16) Former colonial relationship 0.15 0.16 0.15 0.19 0.18 0.23c
(0.13) (0.14) (0.13) (0.13) (0.14) (0.13) Same country -0.07 -0.11 -0.13 -0.12 -0.10 -0.17
(0.15) (0.15) (0.15) (0.15) (0.15) (0.15) Free trade agreement 0.60a 0.49a 0.49a 0.53a 0.40a 0.41a
(0.08) (0.09) (0.08) (0.08) (0.08) (0.08) Origin effects Yes Yes Yes Yes Yes Yes Destination effects Yes Yes Yes Yes Yes Yes
Observations 19907 20035 20123 20198 20605 20453
Note: Robust standard errors clustered by country-pair in parentheses witha
,b
andc
E. Poisson-PML multilateral and unilateral currency
union effects – 1948-2009. Results used to construct
Figure (3)
Table 26: PPML multilateral and unilateral currency union effects – 1948-1955 Dependent Variable: Bilateral Exports
1948 1949 1950 1951 1952 1953 1954 1955
Unilateral currency union 2.11a 1.99a 1.97a 1.87a 2.06a 1.97a 1.96a 1.90a (0.37) (0.36) (0.35) (0.31) (0.31) (0.31) (0.31) (0.29) Multilateral currency union 2.42a 2.77a 2.68a 2.15a 2.05a 1.82a 1.53b 1.81a
(0.76) (0.75) (0.82) (0.78) (0.67) (0.64) (0.65) (0.52) Ln Distance -0.68a -0.64a -0.67a -0.67a -0.74a -0.76a -0.74a -0.65a (0.08) (0.08) (0.07) (0.08) (0.07) (0.07) (0.07) (0.08) Share language 0.07 -0.02 0.02 0.11 0.16 0.15 0.22 0.31b
(0.18) (0.19) (0.17) (0.16) (0.16) (0.16) (0.15) (0.15) Contiguity 0.36c 0.47b 0.52a 0.32c 0.26 0.36b 0.34b 0.65a
(0.20) (0.19) (0.17) (0.18) (0.17) (0.16) (0.16) (0.24) Common colonizer -0.46 -0.73 -0.96c -0.94c -1.07b -0.92b -0.79c -0.60
(0.51) (0.53) (0.53) (0.50) (0.49) (0.45) (0.47) (0.41) Former colonial relationship 0.75a 0.81a 0.69b 0.66a 0.71a 0.82a 0.78a 0.66a
(0.27) (0.27) (0.27) (0.24) (0.25) (0.25) (0.25) (0.22) Same country 0.12 0.14 0.24 0.21 -0.04 -0.13 -0.17 -0.32
(0.29) (0.36) (0.41) (0.42) (0.31) (0.32) (0.30) (0.27) Origin effects Yes Yes Yes Yes Yes Yes Yes Yes Destination effects Yes Yes Yes Yes Yes Yes Yes Yes
Observations 7801 7265 7527 9078 7847 8100 7972 8551
Note: Robust standard errors clustered by country-pair in parentheses witha
,b
andc
[image:37.612.75.566.192.524.2]Table 27: PPML multilateral and unilateral currency union effects – 1956-1963 Dependent Variable: Bilateral Exports
1956 1957 1958 1959 1960 1961 1962 1963
Unilateral currency union 1.94a 1.94a 1.81a 1.71a 1.59a 1.53a 1.49a 1.41a (0.28) (0.28) (0.26) (0.25) (0.25) (0.25) (0.24) (0.23) Multilateral currency union 2.06a 2.51a 1.24b 1.43b 1.13b 1.66a 1.63a 1.69a
(0.59) (0.57) (0.62) (0.56) (0.52) (0.51) (0.47) (0.39) Ln Distance -0.67a -0.68a -0.74a -0.73a -0.73a -0.75a -0.75a -0.76a (0.08) (0.07) (0.06) (0.06) (0.06) (0.06) (0.05) (0.05) Share language 0.26c 0.22c 0.24c 0.28b 0.32b 0.34a 0.36a 0.39a
(0.14) (0.13) (0.14) (0.13) (0.13) (0.13) (0.12) (0.12) Contiguity 0.59b 0.51b 0.39a 0.35b 0.24b 0.21c 0.23b 0.22b
(0.24) (0.21) (0.14) (0.14) (0.12) (0.12) (0.11) (0.11) Common colonizer -0.83b -1.07b -1.10a -1.10a -0.93b -0.87a -0.89a -0.93a (0.41) (0.43) (0.40) (0.39) (0.36) (0.31) (0.30) (0.31) Former colonial relationship 0.67a 0.68a 0.81a 0.78a 0.85a 0.83a 0.74a 0.72a
(0.21) (0.21) (0.21) (0.21) (0.20) (0.19) (0.19) (0.18) Same country -0.28 -0.23 0.11 0.06 0.04 0.05 0.04 0.06
(0.27) (0.30) (0.26) (0.24) (0.22) (0.22) (0.21) (0.19) Free trade agreement -0.38b -0.23 0.06 0.13 0.17 0.23b
(0.18) (0.17) (0.13) (0.12) (0.11) (0.10) Origin effects Yes Yes Yes Yes Yes Yes Yes Yes Destination effects Yes Yes Yes Yes Yes Yes Yes Yes
Observations 8993 9270 13767 14232 16335 16524 16467 17046
Note: Robust standard errors clustered by country-pair in parentheses witha
,b
andc
Table 28: PPML multilateral and unilateral currency union effects – 1964-1971 Dependent Variable: Bilateral Exports
1964 1965 1966 1967 1968 1969 1970 1971
Unilateral currency union 1.35a 1.33a 1.37a 1.48a 1.46a 1.26a 1.19a 1.08a (0.22) (0.22) (0.21) (0.22) (0.22) (0.26) (0.26) (0.25) Multilateral currency union 1.65a 1.49a 1.10a 1.38a 1.16a 1.08a 1.04a 0.75a
(0.41) (0.35) (0.31) (0.27) (0.31) (0.29) (0.30) (0.26) Ln Distance -0.76a -0.78a -0.78a -0.79a -0.80a -0.82a -0.79a -0.77a (0.05) (0.05) (0.05) (0.05) (0.05) (0.05) (0.05) (0.05) Share language 0.43a 0.43a 0.43a 0.44a 0.43a 0.46a 0.42a 0.43a
(0.11) (0.11) (0.10) (0.11) (0.10) (0.10) (0.11) (0.10) Contiguity 0.20c 0.19c 0.18c 0.23b 0.22b 0.23b 0.31b 0.37a
(0.10) (0.10) (0.10) (0.10) (0.10) (0.10) (0.14) (0.13) Common colonizer -0.85a -0.88a -0.41b -0.42b -0.30c -0.30c -0.25 -0.13
(0.30) (0.28) (0.19) (0.18) (0.18) (0.16) (0.16) (0.15) Former colonial relationship 0.69a 0.70a 0.64a 0.65a 0.62a 0.62a 0.62a 0.53a
(0.17) (0.16) (0.16) (0.15) (0.15) (0.16) (0.17) (0.16) Same country 0.04 0.04 0.08 0.01 -0.06 -0.12 -0.14 -0.11
(0.18) (0.18) (0.18) (0.17) (0.17) (0.17) (0.17) (0.16) Free trade agreement 0.32a 0.33a 0.37a 0.40a 0.44a 0.50a 0.54a 0.58a
(0.09) (0.09) (0.09) (0.09) (0.09) (0.09) (0.09) (0.09) Origin effects Yes Yes Yes Yes Yes Yes Yes Yes Destination effects Yes Yes Yes Yes Yes Yes Yes Yes
Observations 18310 18286 18717 18688 19024 19899 20266 20218
Note: Robust standard errors clustered by country-pair in parentheses witha
,b
andc
Table 29: PPML multilateral and unilateral currency union effects – 1972-1979 Dependent Variable: Bilateral Exports
1972 1973 1974 1975 1976 1977 1978 1979
Unilateral currency union 0.99a 0.91a 0.82a 0.65a 0.55c 0.52b 0.53b 0.38 (0.23) (0.22) (0.23) (0.25) (0.29) (0.25) (0.22) (0.37) Multilateral currency union 0.75a 0.41c 0.34 0.50c 0.51c 0.34 0.27 0.11
(0.24) (0.25) (0.26) (0.26) (0.26) (0.25) (0.23) (0.23) Ln Distance -0.79a -0.83a -0.85a -0.81a -0.79a -0.78a -0.78a -0.80a (0.05) (0.05) (0.05) (0.05) (0.05) (0.05) (0.05) (0.05) Share language 0.41a 0.37a 0.30a 0.32a 0.31a 0.29a 0.24a 0.20b
(0.10) (0.09) (0.09) (0.09) (0.09) (0.09) (0.09) (0.09) Contiguity 0.37a 0.45a 0.38a 0.40a 0.44a 0.44a 0.43a 0.40a
(0.13) (0.13) (0.12) (0.13) (0.13) (0.13) (0.12) (0.12) Common colonizer -0.14 -0.19 -0.24 -0.24 -0.30c -0.29c -0.28c -0.24
(0.15) (0.14) (0.17) (0.17) (0.17) (0.17) (0.16) (0.16) Former colonial relationship 0.45a 0.40a 0.40a 0.40b 0.34b 0.33b 0.32b 0.31b
(0.15) (0.14) (0.14) (0.16) (0.15) (0.15) (0.15) (0.14) Same country -0.11 -0.11 -0.10 -0.06 -0.03 -0.04 -0.02 -0.01
(0.16) (0.15) (0.15) (0.14) (0.14) (0.14) (0.13) (0.13) Free trade agreement 0.59a -0.02 -0.07 0.04 0.09 0.10 0.14 0.17
(0.08) (0.14) (0.13) (0.13) (0.13) (0.13) (0.12) (0.12) Origin effects Yes Yes Yes Yes Yes Yes Yes Yes Destination effects Yes Yes Yes Yes Yes Yes Yes Yes
Observations 20645 20710 20742 20683 21076 21182 20988 20954
Note: Robust standard errors clustered by country-pair in parentheses witha
,b
andc
Table 30: PPML multilateral and unilateral currency union effects – 1980-1987 Dependent Variable: Bilateral Exports
1980 1981 1982 1983 1984 1985 1986 1987
Unilateral currency union 0.56c 0.59c 0.70b 0.51 0.32 0.38 0.93 1.06c (0.34) (0.31) (0.29) (0.36) (0.35) (0.42) (0.58) (0.61) Multilateral currency union 0.21 0.01 0.01 -0.04 -0.16 -0.02 0.03 -0.00
(0.24) (0.23) (0.23) (0.23) (0.23) (0.23) (0.21) (0.20) Ln Distance -0.79a -0.80a -0.83a -0.83a -0.83a -0.83a -0.76a -0.74a (0.05) (0.05) (0.05) (0.06) (0.05) (0.05) (0.05) (0.05) Share language 0.22a 0.21b 0.22a 0.27a 0.30a 0.32a 0.29a 0.30a
(0.09) (0.08) (0.08) (0.08) (0.08) (0.08) (0.08) (0.07) Contiguity 0.33a 0.35a 0.33a 0.35a 0.34a 0.36a 0.42a 0.42a
(0.11) (0.11) (0.10) (0.10) (0.10) (0.09) (0.09) (0.09) Common colonizer -0.18 -0.03 -0.09 -0.15 -0.07 -0.13 -0.03 -0.05
(0.17) (0.17) (0.16) (0.16) (0.18) (0.18) (0.17) (0.16) Former colonial relationship 0.37a 0.37b 0.37b 0.26c 0.18 0.18 0.21 0.18
(0.14) (0.15) (0.15) (0.15) (0.15) (0.14) (0.13) (0.13) Same country 0.08 0.18 0.19 0.13 0.16 0.18 0.30 0.38
(0.16) (0.18) (0.20) (0.21) (0.25) (0.24) (0.25) (0.28) Free trade agreement 0.28b 0.19 0.13 0.18 0.17 0.20 0.41a 0.47a
(0.14) (0.13) (0.12) (0.12) (0.12) (0.12) (0.13) (0.13) Origin effects Yes Yes Yes Yes Yes Yes Yes Yes Destination effects Yes Yes Yes Yes Yes Yes Yes Yes
Observations 21105 21720 21802 21850 21954 22132 22332 22852
Note: Robust standard errors clustered by country-pair in parentheses witha
,b
andc