Economic Development in Nigeria: The
Basic Needs Approach
Ekong, Christopher N. and Onye, Kenneth U.
University of Uyo, Uyo, University of Uyo, Uyo
2012
Online at
https://mpra.ub.uni-muenchen.de/88189/
Economic Developm
ment in Nigeria: t
he Basic Needs
s Approach
Christopher N. Ekong1 Kenneth U. Onye2*
1. Department of Economiccs, Faculty of Social sciences, University of Uyo, P. MM. B 1017 Uyo, Akwa Ibom State, Nigeria
2. Department of Economiccs, Faculty of Social sciences, University of Uyo, P. MM. B 1017, Uyo, Akwa Ibom State, Nigeria
* E-mail oof the corresponding author: [email protected]
Abstract
This paper investigates the efficacy of Nigeria’s development policies in improving the sstandard of living of the people by adopting the Basic Needss Approach (BNA) to development. Relying on post--independence data, the paper placed special emphasis onn the integration and cointegration properties of thhe variables which are prerequisite conditions for technicall efficiency in measuring the parameter estimates andd establishes the notion of long-run equilibrium relationshipp between the basic needs variable (nutrition, health, edducation) and the major macroeconomic policy variable emmployed in the study. Qualified evidence from thhe study indicates that government development policies as measured by its spending on health, education, agriculture and water resources have been partly effectivee and sub-optimal. The paper points to misapplication of funds, abandonment of projects and embezzlement of ppublic funds as major hitches to the efficacy of deevelopment policies in entrenching improved living standarrd in Nigeria. We conclude that the Basic Needs Approoach represents a better methodology for examining the deveelopment process and its impact on people’s welfare aand recommends a more conscientious and objective implemeentation of Nigeria’s development policies in additionn to improved funding.
Keywords: Economic Developmentt, Nigeria, Basic Needs Approach
1. Introduction
The center piece of contemporary eeconomic policies is predicated on growth and develoopment. In Sub-Saharan
Africa (SSA), the various economicc adjustment programs were aimed at enhancing groowth and development. Although there have been attemptss by some studies to equate growth to developmennt, some distinguishing features between the two are discerrnable (Obadan, 1997). While economic growth is deefined as an increase in per capita real income sustained oveer time, economic development, on the other hand, is tthe process whereby the real per capita income not only inncrease over time but includes qualitative and quantiitative improvement in political, social and economic instituutions as well as the distribution of income. This impliies that if the traditional production function expands due too the growth of the variable inputs, then developmennt could be attained. In particular, therefore, development iimplies not only growth of per capita income but aalso its distribution, the sources of growth, the developmennt of infrastructure and administrative institutions. Heence, development is a much broader concept than economiic growth (Essang, 1981:299).
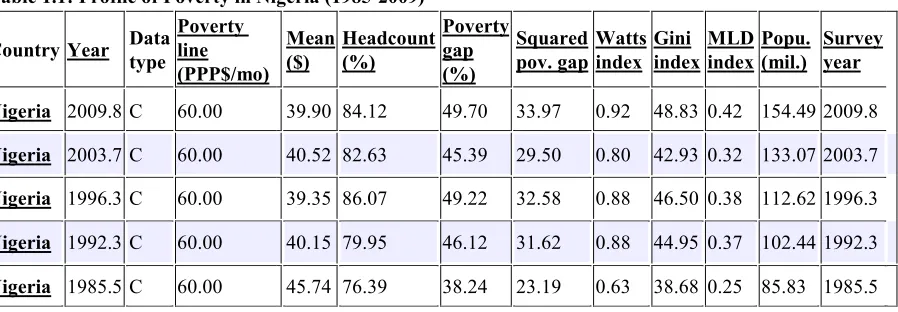
Table 1.1: Profile of Poverty in Nige
Country Year Data type
Poverty line (PPP$/mo) Nigeria 2009.8 C 60.00
Nigeria 2003.7 C 60.00
Nigeria 1996.3 C 60.00
Nigeria 1992.3 C 60.00
Nigeria 1985.5 C 60.00 Source: PovcalNet - Development Re Note : A Poverty line of $60 per mont Poverty gap is defined as the mean sho expressed as a percentage of the pove Poverty headcount ratio at $2 a day (P $2.00 a day at 2005 international price poverty rates for individual countries Overall, Table 1.1 indicates that pove progress made from the impressive gr the Central Bank of Nigeria (CBN) an actual or time picture due to the la decreased from 70.1% in 1980 to 38 rise could not be sustained as the rate utilization rate in Nigeria had plumme in term of public utilities (roads, pow growing. If growth, translates to into given its growth indications of rising G
n Nigeria (1985-2009) Mean
($)
Headcount (%)
Poverty gap (%)
Squared pov. gap
Watts index
Gini index
39.90 84.12 49.70 33.97 0.92 48.83
40.52 82.63 45.39 29.50 0.80 42.93
39.35 86.07 49.22 32.58 0.88 46.50
40.15 79.95 46.12 31.62 0.88 44.95
45.74 76.39 38.24 23.19 0.63 38.68
ent Research Group, World Bank.
r month implies a poverty line of $2 per day.
ean shortfall from the poverty line (counting the nonpoor as poverty line. This measure reflects the depth of poverty as (PPP) (% of population) is the percentage of the populat l prices. As a result of revisions in Purchasing Power Parity ntries cannot be compared with poverty rates reported in ear t poverty ate deep into the growth roots of the country and sive growth performance in the oil sector. The unemployme
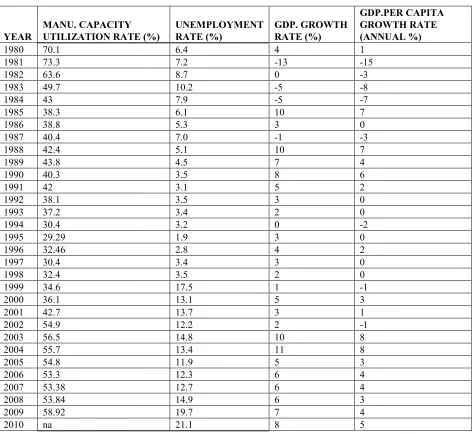
N) and the Nigerian Bureau of Statistics (Table 1.2) might the large and accommodating informal sector in Nigeria to 38.3% in 1985. Slight reprieve came in 1990 when it r e rate plunged to 29.29% in 1995. By the year 2000, the m lummeted to 36.1% against its value of 70.1% in 1980. Infra
s, power, railways etc.) are still very inadequate. Yet the e o into development then one would have concluded that the rising GDP and per Capita Output (table 1.2).
MLD index
Popu. (mil.)
Survey year
0.42 154.49 2009.8 0.32 133.07 2003.7 0.38 112.62 1996.3 0.37 102.44 1992.3 0.25 85.83 1985.5
or as having zero shortfall), rty as well as its incidence. opulation living on less than Parity (PPP) exchange rates,
YEAR
MANU. CAPACITY UTILIZATION RATE (%
1980 70.1
1981 73.3
1982 63.6
1983 49.7
1984 43
1985 38.3
1986 38.8
1987 40.4
1988 42.4
1989 43.8
1990 40.3
1991 42
1992 38.1
1993 37.2
1994 30.4
1995 29.29
1996 32.46
1997 30.4
1998 32.4
1999 34.6
2000 36.1
2001 42.7
2002 54.9
2003 56.5
2004 55.7
2005 54.8
2006 53.3
2007 53.38
2008 53.84
2009 58.92
2010 na
[image:4.595.72.545.79.513.2]Source: World Development Indicat unemployment rate were sourced fro (CBN) Statistical Bulletin (various iss The basic needs of life (health, edu Nigerian who constitute over 80% of development in the form of basic generality of Nigerians. This brings This is important to ensure that macro The broad objective of this paper is Basic Needs Approach (BNA). The development in Nigeria over the peri review of the basic development mo launched by different administration entrenched the desired improvement whether government expenditure on h life, namely, food production, access Basic Need Approach (BNA) and ado product. This is a departure from th growth and development whereby m variables rather than arguments in th emphasis on growth have hitherto a
Table 1.2: Profile of Economic Devvelopment in Nigeria (1980-2010)
TE (%)
UNEMPLOYMENT RATE (%)
GDP. GROWTH RATE (%)
6.4 4
7.2 -13
8.7 0
10.2 -5
7.9 -5
6.1 10
5.3 3
7.0 -1
5.1 10
4.5 7
3.5 8
3.1 5
3.5 3
3.4 2
3.2 0
1.9 3
2.8 4
3.4 3
3.5 2
17.5 1
13.1 5
13.7 3
12.2 2
14.8 10
13.4 11
11.9 5
12.3 6
12.7 6
14.9 6
19.7 7
21.1 8
ndicators (WDI), World Bank. Data on manufacturing ca ced from the Nigeria Bureau of Statistics (NBS) and Cen ous issues).
h, education, food, housing, etc) are reported to be very % of the country’s population. However, it has been argued basic needs had permeated from growth experienced in brings to the fore the quest for an empirical examination of macroeconomic policies are properly focused.
er is to examine the economic development process in Ni . The paper seeks to ascertain whether or not economic e period under study (1970 – 2010). To achieve this, the s nt models and an appraisal of various development strate trations in Nigeria with a view to ascertaining the extent
ment in living standard in the country. In addition, the stud re on health, education, agriculture and water have impacted access to portable water, health and education. The novelt nd adopted for this study is the endogenization of real per om the prevailing orthodoxy that characterizes the old (t eby measures of aggregate economic activities are often in s in the model. The rationale for the endogenization is th erto almost always failed to entrench improvement in li
GDP.PER CAPITA GROWTH RATE (ANNUAL %)
1 -15 -3 -8 -7 7 0 -3 7 4 6 2 0 0 -2 0 2 0 0 -1 3 1 -1 8 8 3 4 4 3 4 5
ing capacity utilization and d Central Bank of Nigeria
very far from the average argued in some quarters that ed in some sectors to the on of this contentious issue.
developed countries (LDCs), hence th innovation is necessary to track the re life expectancy, access to basic educa the index of food production and acce include government spending on heal structured as follows. Section 2 pro development strategies and programm the data set used in the empirical an analysis is presented in section 4. Se concluded in section 6.
2. Eclectic Review of Basic Develop
2.1 The Basic Development Models Early studies on theories of econo under-development or economies of came to set aside these earlier though was launched by the counter revolutio the underdeveloped economies, as the of argument are now emerging on developing countries. Some scholars theories, thus allowing the early theo theories in order to provide a backgro 2.1.1. The Dual Economy Model: B economy model derives its starting po earlier writings of Boeke (1953) and economy as a society consisting of tw mingling in one political unit. Econ emphasizes that a village should not b 2.1.2 Arthur Lewis Model: Lewis mo the time-path of a poor economy gett meaning that in the rural sector the subsistence wage. More precisely, at supply is sufficiently large so that n expansion, about having to bid up w wishes to draw on this unlimited supp has to pay a higher wage, which is a interest among development economi main concern of these efforts was to e of the most prominent attempts to rest 2.1.3 The Fei–Rannis Model: Fei and surplus type of underdeveloped econo two distinct sectors, the modern sect considerable capital and technology production (Essang 1981). According pulled together in their fundamental the industrial sector as follows:
AL = AK + BL ELL Where AL = rate of labou AK = rate of capital accumu Innovations, J = the “inte passage of one unit of time, is raised through time of tech of labour falls as the ratio of Equation 2.1 above states that the rate productivity of labour falls with in accumulation in the industrial sector, which productivity is raised by tech
ence the need to model growth as an argument in the Basic the responses of the basic needs variables (access to good h education as measured by per capita enrolment, access to d access to portable water) to changes in macroeconomic p n health, education, agriculture and water resources. The b 2 provides an eclectic review of the basic development m grammes in history. Section 3 describes the methodology, th ical analysis and the diagnostic tests on the data and mod 4. Section 5 presents the policy implications of our findin
velopment Models and Nigeria’s Development Strategies
economic development have tended to focus on eithe ies of developing countries. Starting from the early 1950s, houghts on development (krugman, 1993:16). Regrettably, t volution was not very convincing in addressing the core issu , as they stressed more growth rather than development. In
g on the efficacy of this new approach in solving the olars have argued that the new approach failed to improve ly theories to remain valid. It, therefore, becomes imperat
ckground for understanding the essential ingredients of econ del: Basu (1998) submits that much of the present day l ting point for Arthur Lewis (1955), but that the origin of the 3) and Furnivall (1939). In his work on India, Furnivall (1 g of two or more elements or social orders which live side . Economic dualism was assigned a much more central d not be interpreted literally but in the context of a “pre–capi
is model is a long run analysis of the development of a du y getting gradually industrialized. Lewis describe the mode tor there is, for all the practical purposes, an unlimited ely, at the subsistence wage, there is an excess supply of l
that no employer - incumbent or prospective - has to wo up wages or about getting rationed in the labour market. I d supply of labour, it cannot, however do so at the subsiste h is a mark–up on the rural subsistence wage. The Lewis m onomists, and in the 1960s there were many attempts to re as to examine the turning points in the long-run process des to restate Lewis model was due to John Fei and Gustav Ran ei and Rannis (1968) presented a theory of development economy like Nigeria. These models present a typical LD n sector and the rural sector. While the modern sector is m nology, the rural sector produces for subsistence and d
ording to Higgins (1968) the proponents of this model (R ental equation, the various factors influencing the rate of l
+ BL + J --- (2.1) ELL
f labour absorption (% rate of growth of industrial employm cumulation, BL= degree of labour using bias or derivation f e “intensity of innovation or fractional increase in output d time, holding both capital and labour constant” or rate of w of technological progress, ELL = rate of which the marg
tio of labour to capital is raised.
he rate of growth of industrial employment depends on the r ith increases in employment (other things being equal) sector, the extent to which innovations release or absorb la y technological progress. From their characterization of
Basic Need functions. This good health as measured by ess to food as measured by mic policy variables which The balance of the paper is ment models and Nigeria’s ogy, the type and sources of d model. The result of the findings, while the paper is
ategies in History
either the economics of 1950s, a counter revolution tably, the new approach that
re issues of development in nt. In recent times, pockets economic problems of prove on early development mperative to revisit the old of economic development.
day literature on the dual of the idea can be traced to vall (1939) defines a plural side by side, yet without entral role by Boeke who capitalistic” community. of a dual economy; it traces model as a “classical” one, mited labour supply at the ly of labour and the excess worry when considering rket. If the capitalist sector bsistence wage. It typically ewis model generated much s to restate it formally. The ss described by Lewis. One v Rannis (1968).
ment relevant to the labour al LDC by the existence of or is market oriented using and depends on land for del (Rannis and Fei, 1968) te of labour absorption into
ployment through time, ation from neutrality of tput due entirely to the e of which productivity e marginal productivity n the rate at which marginal
proponents of the dual economy mo resources on the dynamic, commercia It was believed that this strategy wou transformation of the under- develope a very restrictive role to agriculture a and even exaggerating the capacity of 2.1.4 The Harris–Todaro Model: A m unemployment. Yet the problem dem surprised governments by accentuatin government in an effort to reduce ur pact with capitalists and trade unions increase their employment by 15%. H reverse of what was expected. The po regions to Nairobi in such numbers th was launched. This experience has b these reasons it becomes important to used for policy purposes. The Harris and Todaro, 1970 for an exposition on Harris and Todaro’s work has given r Corden and Findlay, 1975; Fields, 1 1996 cited in Basu, 1998). Mazumd observation that the use of the urban over estimation of the likelihood of would have a greater probability of fi their employees at the beginning of ea new arrival in the urban sector has a s supposes that in the urban sector pe unemployed. But empirical studies in find employment in the urban form informal sector. Indeed informal secto 2.1.5 The Classical and Neo-Classical The classical and neo–classical eco resulting from the intensification of aspirations of the developed economie is not surprising therefore, that most for growth and development. They s 1968:95).
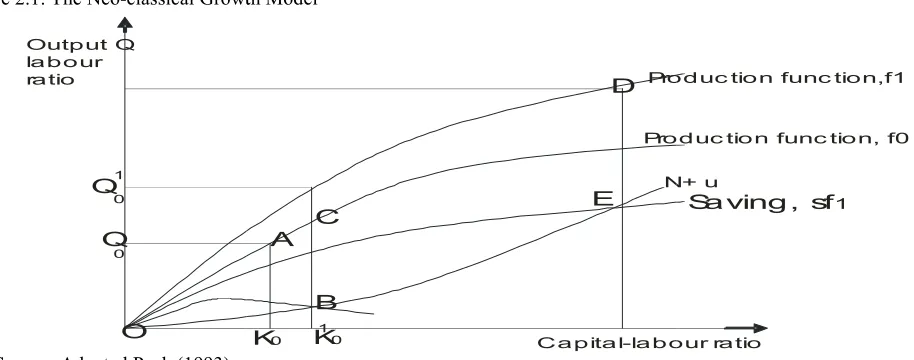
The convergence argument which is classical thinkers that growth result fr view of the convergent argument as p initially at point A in the growth mo along the production function fo as th available new techniques to the right rates are equal across countries as a will move towards C. Equilibrium investment (N + u).
y models (Rannis and Fei, 1968; Lewis 1955) advocated mercial modern sector and the withdrawing resources from t y would ensure cumulative growth of incomes, employmen veloped economies. As we see in Essang (1981), the dual ec
lture and thus misled policy maker in underdeveloped coun city of urban industries for cumulative growth.
el: A major weakness of the early development theories is demand serious theoretical attention because conventiona ntuating rather than curing the problem. Todaro (1981) rep uce urban unemployment particularly in Nairobi and its ou nions which among other things, called on both the private 5%. However, when this pact was implemented, the effect The possibility of new jobs in the urban centres caused mi bers that the end result was higher than urban unemployme has been observed in many other developing countries, in rtant to construct a realistic theory of rural- urban labour di Harris – Todaro model best analyses the scenario (See Tod tion on their model).
iven rise to substantial literature, criticizing and modifying lds, 1975; Todaro, 1976; Mazumdar, 1976; Weary, 1981; azumdar (1976) cited in Basu (1998) was noted to have urban employment rate as the probability of finding an ur od of a migrant finding job. In reality, however, a person ty of finding a job in the next period because employers do
g of each period and choose new workers by a random proc has a smaller probability of finding a job. Also the Harris an tor people find jobs either in the formal sector at a wage dies in Latin America and Asia have revealed that many jo
formal sector end up working (often on poorly paid od l sector can be quite large, as is the case in Nigeria (Essang, assical Model
al economists see the growth of an economy, whether r ion of capital investment and employment of labour. T nomies and are derived from the basic framework of the de most of these theories are anchored on capital intensificatio They see capital as that factor which could create output
hich is presented in the work of Pack (1993) corroborat sult from the intensification of capital investment and emplo nt as presented in the neo–classical growth model (figure 2. th model, with capital-labour ratio (Ko) and output-labour o as they increase their capital-labour ratios. They take adv right of ko. An interpretation of this convergence argumen as a result of domestic saving or international capital mov rium is determined at B where savings Sfo equals the r
ocated the concentration of from the subsistence sector. oyment and rapid structural ual economy model assigns d countries by emphasizing ries is the neglect of urban ntional remedies have often 81) reports that the Kenyan its outskirts entered into a rivate and public sectors to effect turned out to be quite ed migration from the rural loyment before the program ries, including Nigeria. For our distribution that can be ee Todaro, 1969 and Harris
ifying their basis model (see 1981; Beladi and Marjit, have made an interesting an urban job amount to an person presently employed ers do not typically sack all process. This means that a rris and Todaro (HT) model wage (W) or they remain any job seekers who do not aid odd jobs) in the urban ssang, 1981).
ther rural or non-rural, as ur. These models suit the the developed economies. It ification as a necessary tool utput and growth (Higgins
0
Q
0 1
Q
Output Q la b o ur ra tio
O
Source: Adapted Pack (1993) Notes: N is the rate of change and (N+ u) is the Countries starting to the left of p they do not have to incur expenses f These more advanced techniques a assumption is that there exists an int industries and firms within them) ca accumulation and will converge towa rate of u per year, income per unit of l
The Gerschenkron’s (1962) view along the production function f1 a opportunity to move toward f1 and to any given capital-labour ratio to ones intermediate term growth in per capit Technical change would now include existing rate of labour–augmenting te clearly the position that returns paid to However, this model is limited b (1954), it ignores technology which labour as a fixed input with only capi agricultural and economic developm nature, and considering the fact that o determinant of the growth rate of the e 2.1.6 The Endogenous Growth Model Barro and Sala-i-Martins (1990) dem that returns to capital are always con households and firms (for an expositi 141). Basically, in the AK model of t the level of the baseline technology, government such as the provision of activities can be viewed as effects on
2.2 Overview of Nigeria’s Developme
[image:7.595.92.549.89.269.2]Conscious of the fact that its ind not translate to improvement in the l adopted several measures to address live in the rural areas, the developme expectation to the urban sector. Th development strategies with a view to needed development in the country. 2.2.1 Agricultural Credit Guarantee S to provide guarantee of up to 75% of account by Ekong (1991) shows tha Figure 2.1: The Neo-classical Growtth Model
C a p ita l-la b ou Pro d
Pro d
N+
K0 1
K0
E C
A
B
D
ate of labour force growth; u is the rate of labour – augm ) is the investment required to maintain a constant capital-lab eft of point B should grow more rapidly than those already
nses for research or the commercialization of the techniqu ues are available to economies which were initially p an international best practice production function along w m) can move. Output per effective worker will increase towards fo. As long as labour augmenting technical change nit of labour increase at this rate.
) view, interpreted in the convergence theory, is that indus f1 and that the developing countries operate initially and to shift from technologies that have lower total factor ones that have greater TFP (Gerschenkron, 1962). As a res r capita income would include the impact of capital deepen clude the effect of introducing the more productive technol ting technical change. Convergence is the move from A to paid to factor encourage theirproductivity.
ited because, like the dual economy models of Fei & Ran which is an integral embodiment of labour resource. The
y capital variation. But technical labour force is known to b elopment. In Nigeria, for instance, where the economy that over 75% of the country is rural (CBN, 2000), the qua
f the economy with its unlimited labour supply (Lewis 1954 Model (AK Model):
) demonstrate the endogenous growth using the AK mode ys constant. In their demonstration, the model is derived position on the mathematical underpinnings, see Barro and el of the firm with its linear production function y (=AK), ology, A, affects the long run per capita growth rate. The ion of infrastructure, protection of property rights and the cts on the coefficient A and hence, on the growth rate.
lopment Programmes in History:
its industrialization policies and focus on the oil sector to n the living standard of the generality of the people, the g dress this anomaly. Since studies had identified that over 8 lopment policies were targeted at the rural sector, althoug r. This section of the paper presents an overview of so iew to determining the extent to which they have helped in ntee Scheme Fund (ACGSF): This scheme which was estab 5% of total loans by commercial banks to farmers for agri ws that as at 1998, a total of 14637 loans (valued at
la b our ra tio
Pro d uc tio n func tion,f1
Pro d uc tio n func tio n, f0
N+ u
Sa ving , sf1
augmenting technical labour ratio.
lready at it. This is because hniques to the right of Ko. ally poor at no cost. The ong which nations (and the rease as a result of capital change is taking place at the industrial countries operate itially on fo but have the factor productivity (TFP) at s a result of such a shift, the deepening technical change. chnology, f1, as well as the A to D. The model depicts & Rannis (1968) and Lewis . The model also considers n to be positively related to omy is largely agrarian in he quality of labour is a key is 1954).
model. The model implies rived from the behavior of ro and Sala-i-Martins, 1990: AK), anything that changes e. The various activities of d the taxation of economic
guaranteed. As we see in Ekong, C. number of loan account was very p (1986-1993) during which interest borrowing and investment, especially impact due to, among other things, the 2.2.2 River Basin Development Auth flourished around river valleys. Exa Mesopotamia, The Indus Valley in In Loon, 1950; Olayide, et al., 1984). feature (Mitchell, 1954). As we see i noticeable mention in the Internation report advocated the establishment of models of water control projects. The view of the agricultural and navigat planning. In August 1976, another Au the aim of the comprehensive and in these River Basin Development Autho 2.2.3 The Rural Banking Scheme: T Okigbo Financial Review Committee sector. It was drawn up in 3-stages wi and 1989. The scheme was to, amo mobilize savings from rural areas for end of the third phase, the objective 1992.
2.2.4 The Directorate of Food, Roads rural development strategies to yield promulgation of Decree No.4 of 198 roads to provide the link between the provision of inputs (seedling, fertiliz unable to meet the set target due to h 1993.
2.2.5 Better Life for Rural Women ( political and economic responsibilitie programme focused on four basic ar political affairs. While a lot was achie and adult literacy programmes, the sc detriment of the precarious rural wo Abacha decided to proscribe this p Advancement Programme (FEAP). 2.2.6 The Family Economic Advan development through the formation o under government sponsorship using through loans guaranteed up to a ma ouster of the Sanni Abacha Administr 2.3 The Foundation of Economic Dev The earlier theories reviewed in and the transformation of societies fr Meier, 1984, Ekong, 1991, Todaro, 1 industrialization policies and other de to improve the living standard made t development and welfare in 1970. Th in most countries receive all the weal development (George and Sabelli, embodiment of three components: lif only be said to have taken place when Since the Basic Needs Approach areas of food, nutrition, health, educ relatively high growth rates, redistribu of consumption and production patter
ng, C. N. (2001), the fall in the nominal amount of loan very pronounced in the peak period of the Structural Ad est rate took a bullish trend following its deregulatio cially in the ‘uncertain’ agricultural sector. The scheme did gs, the deflating values of loans resulting from inflation. t Authority: Historical facts about civilization show that ci s. Examples include The Nile Valley in Egypt, The Tigri y in India and The Yangtse and Hwang-Ho Valley in Chin 984). Towns such as Oxford, Cambridge and Bedford ex see in Ekong (2001), water resources development in Nig rnational Bank for Reconstruction and Development (IBR ent of a laboratory for salt and silt analysis of water as well ts. The importance of collecting data on River Niger and B avigational benefits that could be derived from using suc her Authority, the Niger Delta Basin Development Authority and integrated physical development of the Delta area. To Authorities can still be seen in many states in Nigeria. me: This scheme was launched in 1976 following the rec mittee which found that over 50.4% of Nigeria’s money sto ges with a total of 766 banks branches to be established in N o, among other things, cultivate the banking habit amon eas for profitable investment. Although it recorded 100% c ectives of the scheme were never realized. The scheme di Roads and Rural Infrastructure (DFRRI): Following the in yield anticipated results, government in 1986 established th of 1987. Under the scheme, the directorate was to constru en the farm produce and the market, promote agricultural p fertilizers and equipment) and the provision of rural hous ue to high level of corruption and duplication of functions men (BLRW): To raise the consciousness of women abo sibilities, the BLRW was established by Mrs. Mariam Bab
asic areas of women problems, namely, health, education s achieved in the areas of promotion of rural health, reducti the scheme was said to have been hijacked by urban ‘bette ral women. This condition manifested in 1993 when the this programme, restructure its organ and rename it th Advancement Programme (FEAP): FEAP was directed tion of cooperative groups. Cottage industries were to be se using cooperative groups as the spring board. The project
a maximum of
N
500,000. The activities of FEAP wer inistration.ic Development
ed in this paper outlined the nature and causes of poverty in eties from rural to industrial which were hinged on agricul aro, 1981; Galbraith, 1980; Kehoane, 1989). But the realiz ther development programmes launched in underdeveloped
ade the World Bank to introduce the Basic Need Approach 70. Thus, it is the reality of income distribution rigidities, w e wealth while the rest live in squalor that informed the Bas
belli, 1994). In his contribution, Goulet (1971) view nts: life sustenance, self-esteem and freedom. He stressed
when and where there is improvement in the basic needs. proach (BNA) constitutes an attempt to come to grips direct
, education and housing, and because it is predicated on a istribution of income, reorientation of investment and a rev pattern, it can be said to provide the foundation for rapid ec
loans guaranteed and the ral Adjustment Programme gulation. This discouraged e did not create the desired that civilization existed and Tigris-Euphrate Valley in n China (Batten, 1939; Van ord exemplify this striking in Nigeria received the first t (IBRD) 1955 report. The s well as the study of simple and Benue was stressed in g such data as a basis for thority was established with ea. Today, the remnants of he recommendations of the ney stocks were in the rural ed in Nigeria between 1976 among rural dwellers and 00% compliance rate at the me died a natural death in the inability of the various hed the DFRRI through the onstruct and maintain rural tural production through the l housing. The scheme was ctions and was scrapped in n about their rights, social, m Babangida in 1987. The cation, farming, social and eduction in infant mortality ‘better-to-do’ women at the n the government of Sanni e it the Family Economic ected at encouraging rural o be set up at the ward level rojects were to be financed P were abandoned with the
erty in developing countries agriculture (Thirwall, 1983; realization that the various loped countries have failed proach (BNA) to measuring ties, where only few people e Basic Needs Approach to view development as an essed that development can
eds.
(Wadlow, 2012). The absence of th producing a sense of fatalism and ac ‘accommodation to poverty’.
3. Methodology
3.1 Method of Analysis
The methodology adopted in this stud development and welfare which was adjusted basic need is employed. That As earlier noted, the novelty introduc endogenization of real per capital gro characterizes the old (traditional) m activities, say GDP, are introduced a the endogenization is the realization t improved living standard in less deve the basic needs functions. This inno changes in macroeconomic policy var Given its wide range of applica technique of regression analysis to est eviews 5.0. In fact, with the exce regression analysis involve the applic standard inference procedures do no regressor, it is imperative to check wh (2004:798) notes, “if a time series is consideration. Thus, an integrated pro such as forecasting or hypotheses te conclusions concerning the integration 3.2 Model Specification
The model for the study is anchored o
i. How has government expenditur
ii. How has government expenditur
iii. How has government expenditur
iv. How has government expenditur
On the basis of the above questions-is as follows:
InLE = InA+α1InGSH +α2InYP +α3In
InPEP= LnA+β1InYP + β2InGEE +
InFP =InA+ Ω1InGACF + Ω2InGSA+
InGDW = InA + €1InGSW + e
----Where LE = life expectan Per Capita Output, FP = I GACF = Government Ag GDW = Access to Good Error Terms, In = Log, P ratio of primary school en The a priori expectation about the sig and €1 > 0.
3.3 The Data
This study makes use of secondary d Central Bank of Nigeria’s (CBN) Sta Nigerian Bureau of statistics (NBS) is
4. The Results
For the purpose of clarity, the results are distinctly presented and interprete 4.1 Preliminary Diagnostic Results
The results from the test of th cointegration properties of the model respectively.
of these basic ingredients leads to a self-perpetuating and acceptance of the established order, which Galbraith (
is study is anchored on the Basic Needs Approach (BNA) t h was introduced by the World Bank in 1970. For the pur . That is, this study regards the basic needs to include food, troduced into the Basic Need Approach (BNA) and employ tal gross domestic product. This is a departure from the prev
al) models of growth/development whereby measures of ced as response variables rather than arguments in the mo ation that the emphasis on growth have hitherto almost alw s developed countries (LDCs), hence the need to model grow s innovation is necessary to track the responses of the ba
cy variables.
pplication with satisfactory results, we employ the ordinar s to estimate the model (section 3.2) using the quantitative e
e exception of the full information likelihood method, al application of the OLS, modified in some respects (Koutso do not apply to regression models which contain an inte eck whether the series is stationary before using it for the es ries is not stationary, its behaviour can only be studied for
ed process may be of little practical value for the purpose o eses tests”. We conduct a battery of unit root tests in or gration properties of the macroeconomic time series used in ored on the following questions.
nditure on health impacted on life expectancy at birth in Nig iture on education influenced primary school enrolment i nditure on agriculture resulted in increased food products? nditure on water increased access to good drinking water? -which the study seeks to address-the econometric spec InFP +е ---(3.1 EE + е ---(3.2 GSA+ е --- (3.3
--- (3 pectancy, A = intercept, GSH = Government Spending on H FP = Index of Food Production, GEE = Government Expen ent Agriculture Credit Facility, GSA = Government spendin Good drinking Water, GSW = Government Spending on Wa
Log, PEP = Primary School Enrolment Per Capita which ool enrolment to the total population.
the signs of the variables is as follows: α1, α2, α3 >0; β
dary data sourced from the World Bank (World Bank Dev N) Statistical Bulletin and Financial Reviews. In addition, d
BS) is employed.
results from the data/model diagnostic tests and the estimat rpreted.
t of the time series properties of the data (integration t model (equations 3.1, 3.2, 3.3 and 3.4) are presented in se
ating chain of poverty by raith (1980) refers to as the
NA) to the measurement of e purpose of this study, an food, health and education. oyed in this study is the e prevailing orthodoxy that res of aggregate economic he model. The rationale for st always failed to entrench el growth as an argument in the basic need variables to rdinary least square (OLS) tive econometrics software, od, all other techniques of outsoyiannis, 1977). Since an integrated regressand or the estimation. As Gujarati d for the time period under pose of statistical inferences in order to arrive at firm sed in the model.
in Nigeria? ment in Nigeria? ucts?
ater?
c specification of the model (3.1)
(3.2)
(3.3) (3.4)
g on Health, YP = real Expenses on Education, pending on Agriculture, on Water Provision, e= which is defined as the ; β1, β2 > 0; Ω1, Ω2 > 0
k Development Indicators), tion, data obtained from the
stimation regression results
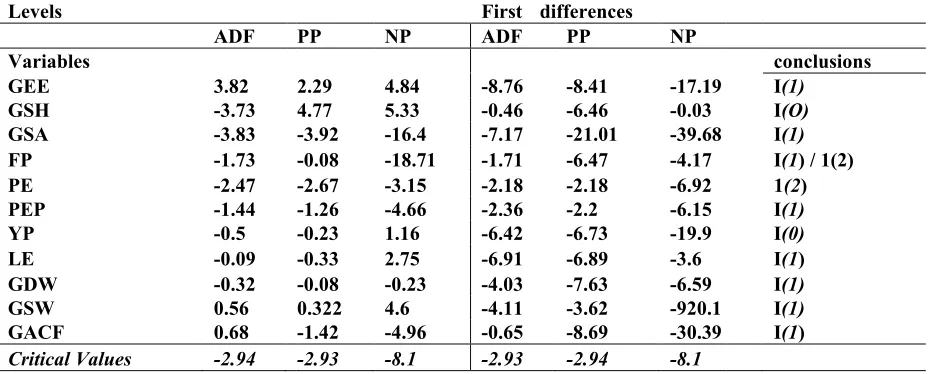
As is clear from the previous contains non stationary time series. T Hence, we carried out a battery of uni properties of the macroeconomic tim test results performed using the Augm The test result help us to determine techniques return results that lead to except for government spending on h the ADF, PP and NP tests were unab that these variables (except PE) becam similar conclusions, but, with an exc levels but not at first difference. Prima Table 4.1: Unit Root Test Results (La
Levels
ADF Variables
GEE 3.82 GSH -3.73 GSA -3.83 FP -1.73 PE -2.47 PEP -1.44 YP -0.5 LE -0.09 GDW -0.32 GSW 0.56 GACF 0.68
Critical Values -2.94
Note: The acronyms for the variables The test results offer reliable in prerequisite condition for technical However, differencing comes with lo and the estimates derived thereof. I combination of two or more of such stationary linear combination is ca equilibrium relationship among the cointegration test to ascertain if the lin 3.3 and 3.4) of the model are stationa its non-stationary (or mixture of statio 4.1.2 Co-integration Results
[image:10.595.67.528.648.722.2]Table 4.2 presents the results of the c We followed the procedure recomme terms of deterministic components an at the 5% level of significance. Table 4.2: Cointegration Test Result
Johannsen Maximum Likelihoo Eq. Co. Variable
3.1 LE GSH YP FP
3.2 PEP YP GEE -
3.3 FP GACF GSA -
3.4 GDW GSW - -
For equation 3.1, we are able to r interpret the evidence as consistent expectancy (LE) on the one hand an food production (FP) on the other h leading to the inability to reject the 4.1.1 Integration Result
vious section, standard inference procedure does not app ries. Therefore, it is crucial to get the prerequisite stage of u of unit root tests in order to arrive at firm conclusions conc
ic time series used in the model. Table 4.1 presents the un Augmented Dickey-Fuller, Philips-Perron (PP) and Ng-Pe ermine the order of integration in the times series. At ead to the rejection of the unit-root hypothesis at the 5% g on health (GSH) and output per capita (YP). When the se unable to reject the unit root null for nine out of the eleve became stationary after first differencing. The NP test retur an exception in that of index of food production (FP) wh . Primary Enrolment (PE) became stationary after second dif lts (Lag Length=2)
First differences PP NP ADF PP NP 2.29 4.84 -8.76 -8.41 -17.19 4.77 5.33 -0.46 -6.46 -0.03 -3.92 -16.4 -7.17 -21.01 -39.68 -0.08 -18.71 -1.71 -6.47 -4.17 -2.67 -3.15 -2.18 -2.18 -6.92 -1.26 -4.66 -2.36 -2.2 -6.15 -0.23 1.16 -6.42 -6.73 -19.9 -0.33 2.75 -6.91 -6.89 -3.6 -0.08 -0.23 -4.03 -7.63 -6.59 0.322 4.6 -4.11 -3.62 -920.1 -1.42 -4.96 -0.65 -8.69 -30.39
-2.93 -8.1 -2.93 -2.94 -8.1
iables are as earlier defined in section 3.2.
ble information concerning the integration properties of t hnical efficiency in measuring the parameter estimates with loss of economic relevance in terms of economic inte reof. Interestingly, if a time series contains a unit root,
f such non-stationary series may be stationary (Engle and is called the cointegrating equation and may be inter g the variables. Thus, we employ Johanson’s (1991) M the linear combination of the non-stationary time series in t tationary. A given equation is said to be cointegrated if the f stationary and non-stationary) series is stationary.
f the cointegration test using the Johansen Maximum Likel commended by Johansen (1991) by starting from the mos nts and then, iterating until the first time the null hypothesis esult
elihood Trace Test
Eigenvalue Trace 5% Crt.Val. conclusion
0.56 58.57 55.25 Ho: r=o, Reje
0.42 25.27 35.01 Ho: r=o, Not
0.511 37.16 35.01 Ho: r=o, Reje
0.72 20.84 18.38 Ho: r=o, Rej
le to reject the null of no cointegration (r=o) at the 5% leve istent with the notion of the existence of a long-run relat
nd and government spending on health (GSH), real per ca ther hand. Conversely, equation 3.2 returned a trace statis ect the null hypothesis of no cointegration. In other wor
ot apply to regression that ge of unit-root testing right. s concerning the integration the unit-root or stationarity Peron (NP) techniques. . At the levels, the three e 5% level of significance the series were differenced, eleven variables, implying t returned results that led to P) which was stationary at
nd differencing.
conclusions I(1)
I(O)
I(1)
I(1) / 1(2) 1(2) I(1)
I(0)
I(1) I(1)
I(1)
I(1)
s of the series which is a ates (Mbutor, 2009: 56). ic interpretation of the data root, as it where, a linear le and Granger 1987). The interpreted as a long-run 91) Maximum Likelihood ies in the equations (3.1, 3.2, if the linear combination of
Likelihood Trace criterion. e most restrictive model in thesis could not be rejected
Co. Eqs.
Rejected One
Not rejected Nil
Rejected One
Rejected Two
equation 3.2 is not a cointegrating re corresponding critical values which higher number of cointegrating relati tests, we estimate the model in their l 3.4 as cointegrating functions. Per c which are stationary at first difference 3.2.
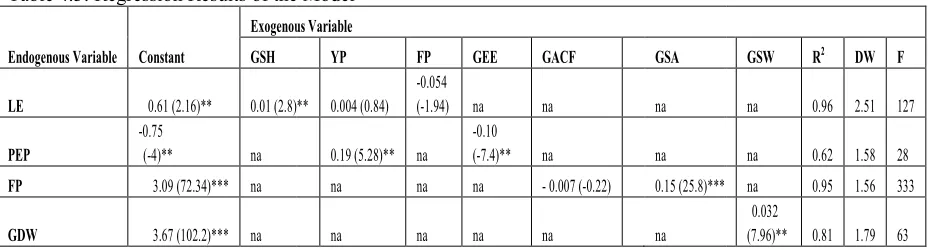
[image:11.595.67.532.214.339.2]4.2 Estimation Regression Results The multiple regression result for the 4.3) and interpreted to allow a flow of Table 4.3: Regression Results of the M
Endogenous Variable Constant
Exogenous
GSH
LE 0.61 (2.16)** 0.01 (2.8)**
PEP
-0.75
(-4)** na
FP 3.09 (72.34)*** na
GDW 3.67 (102.2)*** na
Notes : t-values are in parenthèses, * applicable. All the variables are estim From equation 3.1, government spe production index (FP), met the theore they have the expected positive signs respectively. This means that a 100 Similarly a 100-unit rise in per capita GSH is statistically significant at 5 probability values and the standard er for GSH, for instance, is 2.8. The t-in life expectancy. A possible explana growth in real output. The R2 of 0.96 by variations in government spending on the econometric criterion, the Dur hence there is no reason to suspect t F-statistic of 127 which indicates tha The cointegration results in table 4.2 among the variables in equation 3. expectancy (LE) on the one hand an food production (FP) on the other han The regression results of equation 3. primary enrolment (PEP) as expected priori expected sign since it turned ou significant at 5% LOS. The elastic im about 19% increase in per capita pri education (GEE) may have resulted f poor funding of the education sector i robust although there is no evidence cointegration result. The D.W statisti from equation 3.3 indicates that the related to food production (FP) as ex 25.8. This means that increase in gov citerus paribus. This result is not surp been the priority sectors in the impl administrations to entrench developm
ting relation. The trace statistic of both equation 3.3 and 3. which means that both equations are cointegrating, althou
relations (two) than equation 3.3. Based on the findings f their logged form as specified in section 3.2 and interpret e Per capita enrolment (PEP) and government expenditure ference were employed in log-differenced form in the non
for the model (equations 3.1, 3.2, 3.3 and 3.4) are distinctl low of argument on the individual questions.
f the Model
enous Variable
YP FP GEE GACF GSA
(2.8)** 0.004 (0.84) -0.054
(-1.94) na na na
0.19 (5.28)** na
-0.10
(-7.4)** na na
na na na - 0.007 (-0.22) 0.15 (25.8)***
na na na na na
ses, * significant at 10%, ** significant at 5% and *** signi estimated in their logged form to correct form possible non nt spending on health (GSH) and real per capita outpu theoretical a priori expectation for the evaluation of least s e signs. The coefficients of GSH and YP have elastic imp a 100-unit increase in GSH will lead to about 1 unit ris capita output will improve life expectancy by about 0.4 un t at 5% level of significance (LOS). This is evident fro ard error test. Our table value (t0.025, 40) is 2.042 while the co
-value of per capita output, though positive, was weak xplanation for this is that the high growth in population in f 0.96 indicates that about 96% of variations in life expecta ending on health (GSH), per capita output (YP) and food pr e Durbin Watson (D.W) statistic of 2.51 indicates absence pect that the result is spurious. Overall, equation 3.1 is ro es that the entire parameter estimates in equation 3.1 are st le 4.2 provide evidence for the existence of a long-run eq ion 3.1. This suggests the existence of a long-run relati nd and government spending on health (GSH), real per ca er hand.
tion 3.2 show that real per capita output (YP) is positively pected while government expenditure on education (GEE ned out to be negative. However, the coefficients of both var
stic impact of 0.19 for YP points to the fact that a 100% ris ita primary enrolment (PEP). The negative sign of govern ted from misappropriation of fund meant for the educatio ector in Nigeria. The R2 of 62% and F-statistic of 28 indicat idence of a long-run equilibrium relation among the variab statistic of 1.58 shows the absence of serial correlation in t
at the coefficient of government spending on agriculture ) as expected and statistically significant at 5% LOS as sho in government spending on agriculture will lead to increas ot surprising because as shown in section 2, the rural and ag implementation of the various development programmes elopment in Nigeria.
and 3.4 are greater than the although equation 3.4 has ings from the cointegration rpret equations 3.1, 3.3 and diture on education (GEE) non-cointegrating equation
stinctly presented (in Table
GSW R2 DW F
na 0.96 2.51 127
na 0.62 1.58 28
na 0.95 1.56 333 0.032
(7.96)** 0.81 1.79 63
significant at 1%. na = not le non-linearity.
output (YP), except food least square estimate in that c impact of 0.01 and 0.004 nit rise in life expectancy. 0.4 units. Statistically, only nt from the t-statistic, the the computed t-statistic (tc) weak in explaining changes ion in Nigeria overwhelmed xpectancy can be explained ood production (FP). Based bsence of serial correlation; is robust as shown by the are statistically significant. run equilibrium relationship relationship between Life per capita output (YP) and
Government agriculture credit guara food production. A possible reason is actual disbursement of the loan. E agricultural sector, the banks may s especially where profit motive is thei This is buttressed by the fall in the no 2.2.1), especially during the pick pe econometric criterion, equation 3.3 is is a pointer to the absence of serial c the notion of long-run equilibrium re government spending on agriculture. government spending on water (GSW 0.032 indicates that a thousand unit 32-units rise in access to good drinkin indicated by the F-statistic of 63 an correlation in the equation, so that the
5. Implications For Policy
The results from this study have in Nigeria in particular. The major findi its spending on health, education, ag For development policy to be effect include nutrition, education, health an government to increase the funding implementation must be objective an increasing spending on education, he funds are judiciously applied. One o irresponsibility in the country. Corr objectively if the ‘basic needs’ are to spending on education and per capi projects in the educational sector in re-appraised to address the issues th spending on health on life expectan ravaging prevalence of HIV and AID in general.
6. Conclusions
Focusing on the Basic Needs Approa the basic development models (the Harris-Todaro model, the classical a development programmes in history. the cointegration and integration pro technical efficiency in measuring the relationship between the variables. O relationship between the basic need variables (government spending on th Nigeria’s development policies have misapplication of funds, abandonme efficacy of development policies in objective implementation of Nigeria’s
References
Barro R. J., & sala-i- Martins, X. (199 Basu, K. (1998). Analytical Develo Oxford University Press, Calcutta. Batten, T. R. (1939). Tropical Africa Boeke, J. H. (1953). Economics and
CBN (2000). The Changing Structu
Realm Communications Ltd.
guarantee facility (GACF) is, however, insignificant and son is that guaranteeing of the loan by the government does
an. Even after government has guaranteed commercial may still be unwilling to lend to the ‘uncertain’ agricultu is their primary consideration. High default rate may consti the nominal amount of loans guaranteed and the number of ick period of deregulation in Nigeria as reported in Eko 3.3 is robust given the F-statistic of 333 and R2 of 0.95. The erial correlation in the error term. Evidence from the coint ium relation between food production, agricultural credit g lture. The estimate from equation 4.4 indicates that the long (GSW) is 0.032 with a highly significant t-value of 7.96. unit increases in government spending on water resource drinking water (GDW). Again equation 4.4 is robust and fit 63 and R2 of 81%. The D.W statistic of 1.79 points to hat there is no reason to suspect that the values of the parame
ave interesting implications for the policy debate in deve r finding from the result is that government development po on, agriculture and water have been partly effective and su effective, it must be targeted at meeting the basic needs
alth and access to safe and portable water, among others. I nding of the education and health sector or other basic tive and conscientious. The leaders and people must be co on, health, agriculture and water resources, the governmen
One of the key issues that must be addressed here is the . Corruption and the attitude of embezzling public fund
are to be addressed. The negative but significant relation r capital enrolment points to the misapplication of funds or in Nigeria. Therefore, the implementation of projects in sues that threatened its effectiveness. The significant imp pectancy points to the great potential of spending on hea d AIDS pandemic in Nigeria in particular, and poverty stric
pproach (BNA) to economic development, this paper took (the dual economy models of Fei and Rannis (1968) an sical and neo-classical model, the endogenous growth m story. Relying on post-independence data, the paper placed on properties of the model and variables which are prere ing the parameter estimates and establishes the notion of les. Overall, we find qualified evidence that suggest the need variables (nutrition, health, education) and most m g on the basic needs) employed in the study. The finding
have been partly effective and sub-optimal. As a final poin onment of projects and embezzlement of public funds as ies in entrenching development and recommends a mo geria’s development policies.
. (1990). Economic Growth. New York: McGraw-Hill Inc
evelopment Economics and the Less Developed Econom tta.
Africa in World History Bk, I, O.U. P. London pp24-41. cs and Economic Policy in Dual Societies. Institute of Pac
ucture of the Nigerian Economy and Implications for
t and negatively related to t does not necessarily imply ercial banks’ loans to the ricultural sector in Nigeria constitute yet another hitch. ber of loan account (section n Ekong (2001). Based on 5. The D.W statistic of 1.56 cointegration test supports redit guarantee facility and e long-run elastic impact of 7.96. The elastic impact of sources will result in about and fit the data very well as ts to the absence of serial parameters are spurious.
n developing countries and ent policies as measured by and sub-optimal in Nigeria. needs of the people which hers. It does not suffice for basic infrastructures. The be committed. Aside from rnment must ensure that the is the high level of fiscal fund must also be tackled lation between government funds and poor funding of ects in the sector should be nt impact of government’s n health in addressing the y stricken African countries
r took an eclectic review of 68) and Lewis (1954), the wth models) and Nigeria’s placed special emphasis on prerequisite conditions for on of long-run equilibrium t the existence of long-run ost macroeconomic policy nding from the study is that al point, this study points to nds as major hitches to the a more conscientious and
ill Inc.
onomy Revisited. Oxford:
Ekong, E. E. (1991). Rural Develo University of Cross River State, Uyo.
Ekong, C. N. (2001). Economic Devel
of Uyo, Uyo, Akwa Ibom State, Niger Engle, R. F., & Granger, C. W. (198 Testing. Econometrica, 55, 251-76 Essang, S. (1981). Growth Models a Economics. Ibadan: Ibadan University Fei, J. C. H., & Rannis, G. (1968). De Homewood 111.
Furnivall, J. S. (1939). Netherland Press.
Gaibraith, J. K. (1980). The Nature of George, S., & Sabelli, F. (1994). F Books.
Gerschenkron, A. (1962). Economi MA: Harvard University Press. Goulet, D. (1971). The Cruel Choice: Gujarati, D. N. (2004). Basic Econom
Higgin, B. (1968). Economic Develop
Co. Inc.
Johansen, S. (1991). Estimation and
Models. Econometrica, 59, 1551-1580
Kohaene, R. O. (1989). Poverty Am Distributive Justice. London: We Koutsoyiannis, A. (1977). Theory of E Koinyan, P. (1994). Why Integrated For Food Road and Rural Infrastruct Krugman, P. (1988). Endogenous SUNY–Bufalo Conference on D Economics, Cambridge Mass Proce Krugman, P. (1993). Towards a Cou of Reconstruction and Development ( Lewis, A. W. (1954). Economic Dev Economic and Social Studies, 139-191 Lewis, A. W. (1955). The Theory of Mbutor, O. M. (2009). The Domina Investigation. Central Bank of Nigeria Meier, G. (1984). Leading Issues in D Mitchell, J. B. (1954). Historical Geo Obadan, M. (1997). Analytical Fra strategies. In Poverty Alleviation in N Obadan, M. I., & Odusola, A. F. (19
Evidence and Policy Implications. NC
Olayide S. O. et al. (1984). Perspecti Press Nigeria.
Thirlwall, A. P. (1983). Growth and ELBS/Macmillan.
Todaro, M. (1981). Economic Develo
Van-Loon, E. (1950). The Story of Ma
Pack, II (1993). Technology Gaps Latecomers. The International Bank f Wadlow , R. (2012). Making Basic N
evelopment and the persistence of Poverty. Inaugural L o.
evelopment in Nigeria: The Basic Needs Approach. A Ph , Nigeria.
. (1987). Co-integration and Error Correction: Representa dels and Rural Development. In Olayide. S. O et al. (eds versity Press Publishing House.
Development of the Labour Surplus Economy: Theor
lands India: A Study of Plural Economy. Cambridge: C re of Mass Poverty. Harmonds worth: Penguin.
Faith and Credit – the world Bank’s Secular Empi
omic Backwardness In Historical Perspective: A Book o
ice: A New Concept on the Theory of Development. New nometrics. New Delhi: McGraw-Hill Companies Inc. elopment: Problems Principles and Policies. New Yor n and Hypothesis Testing of Cointegration Vectors in Gau
1580.
Amidst Plenty: World Political Economy and n: Westview Press.
of Econometrics. London: Macmillan Press Ltd.
rated Rural Development is A must for us as a People an tructure, Lagos, Nigeria.
enous Innovations, International Trade and Growth. Pap n Development. Massachustts Institute of Technol
ocessed.
a Counter- Counterrevolution in Development Theory. T ment (IBRD), World Bank.
c Development with Unlimited Supplies of Labour. The
191.
ry of Economic Growth. London: Allen and Unwin Ltd. ominant Channels of Monetary Policy Transmission in N
geria (CBN) Economic and Financial Review-Lagos, 47 in Development. London: Oxford University Press. Geography. London: London University Press.
al Framework for Poverty Reduction: Issues of Economic n in Nigeria. The Nigerian Economic Society.
F. (1999). Savings, Investment and Growth Connections NCEMA Policy Analysis Series 5 (2).
spective in Benin–Owenna River Basin Development. Ibad and Development with Special Reference to Developin
velopment in the Third World. London, Longman. f Mankind. London: Hanrap.
Gaps Between Industrial and Developing Countries. Are nk for Reconstruction and Development, The World Bank
asic Needs Operational in Development Planning. www.com
ural Lecture Series No. 1, A Ph.D Thesis, University esentation, Estimation, and l. (eds.), Elements of Rural heory and Policy. London: dge: Cambridge University
mpire. England: Penguin ok of Essays. Cambridge New York: Atheneum.
York: W. W. Norton & in Gaussian Autoregression
ple and Nation. Directory . Paper Presented at the chnology, Department of ory. The International Bank
e Manchester School of
n in Nigeria: An Empirical (1).
nomic Growth versus other tions in Nigeria: Empirical t. Ibadan, Ibadan University oping Countries. London:
s. Are there Dividends for ank.