Munich Personal RePEc Archive
Does Team Telecommuting Affect
Productivity? An Experiment
Dutcher, E. Glenn and Saral, Krista Jabs
Webster University Geneva
September 2012
Online at
https://mpra.ub.uni-muenchen.de/41594/
Does Team Telecommuting A¤ect Productivity?
An Experiment
E. Glenn Dutcher
yKrista Jabs Saral
zSeptember 2012
Abstract
Telecommuting policies have been increasingly adopted by employers. The bene…ts of telecommuting from the employer’s perspective include direct cost-saving from not having to house employees in an o¢ce and in-direct cost-saving through reduced turnover associated with increased em-ployee satisfaction. The downside is the perceived opportunity for shirk-ing outside of the traditional workplace, a problem which is potentially exacerbated if employees are placed into telecommuting teams. Using a controlled experiment which randomly assigned subjects to participate in the laboratory (non-telecommuters) or to participate online in a location of their choice (telecommuters), we directly test whether telecommuters are more likely to free ride when in teams and whether or not the locational composition of the team in‡uences this outcome. We …nd no evidence of free-riding in teams for either telecommuters or non-telecommuters. We also …nd that variation in output when a worker is paired in a tradi-tional team versus a telecommuting team can be attributed to the beliefs subjects have about their teammates productivity. The last result leads directly to policy implications for managers.
JEL Codes: J21 J24 J28 C90
Key Words: Telecommuting, Team Production, Productivity, Virtual Teams, Economic Experiments
1
Introduction
Many workers have or will have the opportunity to work in a location other than the traditional o¢ce. Matthews and Williams (2005) estimated that
ap-Acknowledgements: We would like to thank Webster University Geneva for funding this project. We would also like to thank David Dickinson and Marie Claire Villeval for informative discusssions and Daniela Rützler for help and comments. In addition, this paper has bene…ted from seminar participants at the Grenoble Applied Economics Laboratory, and the French Experimental Economics Association (ASFEE) meeting in Montpellier, France.
yDepartment of Public Finance, University of Innsbruck, Universitaestrasse 15/4,
Inns-bruck Austria, A-6020, [email protected]
zGeorge Herbert Walker School of Business and Technology, Webster University Geneva,
proximately 53 million people could potentially take advantage of the bene…ts from telecommuting, or 40% of the work force for the United States in 2005. Though the potential number of workers who could telecommute is substantial, the 2008 National Study of Employers found that only 3% of employers of-fered paid work at home for the majority of employees. In 2004, this translated to approximately 13.7 million salaried employees working from home at least once a week.1 The discrepancy between the potential and observed numbers of telecommuters poses a puzzle given the many known bene…ts stemming from such policies. Telecommuting policies represent an opportunity for employers to directly lower costs through reduced overhead expenditures associated with housing employees in a traditional o¢ce (Piskurich, 1996). They also provide an opportunity to increase employee satisfaction which attracts a higher quality, more diverse workforce, and leads to cost savings by reducing turnover.
Yet despite these bene…ts, a large number of employers are hesitant to adopt telecommuting policies for all employees because of strong beliefs that telecom-muting will lead to shirking outside of the o¢ce - a problem which is potentially exacerbated by the widespread use of teams in the workplace. The National Study of Employers included open-ended questions for why workplace ‡exibility was implemented and the primary reason given by employers is overall retention of employees (37%), with a small group of respondents (4%) citing increased productivity.2 The primary factors associated negatively with implementing
workplace ‡exibility were costs (30%) followed by expectations of productivity loss (11%). What is notable is the contrast in opinions on productivity. Some employers believe that workplace ‡exibility will decrease productivity, while others feel it will increase productivity.
In light of the above, it is perhaps not surprising that our current under-standing of how the telecommuting environment a¤ects worker productivity is not well understood (Bailey and Kurland, 2002, Menezes and Kelliher, 2011). Two recent studies by Dutcher (2012) and Bloom et al. (2012) help shed light on individual productivity di¤erences for telecommuters, but to our knowledge there exists no direct empirical evidence for the impact of telecommuting policies on team productivity. Arguably, the examination of telecommuting policies on team productivity should be of utmost importance given the prevalence of team usage in the workplace (Milliken and Martins, 1996) and the well-known incen-tives for shirking under team production (Alchian and Demsetz, 1972; Holm-ström, 1982). Part of the gap in our understanding is likely due to the di¢culties involved in gathering accurate measures of productivity in a …eld setting where team output is not cleanly separable into individual parts. To circumvent these problems, we utilize an experimental design which allows us to carefully control the variables of interest and isolate, in a causal manner, what may be driving behavior in this complex setting.
The primary purpose of this paper is to determine if worker productivity falls within a team environment when individuals are allowed to telecommute
1As estimated by the U.S. Bureau of Labor Statistics.
and to determine to what extent any changes in a worker’s productivity within a team is in‡uenced by the number of teammates who are telecommuting. To accomplish these goals, we randomly assigned subjects to participate in a team production experiment in either a traditional structured o¢ce-type location (the experimental laboratory) or in an unstructured location of their choice. Production involved a paid real-e¤ort typing task where to receive payment subjects had to correctly decode a string of 6 letters into a set of 6 numbers.
Regardless of their location, all subjects participated initially on their own where they were paid a piece-rate based on how many typing tasks were correctly completed in a period of 8 minutes. Following the individual stage, participants were then informed that they would be randomly matched with two other par-ticipants to participate in a series of team stages that mimicked the individual stage in all aspects except that payment was now based on average team output rather than their individual output. Thus, the marginal payment in the team stages was 1/3 of the marginal payment in the individual stage. Each subject participated in three team rounds that varied the locational composition of the members.
To examine a worker’s response to the locational composition of team, we elicited beliefs for both the individual and team rounds. By eliciting these beliefs for all types of participants we obtain an overall picture of worker be-liefs on telecommuting productivity which allows us to control for di¤erences in team production arising not because of location, but because of beliefs over the relative productivity of partners.
We …nd that productivity does not decrease when subjects are in a team versus when they are not. We also …nd a pronounced increase in productivity when subjects have fewer telecommuters in their team. Underlying this result, there exists a strong relationship between a subject’s e¤ort and their beliefs about the output of their teammates which suggests that subjects are behaving as conditional cooperators. Surprisingly, telecommuters are not a¤ected by the presence of other telecommuters or non-telecommuters on their team.
Our …ndings have direct consequences for managers choosing to implement telecommuting policies. First, managers should continue to play an active role in selecting and maintaining a telecommuting team since individual character-istics such as gender matter. Our results also indicate that managers need not worry as much about the productivity of their telecommuters but should pay more attention to the productivity of their o¢ce-based workers. Finally, to en-courage high productivity, managers should engage in activities which update and maintain a worker’s perception (beliefs) that all members of the team are contributing high e¤ort.
2
Related Literature
summary of this literature and point out the many bene…ts associated with …rms implementing telecommuting policies. These advantages suggest a hap-pier, more satis…ed workforce, higher pro…tability for companies, and positive spillovers to society.
Positive spillovers of telecommuting policies for society include reduced air pollution, reduced energy consumption and reduced tra¢c congestion (Piskurich, 1996 and Cascio, 2000).3 Moreover, bene…ts to employees include decreased transportation costs, increased control over their work environments, and in-creased ‡exibility; all of which allows the worker to work when they are the most productive (Niles, 1975; Mokhtarian, 1991). Piskurich also states other bene…ts directly realized by the company. The most notable is saving as much as $8,000 per worker annually in o¢ce space. Additionally, …rms can expect increased employee retention and increased productivity if they allow their workforce to telecommute.
Though these are important elements to consider, we will focus on one of the more controversial claims, which is that employees who telecommute are more productive (Bailyn, 1988; Belanger, 1999; Hill et al., 1998). The almost univer-sal …nding that telecommuters are more productive is often scrutinized because of the methodology employed to make this claim. The typical study uses a survey method which asks the telecommuters directly if they are more produc-tive in their telecommuting environment or in the o¢ce environment. In most instances, the telecommuters chose to be in this environment and would like to continue to do so and so they may unintentionally or intentionally bias their responses. Even when looking at a non-survey study (DuBrin, 1991), comparing the productivity of the workers a manager allowed to telecommute with those whom she did not does not give a clear indication of the environmental factors. This is due to the fact that those workers who are allowed to telecommute have likely built up the trust of a manager through their work ethic.
To overcome these di¢culties, there are two studies which use random as-signment of people to a location in order to isolate the environmental factors on individual productivity. The …rst is Dutcher (2012) who designed an ex-periment around creative and dull tasks which randomly assigned subjects to the laboratory or a location of their choice to perform the tasks in an e¤ort to understand how telecommuting a¤ects individual productivity. The main …nd-ing of this paper is that productivity of the subjects perform…nd-ing the experiment outside of the laboratory (telecommuting) decreased for the dull task, but ac-tually increased for the creative task. This environmental in‡uence was found to be strongest for males as females were not as a¤ected by their environment. The second by Bloom et al. (2012) took advantage of a company seeking to im-plement a telecommuting environment in China to perform a randomized …eld experiment. The authors …nd that the performance of those working from home exceeds that of those working in the o¢ce. While useful for the measurement of individual productivity under telecommuting policies, neither addresses work
performed in teams.
In addition to the literature on telecommuting, our paper also contributes to the experimental literature on team production. In the examination of the incentives for free-riding under a team revenue-sharing scheme our study re-lates to the study by Nalbantian and Schotter (1997), who found high levels of free-riding in an abstract e¤ort choice setting. Frequently, team production is modeled through the use of public goods games (Dickinson and Isaac, 1998; Croson, 2000). Closest in spirit to our set-up is the examination of individual and team productivity using a real e¤ort public good framework by van Dijk et al. (2001). The task utilized was a di¢cult two-variable optimization problem. They …nd no signi…cant di¤erences in e¤ort levels between the individual and team stages, a result which occurs because while some free-riding is observed in teams in other instances individuals increased their e¤ort between individual stage and team stage.
Our task design is most similar to Kuhn and Villeval (2011) who examine gender selection into team-based payment or individual payment. Similar to our design, Kuhn and Villeval also use a decoding task with broader outside options such as internet search and reading magazines. One of their team-based payment treatments involved equal revenue sharing between partners (teams of two). Their primary result is that women select into team-based payment schemes more often than men, except in situations where an e¢ciency advantage is added to the team payment, however, it is a secondary result that is of more relevance to our paper. In line with our results, they …nd no evidence of free-riding when individuals move from individual based payment schemes to revenue sharing teams. Furthermore, they …nd evidence of an increase in productivity as subjects move from the individual stage to the team.
3
Design of Experiments
The goal of the experimental design is to measure changes in productivity within a team setting with varying numbers of telecommuters. To accomplish this we had two types of subjects. The …rst type, non-telecommuters, were individuals recruited to participate in the laboratory at a pre-speci…ed time. The second type, telecommuters, were individuals recruited to participate online at a place of their choosing anytime within a 24 hour block of time.4 To avoid self-selection
issues, the assignment of location was random and subjects in both locations were recruited in exactly the same manner.5
Each subject, regardless of type, participated in a series of four 8-minute rounds that gave them the option to spend their time on a paid typing task, unpaid games of tic-tac-toe, or some combination of both tasks. The typing
4We did place one restriction on the telecommuting subjects. We asked that they partici-pate in any location except the SOWI computer laboratory where the laboratory experiment was taking place to ensure true location di¤erences.
task required subjects to decode a series of 6 random letters into a series of 6 numbers using a code that changed with each combination of letters.6 All
subjects received the same random sequence of letters and code in each round. Across all four rounds the typing task was always paid while tic-tac-toe was never paid. Prior to the set of paid rounds, all subjects participated in an unpaid and virtually unlimited practice period of the typing task and tic-tac-toe.7 Neither of the tasks required practice for mastery, but including this round familiarized subjects with the interface used during the paid rounds.8
The …rst paid 8-minute round was always played as an individual, regardless of location. The individual round paid 8 euro-cents for each correctly coded set of 6 letters and serves as our baseline measure of individual productivity. Following the individual stage, all subjects then entered into a series of three team rounds which varied the telecommuting composition of the team. In each team round, subjects were randomly placed into teams of three so the location composition varied between 0, 1, 2, and 3 telecommuters. In order to isolate the environmental e¤ects, our teams were purposefully minimalistic with no interaction or feedback, and were teams only in the sense that team output was the determinant of pay rather than individual output.9 Subjects’ anonymity was
preserved through the use of a random number for identi…cation and payment. The team stage itself was identical to the individual stage in that each subject had the option of using the entire 8 minutes on the paid typing task or unpaid tic-tac-toe, or some combination of both. However, in the team rounds the payment for the typing task was now equal to 8 euro-cents multiplied by the average correct output of the team so that e¤ort exerted in the paid task was exerted for the team. In other words, we implemented a team pay scheme that involved equal revenue sharing between the partners. Note that this reduced marginal payment for each correctly coded word by 2/3.
Prior to each team round, we primed the subjects with their location and the location of their partners, which changed in each round. To guarantee that subjects were fully aware of the location of their teammates, we also included prominent location information at the top of the screen where the subjects performed the tasks. Our primary treatments are de…ned by the number of telecommuters in a team.
Team Treatments:
1. Zero Telecommuter Team (LLL) - in the zero telecommuter team
treatment, each randomly matched team of three had only participants in the laboratory (zero telecommuters).
6We used a revolving code to minimize learning e¤ects.
7Note that tic-tac-toe was included in order to ensure that our result is not overestimated. This task gives subjects, especially those in the lab, an outside option and thus their e¤ort in the task is not simply due to boredom from the task.
8The program had 100 random codes for the subject to practice with before the codes would repeat and unlimited games of tic-tac-toe. On average, subjects correctly coded 14 words in the coding task and played 5 games of tic-tac-toe in the practice round.
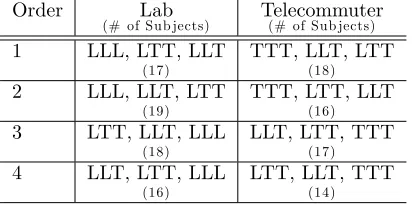
Order Lab
(# of Sub jects) Telecommuter(# of Sub jects)
1 LLL, LTT, LLT
(17)
TTT, LLT, LTT
(18)
2 LLL, LLT, LTT
(19)
TTT, LTT, LLT
(16)
3 LTT, LLT, LLL
(18)
LLT, LTT, TTT
(17)
4 LLT, LTT, LLL
(16)
LTT, LLT, TTT
[image:8.612.204.410.125.227.2](14)
Table 1: Treatment order and number of subjects in each session
2. One Telecommuter Team (LLT) - in the one telecommuter team
treatment, the team consisted of two participants in the laboratory and one telecommuter, playing in a location of their choice.
3. Two Telecommuter Team (LTT)- in the two telecommuter team
treatment, the team consisted of one participant in the laboratory and two telecommuters playing in a location of their choice.
4. Three Telecommuter Team (TTT) - in thethree telecommuter team
treatment, each randomly matched team of three had only telecommuting participants, playing in a location of their choice (zero participants from the lab).
Recognizing that this type of task may result in fatigue or learning over subsequent rounds, leading to the possibility of order e¤ects, we ran four or-ders of the above treatments for each location type of subject. This resulted in 8 total sessions summarized in table 1. We use Lab (L) to denote non-telecommuters who participated in the laboratory and T elecommuter (T) to denote subjects participating in a location of their choice. We ensured that subjects were matched in a round with others primed with the same group com-position. For example, subjects participating in LTT for the …rst team round in the laboratory were matched with telecommuting subjects also participating in LLT for the …rst round.10
At the end of the four rounds, we elicited beliefs regarding the performance of their co-participants. Six questions were asked regarding co-participant out-comes for the individual round and the three team rounds. Each question was incentivized according to Palfrey and Wang (2009) using the payo¤ equation:
question earnings= 100 (Actual Outcome Guess)2
All answers were paid in euro-cents with a correct answer resulting in pay-ment of 1 Euro. The use of the quadratic rule implied that incorrect answers were also paid, but as the distance between the respondent’s answer and the correct answer increased, earnings decreased rapidly, providing strong incentives to answer with accurate beliefs. Incorrect answers that would lead to negative earnings were capped at zero.
For individual round beliefs, subjects were asked to guess the average per-formance of those who participated in the lab and the average perper-formance of telecommuters. In teams, subjects were asked to guess the performance of their teammates. When their teammates were both from the same location (for example, as in the LLL), the subjects were asked to guess the average of both teammates, while if their teammates were in di¤erent locations (for exam-ple, as in LLT), subjects were asked to guess the absolute performance of each teammate.
After beliefs, we also elicited risk preferences using a mechanism adapted from Eckel and Grossman (2008). Subjects were o¤ered a choice between …ve binary 50/50 gambles where both expected value and risk are increasing in the order of gambles. Choosing a lower gamble corresponds to higher risk aversion. The experiment ended with subjects …lling out a survey which asked about their demographic characteristics, simple questions over workplace preferences, and the location they participated in for the experiment.
The experimental design was programmed using Z-tree (Fischbacher, 2007) and subjects were recruited through ORSEE (Greiner, 2004). We ensured that the recruitment procedure did not reveal that some of the subjects would be asked to participate online. After the initial recruitment, subjects that would participate in the laboratory were instructed of the time and place to participate via e-mail. Telecommuting subjects were sent an e-mail that directed them to a website with a link that contained an installer for the client-side of Z-tree (zleaf) which would connect to the university server for these subjects to participate online. The telecommuting subjects were instructed to participate in a location of the choice and informed that they had 24 hours to complete the experiment. The nature of the experiment required that payment was delayed for all subjects. This has the added bene…t that the payment for subjects in both locations is held constant. Each subject received an e-mail within 3 days of their participation that their payment was ready and that they should bring their unique subject ID with them to collect payment. The average subject payment wase13.87 which does not include a show-up fee.
4
Hypotheses
Hypothesis 1: The productivity of a subject in a team will not be higher when compared to an individual baseline.
The stronger form of this hypothesis would state that productivity should decline, but because we do not know the true value of the outside option for this real-e¤ort task, we will maintain the safer assumption of no increase in productivity.
The second hypothesis will examine what happens between our treatments in the team setting. Speci…cally, we want to examine if and how productivity changes as a result of the location of a subject’s teammates. Several studies (Alchian and Demsetz, 1972; Dickinson and Isaac, 1998) point out that work done in teams has many of the features of a public good, and evidence also exists that in the public goods setting many subjects are conditional cooperators (Keser and Van Winden, 2000; Fischbacher et al. 2001) which implies that subjects in a team will only work harder if they think others are also working hard.
Hypothesis 2: Subjects’ productivity while in a team will positively correlate with their beliefs about their team members’ productivity.
Hypothesis 2 requires two things. First, it requires us to know what sub-jects’ beliefs are about their teammates, which we gather after the last round. Second, it requires us to examine if these beliefs in‡uence behavior. Speci…cally, we will examine how subjects’ beliefs vary with the location of their teammates and how this in‡uences their own behavior. In our setting, this suggests that if subjects have varying beliefs on the productivity of their team members based on location, their contributions while in a team will re‡ect these beliefs. The most obvious implication of this hypothesis is if subjects think that telecom-muters are less productive. If an individual, regardless of location, believes that telecommuters are less productive, then hypothesis 2 predicts lower resulting e¤ort as the number of telecommuters on a team increases.
5
Results
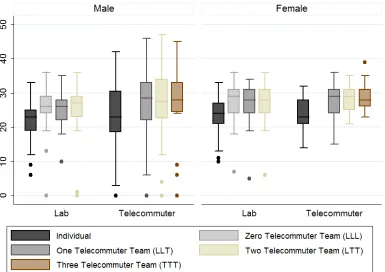
Figure 2: Boxplot of output by gender
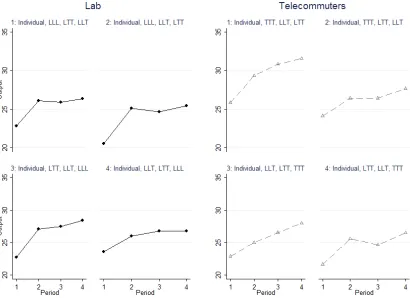
signi…cant increases in productivity for the coding task between the individual baseline and team rounds. This result mirrors what was found by Kuhn and Villeval (2011) under a similar set-up using a decoding task when individuals moved from an individual piece rate to revenue sharing two-person teams.11
Figure 1 also suggests that the data possess a slight time trend which needs to be controlled for, but no obvious order e¤ects appear.12
Regularity 1: Average productivity increased for both telecommuters and non-telecommuters when subjects move from the individual stage to team stages.
Figure 2 is a boxplot diagram which allows a cleaner understanding of vari-ance based on the treatment and gender. The box shows the interquartile range
1 1T-tests of the individual output to the output of any of the team treatments for either location type show signi…cant di¤erences. While we are intrigued by the productivity increase from individual to team output, the reason for this increase is beyond the scope of the current paper.
(25-75) with the median highlighted, while the whisker extends from the box to the most extreme data value within 1.5 times the interquartile range. The remaining points represent outliers beyond that range. We see in Figure 2 that medians across the team treatments do not vary greatly, but it is immediately evident that for males who telecommute there is a large variation in output suggesting strong gender e¤ects.
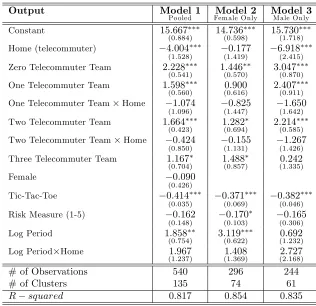
To determine the overall e¤ect of telecommuting teams, we must carefully control for individual e¤ects and time trends. To di¤erentiate the impact of the treatments on behavior from individual characteristics, we present a series of random e¤ects panel regressions on output of correctly coded letter sequences, seen in Table 2.13
The outcome variable is correctly coded sequences while the main explana-tory variables of interest are how many telecommuters are in a team. The vari-ables Zero, One, T wo, and T hree T elecommutersimplies teams where there are zero, one, two and three telecommuters in the team, respectively, while the individual treatment serves as the baseline. These treatment variables are then interacted with the location dummy, Home, to account for di¤erences in the e¤ect of subjects participating in the lab versus telecommuters.14 Notice
that there are only two such interactions, One T elecommuter Home and
T wo T elecommuters Home, because teams of zero telecommuters only
ex-ist for the subjects in the laboratory and teams of three telecommuters exex-ist only for telecommuting subjects. Thus, these six variables test if the increase (or decrease) in output from the individual treatment to the respective team treatments is statistically di¤erent than zero after controlling for other factors. We also include a control variable for gender, represented byF emale. The variable T ic T ac T oe de…nes the number of games played in each round while the variableRisk M easureis our use of the gamble chosen in the Eckel-Grossman mechanism as a measure of risk attitude where lower numbers corre-spond to higher risk aversion. Finally,Log P eriodrepresents the logged period of play, and an interaction ofLog P eriod Homeaccounts for potential di¤er-ences in learning by location. Log P eriodis used to account for the decrease in learning over time, a characteristic which is typical in these types of tasks and is seen in Figure 1.
In the interest of space, we have suppressed control variables for individual productivity and orders to focus on the variables of interest. Speci…cally, all regressions in Table 2 include decile rank dummy variables, an interaction of the decile rank withHome, and dummy controls for the speci…c order a subject participated in to account for potential order e¤ects.15
1 3All regressions include 135 subjects, participating over 4 rounds, giving 540 total obser-vations. The numbers reported in parentheses are clustered standard errors at the individual level to control for potential dependence of error terms. Three (***), two (**), and one (*) stars indicate statistical signi…cance at the 1%, 5%, and 10% respectively. Regressions exclude the practice round.
1 4Our use of the term “home” to denote telecommuting subjects breaks with our previous convention. However, this is done in a e¤ort to reduce confusion on treatments named by the number of telecommuters interacted with the location of the subject.
insignif-Output Model 1
Pooled Fem ale OnlyModel 2 Model 3M ale Only
Constant 15:667
(0:884)
14:736
(0:598)
15:730
(1:718)
Home (telecommuter) 4:004
(1:528)
0:177
(1:419)
6:918
(2:415)
Zero Telecommuter Team 2:228
(0:541)
1:446
(0:570)
3:047
(0:870)
One Telecommuter Team 1:598
(0:560)
0:900
(0:616)
2:407
(0:911)
One Telecommuter Team Home 1:074
(1:096)
0:825
(1:447)
1:650
(1:642)
Two Telecommuter Team 1:664
(0:423)
1:282
(0:694)
2:214
(0:585)
Two Telecommuter Team Home 0:424
(0:850)
0:155
(1:131)
1:267
(1:426)
Three Telecommuter Team 1:167
(0:704)
1:488
(0:857)
0:242
(1:335)
Female 0:090
(0:426)
Tic-Tac-Toe 0:414
(0:035)
0:371
(0:069)
0:382
(0:046)
Risk Measure (1-5) 0:162
(0:148)
0:170
(0:103)
0:165
(0:306)
Log Period 1:858
(0:754)
3:119
(0:622)
0:692
(1:232)
Log Period Home 1:967
(1:237)
1:408
(1:369)
2:727
(2:168)
# of Observations 540 296 244
# of Clusters 135 74 61
[image:14.612.145.461.230.536.2]R squared 0:817 0:854 0:835
Model 1 demonstrates that when lab subjects move from the individual baseline to any of the team stages there is a signi…cant increase in productivity. This e¤ect is strongly signi…cant for Zero, One and Two Telecommuter Teams. The largest impact on behavior appears to be when there are no telecommuters in the team, though this e¤ect can only be con…rmed when comparing the coe¢cients of teams of zero versus one telecommuter (Wald test, p < 0:01), giving a statistical indication that the number of telecommuters in a subject’s team matters.
The story is quite di¤erent for the telecommuters. Looking …rst at the three telecommuter team case, it is shown that the increase in productivity from the individual stage to teams made up of three telecommuters is not signi…cant at the 5% level. For the telecommuters, it is also con…rmed that the there is no increase in productivity when there is one telecommuter on a team (p= 0:581) or two telecommuters on a team (p= 0:099). Thus, the results show that the non-telecommuters are a¤ected by the team treatment much more than the telecommuters.
Turning to gender e¤ects, …gure 2 provided evidence that males had a much larger variance in productivity than females when allowed to telecommute. In order to more cleanly account for these gender di¤erences, Model 1 was rerun using only Females (Model 2) and only Males (Model 3).
From Model 2, we can see that the only strongly signi…cant e¤ect for females is the increase in output for subjects in the lab going from the individual stage to teams made of entirely other lab subjects (zero telecommuter team treat-ment). No other increases in productivity can be con…rmed for lab subjects or telecommuters at acceptable levels. Turning to males, in Model 3 we immedi-ately see a stronger team e¤ect for males in the lab who increase their output when going from the individual rounds to team rounds. Telecommuting males do not increase their productivity regardless of the team composition, mirroring what was previously observed for telecommuting females in Model 2 (p >0:05 for the total e¤ect in both instances).
Result 1: Subjects increased their productivity when going from the indi-vidual treatment to the team treatments. This e¤ect is largely driven by non-telecommuting males, and is strongest for teams composed of the fewest telecom-muters.
Having established that the number of telecommuters in a team and the location of the subject impacts the contributions of current teammates, we will now address the underlying reason for these di¤erences, namely subjects’ beliefs about their teammates. Our starting point for this analysis begins with hypoth-esis 2, which states that a subject may contribute more e¤ort to a team if they think their teammates are also contributing more, and will contribute less if they think their teammates are contributing less. To obtain a precise understanding
0
.1
.2
.3
.4
.5
R
el
at
iv
e
F
req
u
e
nc
y
Lab T el ecom m uter
Believed lab subject was more productive Believed no difference
[image:16.612.134.518.124.406.2]Believed telecommuter was more productive
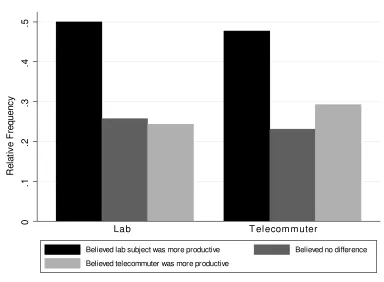
Figure 3: Relative frequency of beliefs regarding telecommuting productivity.
of beliefs, we examine the di¤erences in beliefs when subjects were asked to predict output of telecommuters and lab subjects within the same treatment. Our design facilitates this analysis as all subjects, regardless of whether or not they were lab-based or a telecommuter, participated in one treatment where they were paired in a team with one lab subject and one telecommuter.
Figure 4: Scatterplot of average beliefs over partner productivity (x-axis) versus output (y-axis)
productive.
Regularity 2: Both telecommuters and non-telecommuters believed that telecom-muting would have a detrimental e¤ect on productivity.
To begin the examination of how these beliefs correlate with e¤ort decisions in the treatments, testing hypothesis 2, …gure 4 provides a scatterplot of output in relation to beliefs about teammates’ output for each treatment. Included in each of the belief graphs is a dashed line representing the simple regression and how this correlation relates to a 45 degree line. From this …gure, it is easy to see the positive correlation between output and beliefs, though some heterogeneity is obviously present.
-1
0
1
2
3
D
if
fe
ren
c
e
in
ou
tput
Lab T el ecom m uter
[image:18.612.136.517.229.509.2]Believed telecommuter NOT better Believed telecommuter better
Di¤erence in Output Model 4 Model 5
Fem ale Only Model 6M ale Only
Constant 3:345
(3:377)
1:264
(5:317)
4:843
(4:359)
Beliefs of Lab Teammates 0:472
(0:179)
0:051
(0:266)
0:915
(0:2422)
Beliefs of Lab Teammates Home 0:285
(0:232)
0:204
(0:323)
0:781
(0:335)
Beliefs of Home Teammates 0:521
(0:122)
0:067
(0:172)
1:062
(0:178)
Beliefs of Home Teammates Home 0:007
(0:185)
0:753
(0:281)
0:590
(0:270)
Female 0:226
(0:627)
Home (telecommuter) 3:471
(4:375)
11:160
(7:249)
3:265
(2:582)
Di¤erence in Tic-Tac-Toe 0:340
(0:139)
0:244
(0:182)
0:236
(0:220)
Risk Measure (1-5) 0:011
(0:209)
0:061
(0:263)
0:216
(0:328)
# of Observations 135 74 61
[image:19.612.143.467.123.342.2]R squared 0:267 0:145 0:459
Table 3: Regressions on the di¤erence in correctly coded output when a subject was paired with two other subjects who were at home versus when they were paired with two other subjects who were in the lab.
two lab-based subjects provides the best contrast for how subjects will behave in the two extreme situations. The vertical axis represents the di¤erence in a subject’s output when paired with two telecommuting subjects versus when they are paired with two lab subjects. Values above zero indicate that the sub-ject produced more when paired with two telecommuters than when paired with two lab workers while values below zero imply the opposite. The graph shows that subjects who believe that telecommuters are better than their lab coun-terparts increase their output when paired with two telecommuters over what they produced when they were paired with two lab subjects. The reverse is true when subjects think that telecommuters arenot better. If a subject held beliefs that telecommuters were not more productive than those in the lab, output was below their productivity when they were paired with teammates from the lab. Notice that these results hold regardless of the location of the subject.
We again turn to regression analysis, seen in Table 3, for a more formal understanding of beliefs.16 The dependent variable in the regressions presented
is the di¤erence in output when a subject was paired with two home subjects versus when they are paired with two lab subjects, following what was previ-ously shown in Figure 5. The model is similar to the one used in Table 2 except now the main explanatory variables are the beliefs a subject holds about the productivity of their lab teammates, their telecommuting teammates and these
two variables interacted withHometo account for locational di¤erences. Look-ing at these beliefs separately will inform us if the e¤ect is stronger for beliefs about telecommuters or lab-based subjects. Notice that since the dependent variable is the output of a subject when paired with two telecommuters minus output when paired with two lab-based teammates, according to Figure 4 there should be a negative correlation on the beliefs of other lab subjects and a posi-tive correlation on the beliefs of telecommuters. In other words, the di¤erence in output should become more negative as beliefs of the lab subjects becomes more positive since there is a positive relationship between beliefs and e¤ort. Similarly for the beliefs of the telecommuters. As before, we will run regressions on the full sample (Model 4), then break the sample into only females (model 5) and only males (model 6).
Focusing …rst on the subjects in the lab, Model 4 con…rms that there is a strong correlation between e¤ort and beliefs about a subject’s teammates re-gardless of their location. This can be seen in the signi…cant negative e¤ect on the coe¢cient Beliefs of Lab Teammates and the signi…cant positive e¤ect seen on the coe¢cient Beliefs of Home Teammates. For telecommuters, the same negative e¤ect of beliefs about a subject’s lab teammates cannot be con-…rmed (p= 0:196) while the positive e¤ect of beliefs about other telecommuting teammates’ productivity is con…rmed (p <0:01).
Returning once again to gender di¤erences, Model 5 shows that females, regardless of location, are not in‡uenced by their beliefs of the output of their teammates in the lab (for telecommuting females,p= 0:161) but telecommuting females are in‡uenced by their beliefs of their teammates who are also telecom-muting (p < 0:01) while the same cannot be said for the beliefs of females in the lab.
For males in the lab, Model 6 con…rms the negative e¤ect of beliefs about their teammates in the lab and the positive e¤ect of their beliefs about their telecommuting teammates. For telecommuting males, Model 6 does not con…rm that a subject’s beliefs about their teammates in the lab in‡uenced their relative e¤ort choices (p= 0:556), but it does con…rm the positive, but smaller, e¤ect of a subject’s beliefs of their teammates who were also telecommuting (p= 0:027).
Result 2: Subjects’ e¤ort choices are positively related to their beliefs about their teammates’ output. This result is strongest for non-telecommuting males and both male and female telecommuter’s beliefs about other telecommuters.
6
Conclusion
the telecommuting environment fosters shirking behavior (Mokhtarian and Sa-lomon, 1997). In order to provide more relevant policy recommendations, we also set out to answer, not just if, but why productivity may vary when someone moves from being matched in a traditional team to a telecommuting team.
We used a novel experimental design which randomly assigned subjects to participate in either the laboratory or online in a location of their choice. They were asked to perform a real-e¤ort task individually or in teams with varying numbers of telecommuters. Surprisingly, when comparing the output in the individual rounds to the team rounds, we found no evidence of free-riding in teams. At the individual level, we …nd that as in Dutcher (2012), the main e¤ects come from males. The output of male telecommuters is more variable and there is a (slight) increase in output of the lab subjects when they are paired with fewer telecommuters. Our teams were minimalistic in form as we allowed no communication, no joint decision making, and all three members retained complete anonymity. The use of random matching of anonymous partners and no feedback likely helped support no free-riding, a conjecture forwarded by Andreoni (1988) who found that stranger matching led to higher contributions and less free-riding in a public goods framework.
Nevertheless, the non-decrease in productivity moving from the individual stage to the team stages is surprising, especially given the boring nature of the task and 2/3 marginal payo¤ decline moving from a piece-rate pay scheme to revenue sharing. This result extends the previous experimental results found in Kuhn and Villeval (2011) who used a similar task and provides laboratory robustness for the …eld evidence of more productive teams observed in Hamilton, Nickerson, and Owan (2003).
Examining why this e¤ect exists, Kandel and Lazear (1992) argue that in-creases in team productivity can be due to increased peer-pressure. Despite the fact that subjects would never observe the e¤orts of their partners and vice versa, their e¤ort directly impacted the payo¤s of others in their team. If they felt internal pressure (guilt), they would be more reluctant to free-ride in teams. This e¤ect is ampli…ed if the subjects believed everyone else in their team would choose a high e¤ort level.
This leads naturally to the idea that subjects in our setting were responding as if they were conditional cooperators (Keser and Van Winden, 2000; Fis-chbacher et al. 2001). In our setting, conditional cooperators would be de…ned as individuals who contribute more e¤ort to the paid task if they believe their teammates also contributed more e¤ort to the paid task.
Evidence of the above two conjectures is supported by our …ndings that di¤erences in output when a subject is paired with two lab-based workers versus when they are paired with two telecommuters is strongly tied to their beliefs about their teammates productivity. Speci…cally, we …nd a positive correlation between a subject’s chosen e¤ort and their beliefs about the e¤ort of their teammates which provides an explanation as to why a subject may be less productive when they are in a telecommuting team.
alleviate managers’ fears that employees will shirk more outside of a manager’s direct supervision when the work to be performed is in teams. The second point, more subtle in nature, is that managers should continue to play an active role in selecting who they allow to telecommute given the substantial role played by individual heterogeneity in productivity. The third, and most important im-plication of our …ndings is that even if there is a negative consequence due to some team members telecommuting, reinforcement that all team members are contributing a high e¤ort level will keep productivity high since e¤ort choice is positively correlated to beliefs about their teammates’ productivity.
7
References
1. Andreoni, J. (1988) “Why Free Ride? Strategies and Learning in Public Goods Experiments,”Journal of Public Economics, 37, pp. 291-304.
2. Alchian, A. and Demsetz, H. (1972) “Production, Information Costs, and Economic Organization,”American Economic Review,62, pp. 777-795.
3. Bailey, D. and Kurland, N. (2002) “A Review of the Telework Research: Findings, New Directions and Lessons for the Study of Modern Work,”
Journal of Organizational Behavior, 23, pp. 283-400.
4. Bailyn, L. (1988) “Freeing Work from the Constraints of Location and Time”New Technology, Work, and Employment,3, pp. 143-165.
5. Belanger, F. (1999) “Workers’ Propensity to Telecommute: An Empirical Study,”Information & Management, 35 (3), pp. 139-153.
6. Bloom, N., Liang, J., Roberts, J., and Ying, Z.J. (2012) “Does Work-ing from Home Work? Evidence from a Chinese Experiment.” Stanford working papers.
7. Bond, James, Ellen Galinsky, and Kelly Sakai (2008) “2008 National Study of Employers,” New York, NY: Families and Work Institute. Retrieved from http://familiesandwork.org/site/research/reports/2008nse.pdf.
8. Cascio, W. (2000) “Managing a Virtual Workplace,” The Academy of Management Executive, 14 (3), pp. 81-90.
9. Croson, R. (2000) “Feedback in voluntary contribution mechanisms: an experiment in team production,” Research in Experimental Economics, 8, pp. 85–97.
11. DuBrin, A. (1991) “Comparison of the Job Satisfaction and Productivity of Telecommuters Versus In-House Employees: A Research Note on Work in Progress,”Psychological Reports, 68, pp. 1223-1234.
12. Dutcher, E.G. (2012) “The e¤ects of telecommuting on productivity: An experimental examination. The role of dull and creative tasks,” Journal of Economic Behavior and Organization, forthcoming.
13. Eckel, C. and Grossman, P. (2008) “Forecasting Risk Attitudes: An Ex-perimental Study Using Actual and Forecast Gamble Choices,” Journal of Economic Behavior and Organization, 68 (1), pp. 1-17.
14. Fischbacher, U. (2007) “Z-Tree: Zurich Toolbox For Readymade Economic Experiments,”Experimental Economics 10 (2), pp. 171-178.
15. Fischbacher, U., Gächter, S., Fehr, E. (2001) "Are people conditionally co-operative? Evidence from a public goods experiment,"Economics Letters, 71 (3), pp. 397-404.
16. Greiner, B. (2004) “The Online Recruitment System ORSEE 2.0 - A Guide for the Organization of Experiments in Economics,” - University of Cologne, Working Paper Series in Economics 10.
17. Hamilton, B. H., Nickerson, J. and Owan, H. (2003) “Team Incentives and Worker Heterogeneity: An Empirical Analysis of the Impact of Teams on Productivity and Participation.” Journal of Political Economy, 111 (3), pp. 465-97.
18. Hill, J., Miller, B., Weiner, S., and Colihan, J. (1998) “In‡uences of the Virtual O¢ce on Aspects of Work and Work/Life Balance,” Personnel Psychology, 51, pp. 667-683.
19. Holmström, B. (1982) “Moral Hazard in Teams,” Bell Journal of Eco-nomics,13, pp. 324-340.
20. Kandel, E. and Lazear, E. (1992) “Peer Pressure and Partnerships” Jour-nal of Political Economy, 100, pp. 801-17.
21. Keser, C. and Van Winden, F. (2000) "Conditional Cooperation and Vol-untary Contributions to Public Goods,"The Scandinavian Journal of Eco-nomics, 102 (1), pp. 23-39.
22. Kuhn, P. and Villeval, M.C. (2011) “Do Women Prefer a Co-operative Work Environment?,” - IZA Discussion Paper No. 5999.
23. Matthews, H.S. and Williams, E. (2005) “Telework Adoption and Energy Use in Building and Transport Sectors in the United States and Japan,”
24. Menezes, M. and Kelliher, C. (2011) “Flexible Working and Performance: A systematic Review of the Evidence for a Business Case,”International Journal of Management Reviews, 13, pp. 452-474.
25. Milliken, F. J. and Martins, L. L. (1996) “Searching for common threads: Understanding the multiple e¤ects of diversity in organizational teams,”
Academy of Management Review, 21, pp. 402-33.
26. Mokhtarian, P. (1991) “Telecommuting and Travel: State of the Practice, State of the Art,”Transportation,18, pp. 319-342.
27. Mokhtarian, P. and Salomon, I. (1997) "Modeling the Desire to Telecom-mute: The Importance of Attitudinal Factors in Behavioral Models,"
Transportation Research Part A: Policy and Practice 31 (1), pp. 35-50.
28. Nilles, J. (1975) “Telecommunications and Organizational Decentraliza-tion,”IEEE Transactions On Communications, 23 (10), pp. 1142-1147.
29. Nalbantian, H. R. and Schotter, A. (1997) “Productivity Under Group Incentives: An Experimental Study,”American Economic Review, 87 (3), pp. 314-341.
30. Palfrey, T. and Wang, S. (2009) "On eliciting beliefs in strategic games,"
Journal of Economic Behavior and Organization, 71(2) pp. 98-109.
31. Piskurich, G. (1996) “Making Telecommuting Work,” Training and De-velopment,50, pp. 20-27.
32. U.S. Bureau of Labor Statistics (2005) “Economic News Release: Work At
Home Summary” - Retrieved from http://www.bls.gov/news.release/homey.nr0.htm.
33. van Dijk F., Sonnemans J., and van Winden, F. (2001) “Incentive systems in a real e¤ort experiment.”European Economic Review, 45, pp. 187-214.
8
Appendix
8.1
Examination of order e¤ects and treatment averages
Our objective in running the selected four treatment orders for each location type was to test the strongest cases for order e¤ects. For the lab subjects, the orders were de…ned by having the zero telecommuter treatment (LLL) placed at the front and back-end of the team rounds. Correspondingly, the orders for the telecommuters alternated the three telecommuter treatment (TTT) between the front and back-end of the team rounds. For individuals participating in the lab, Kruskal-Wallis tests indicate no signi…cant di¤erences between orders for output (zero telecommuter team, LLL,p= 0:250; one telecommuter team, LLT,
Coding Task Individual 0 Telecommuter 1 Telecommuter 2 Telecommuter 3 Telecommuter
Team Team Team Team
Lab
(n=70)
22:35
(5:90)
26:58
(6:14)
26:18
(5:33)
26:20
(6:69)
Telecommuter
(n=65)
23:73
(6:84)
27:09
(7:89)
27:8
(7:13)
27:66
(7:56)
[image:25.612.134.568.125.226.2]p value 0:210 0:432 0:181
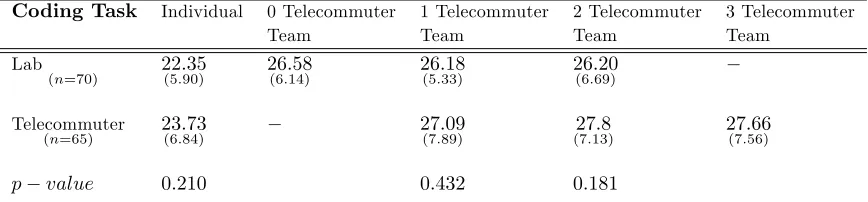
Table 4: Average output of coding task, by location type. Standard deviation in parentheses. Reported p-values represent results from two-sided t-tests for di¤erences in means.
three telecommuter team treatment, TTT (p= 0:550). However, signi…cant dif-ferences are found for the two telecommuter team, LTT, and one telecommuter team, LLT (p= 0:048 andp= 0:014, respectively).
Breaking down the two telecommuter team treatment by gender for the telecommuters, we eliminate the signi…cant di¤erences between orders (females in the two telecommuter team treatment,p= 0:109; males in the two telecom-muter team treatment, p = 0:279). Likewise for the one telecommuter team treatment, between orders there are no signi…cant di¤erences for females out-side of the lab (p= 0:121), yet signi…cant di¤erences remain for males outside of the lab, but these can be attributed to ability e¤ects as removing the top 10% of performers in overall productivity results in insigni…cant di¤erences (p= 0:380). We have also run these same tests using the parametric version of the Kruskal-Wallis test (ANOVA) and …nd the same results.
Table 4 provides averages, by treatment and location type. Note that these overall means are largely misleading given the individual e¤ects and the time trends observed, but we include these here for the interested reader. Again, the previously observed increase from the individual stage to any of the team stages remains. In terms of raw average output, a t-test picks up no statistical di¤erence between the average output of lab subjects and telecommuters when they both have the same number of telecommuters in their team. The di¤erence in output when there are three telecommuter teams versus when there are zero telecommuter teams is also found to be insigni…cant (p= 0:37). While these averages support no productivity loss due to the number of telecommuters on a team, they must be interpreted carefully as a signi…cant amount of variation in the data exists due to gender and ability. Moreover, these averages do not address the idiosyncratic response to the number of telecommuters in a team.
Team Round
8.3
Experimental Instructions
Introduction:
Thank you for participating in today’s experiment. These instructions ex-plain the nature of today’s experiment as well as how to work the computer interface you will be using.
These instructions are complex, please make sure you read through them carefully. The instructions and stages of the experiment are self-paced, so when you have …nished and a "Continue" button is available, please press it.
General Description:
This is an experiment on the economics of decision making where you will have the chance to earn money based on the decisions made by you and others. You should be able to complete the entire experiment on your own without any external assistance of any kind.
You will have the opportunity to make money during today’s experiment, which consists of four, 8-minute rounds. Because of the nature of the experi-ment, your payment cannot be immediately calculated. More detailed instruc-tions for how you can pick up your cash payment for participation today will be given at the end of the experiment.
Tasks:
In each round, you will be able to choose between two tasks. You can split your time among the tasks however you choose. Meaning you can spend all of your time on task I and none on task II, all of your time on task II and none on task I, or some combination of task I and task II, or neither.
Please press "Continue" to see an example of the tasks you will be presented with in each round.
Task 1:
For task I, a string of 6 random letters is displayed below a code bar. The code bar will link a series of letters with a corresponding number. Your task is to …nd the corresponding number associated with the letters and type it in the space provided. Once you are satis…ed with your answer, you will hit the "check answer" button to submit your answer. For each correctly coded string, you will receivee0.08.
The example below shows you the layout of the game. After you submit a code correctly, the code bar will change and a new set of random letters will appear
In this example, the correct code would be 10 17 12 11 22 17. You would get credit for this answer by typing each number in the box below each letter which corresponds to this number in the code bar. However, because this is an example, the "Check Answer" button is non-functioning. During the actual experiment, you would submit your answer with the "Check Answer" button.
Please press Continue to see an example of the second task you will be presented with in each round.
Task 2:
In task II, you will be playing a game against the computer. The game is commonly known as tic-tac-toe. There are nine spaces in which to either put an X or an O. The X represents your choice, while the O represents the computer’s choice. You will win the game when you have three X’s in a row.
You will be able to track your wins and losses against the computer. You will not be paid for playing tic-tac-toe.
Practice:
To familiarize yourself with the tasks and computer interface, you will be taken to a practice round. You will not be paid for this round, it is only for practice purposes. Please press continue to enter into the practice round.
When you have …nished practicing the two tasks, you may continue whenever you are ready by clicking Continue.
Below, you will see an example screen of the screen you would see during a round. You will always have the ability to play both tasks in a round.
In the actual experiment, the left box will contain detailed information about how you will be paid while the right box will contain the summary instructions for both tasks.
As explained previously, you will be presented with two tasks: the coding task and tic-tac-toe. For each correctly coded string in the coding task, you will receivee0.08. Incorrectly coded strings carry no penalty of payment.
Tic-tac-toe is unpaid. Let’s go through an example of how payo¤s work.
Payment Example:
Assume in this round you correctly coded 35 strings of random characters in the allotted time. Since you will gete0.08 for each correctly typed entry, you
would receivee2.80 for this round.
If on the other hand you correctly coded 30 strings of random characters in the allotted time, you would receivee2.40 for this round.
Timing:
The time remaining in each round will be displayed in the upper right corner of your screen. When the time limit of 8 minutes has expired, you will auto-matically be taken to a new screen with instructions on how to proceed. When you are ready, please click continue to enter into round 1.
New Instructions:
The tasks and time limit (8 minutes) in this round are the same as the previous round. However, there is an important change. The di¤erence between this round and the previous round you played is that instead of playing as an individual, you will now be playing in a group of two others and your pay will now depend on your choices and the choices of two others. The others in your group will either perform the task in the SOWI Computer lab or in a location of their choice. More on the locations in a moment.
You will be randomly and anonymously matched with the others in your group. The other members of the group will be given the same two tasks that you are, and as before, the coding task is the only task paid, however, the way that the coding task is paid has changed.
New Payo¤s:
In this round, you and the other 2 members of your group will accumulate group earnings equal toe0.08 for each correctly coded string your group solves,
together. These group earnings will then be equally divided between you and the other two members of your group. In equation form, your payo¤ = [e0.08
* (your output + member 1’s output +member 2’s output)]/3
To understand how the team payment scheme di¤ers from the individual payment scheme, please click "Continue" to see examples.
Group Payment Examples:
Suppose for example you solve 30 coding problems correctly (recall that tic-tac-toe is still unpaid) and the other two group members each solved 20 . You and the other two members of your group would now receive [e0.08 *
(30+20+20)]/3 =e1.87, which is less than the payo¤ example previously given
If, on the other hand, you solve 30 problems and the other two group mem-bers each solved 40, you and the other two memmem-bers of your group would now receive [e0.08 * (30+40+40)]/3 = e2.94, which is more than the example of
the individual payment scheme where you contributed 30.
As another example, suppose that you correctly solved 28 and the other two group members each solved 30. You and the other two members of your group receive [e0.08 * (28+30+30)]/3 =e2.35, which is less than in the example for
the individual payment scheme where you contributed 30.
As a …nal example, suppose that you and the other two group members each solved 30 coding task problems correctly. You and the other two members of your group receive [e0.08 * (30+30+30)]/3 = e2.40, which is the same as in
the example for the individual payment scheme where you contributed 30.
Group Member Information:
All choices are anonymous. The other members in your group will never be told your speci…c output, nor will they be told the amount that you played tic-tac-toe. Likewise, you will never be told the speci…c output of your group members or how much they played tic-tac-toe.
The only information you will be given about the other members of your group is where they will be participating. Similarly, the other members of your group will only know that you are participating in "the SOWI computer lab (“a location of your choice"). The members of your group are not necessarily participating today.
You are about to begin the next round, but before you begin, we will give you information about the location of the members of your group.
Location of the members of your Group:
You are currently participating in “the SOWI computer lab" ("a location of your choice"). The other members of your group are also participating in “the SOWI computer lab." (“a location of their choice, which is not the SOWI com-puter lab (for example, they may be participating from home on their personal computer).