EUR
4498 e
COMMISSION OF THE EUROPEAN COMMUNITIES
STUDY OF THE NEUTRON STREAMING
THROUGH CYLINDRICAL DUCTS WITH TWO
BENDS IN WATER : EXPERIMENTS
Final Report
^^SSáy-
mm
by
SjS
Sii
Β. CHINAGLIA, G. BOSIO and D. M O N T I Ì J ^ ^ H M J A K
(SORIN)
m*
1 9 7 0
Report prepared by SORIN
This document was prepared under the sponsorship of the Commission of the European Communities.
Neither the Commission of the European Communities, its contractors nor any person acting on their behalf :
Make any warranty or representation, express or implied, with respect to the accuracy, completeness, or usefulness of the information contained in this document, or t h a t the use of any information, apparatus, method, or process disclosed in this document may not infringe privately owned rights ; or
Assume any liability with respect to the use of, or for damages resulting from the use of any information, apparatus, method or process disclosed in this document.
jåtaik'Jf ' lìllà i(Ä ^·ψΓΙ**'.
This report is on sale a t the addresses listed on cover page 4
at the price of F F 9.45 FB 85.— DM 6.20 Lit. 1,060.— Fl. 6.20
When ordering, please quote the EUR number and the title, which are indicated on the cover of each report.
Printed by Vanmelle, Gand Luxembourg, September 1970
EUR 4498 e
STUDY OF THE NEUTRON STREAMING THROUGH CYLINDRIC-AL DUCTS WITH TWO BENDS IN WATER : EXPERIMENTS — Final report
by B. CHINAGLIA, G. BOSIO and D. MONTI (SORIN) Commission of the European Communities
Report prepared by SORIN — Società Ricerche Impianti Nucleari Saluggia (Italy)
Euratom Contract No. 077-66-1 TEEI
Luxembourg, September 1970 — 62 Pages — 16 Figures — FB 85.— The problem of neutron streaming through cylindrical bent ducts in water has been studied with a set of experiments in which both the angle and the diameter have been changed (four values for the angle from 15 to 90° and two values for the diameter : 15 and 30 cm).
The results expressed as reaction rates for threshold neutron detectors and thermal and epithermal flux are presented in tables and graphs. They will serve as a basis for future development of calculation procedures.
EUR 4498 e
STUDY OF THE NEUTRON STREAMING THROUGH CYLINDRIC-AL DUCTS WITH TWO BENDS IN WATER : EXPERIMENTS — Final report
by B. CHINAGLIA, G. BOSIO and D. MONTI (SORIN) Commission of the European Communities
Report prepared by SORIN — Società Ricerche Impianti Nucleari Saluggia (Italy)
Euratom Contract No. 077-66-1 T E E I
Luxembourg, September 1970 — 62 Pages — 16 Figures — FB 85.— The problem of neutron streaming through cylindrical bent ducts in water has been studied with a set of experiments in which both the angle and the diameter have been changed (four values for the angle from 15 to 90" and two values for the diameter : 15 and 30 cm).
EUR 4498 e
COMMISSION OF THE EUROPEAN COMMUNITIES
STUDY OF THE NEUTRON STREAMING
THROUGH CYLINDRICAL DUCTS WITH TWO
BENDS IN WATER : EXPERIMENTS
Final Report
by
B. CHINAGLIA, G. BOSIO and D. MONTI
(SORIN)
1970
Report prepared by SORIN
the angle and the diameter have been changed (four values for the angle from 15 to 90° and two values for the diameter : 15 and 30 cm).
The results expressed as reaction rates for threshold neutron detectors and thermal and epithermal flux are presented in tables and graphs. They will serve as a basis for future development of calculation procedures.
KEYWORDS
NEUTRONS
COOLANT LOOPS WATER
BACKGROUND
3
-Index
Page
1. Introduction 5
2. Experimenta 6
2.1-lhe irradiation facility 8
2.2-Duct configurations 11
2.3-Detectors 12
3. Results 13
4. Conclusions 16
Appendix 18
5
-Introduction *)
The shield of a nuclear reactor is always pierced by chan neis and often the overall performance of the shield system is determined by the streaming through voids and ducts. This is true not only for gas cooled power reactors, but applies also to water cooled reactors, if one considers, for instance, the annular gap around the pressure vessel or the voids
existing around the coolant channels. However, in spite of all the work done on neutron streaming, the problem of predici^ ing the neutron flux inside the void and in the medium around the void, cannot be considered as. fully resolved.
The shield designer must often decide whether to use ana-lytical approximations (which may be very uncertain) or straightforward general purpose Monte Carlo methods, which usually require very long computing times.
The situation may be much improved by the use of the albedo concept, in conjunction with a Monte Carlo process which de-scribes the individual histories of neutrons reflected along the walls, or alternatively with a simpler iterative (analy-tical) technique0
Such calculations however have several degrees of complexity and it is very important to know for any particular situation what kind of complexity is required in order to obtain results with a given accuracy. If, for instance, the albedo conoept is adopted, the reflection coefficient depends on as many as five variables, three defining the angle of incidence and emis_ sion and two the energy of the in-going and out-going particle; considerable saving of computing time may be achieved if the number of variables can be reduced or if simple analytical
a set of experimental data measured in known conditions; these data may serve a dual purposes to provide a basis for testing the calculations performed with increasing complexity until a sufficient accuracy is reached and to permit, when possible, an empirical correlation between some relevant quantities
(such as the neutron flux on the axis in the case of a cylin drical duct) and various geometric parameters.
Since some years a cooperation exists between SORIN and OCR Euratom-Ispra for the research on the neutron streaming problem following a development program of experiments and calculations according to the line described above. A part of the work has been performed previously under an Euratom contract for the study of the neutron penetration in straight cylindrical ducts in water f\J and a second part concerning experiments on cylindrical ducts with two bends is the object of the Contract 077-66-1-TEEI. This report describes the results obtained under this Contract and therefore contains
only the experimental data.
These have been already published in the three-monthly progress reports and in the first annual report ƒ2/, further-more some results and the details of some calculation
proce-dures have been the object of a common paper SORIN - CCR Ispra
2„ Experiments
7
-bend on the spatial and energy distribution of neutrons. Therefore 4 values of the angle between straight sections
(15°} 30°, 60°, 90°) have been examined for 2 duct diameters (15 and 30 cm). Furthermore the neutron spectrum determina tion requires at least 4 different detectors J one for ther mal neutrons, one for epithermal neutrons, and two (having a low and high threshold) for fast neutrons.
The choice of the detectors depends on the sensitivity and on possible errors deriving from parasitic effects.
Activation foils represent the best solution for a detail ed spatial measurements; for thermal and epithermal neutrons there is no serious difficulty and the reactions Dy(n,y ) and Au(n,y) have been used. For fast neutrons there are some li natations and in some cases only detectors with intermediate threshold energy ( ~4 MeV) may give reliable results. This limitation derives from two effects:
-4 measure attenuations beyond 10 .
For these reasons in many cases the fast neutron flux has been measured beyond a given distance only with S(n,p) or P(n,p) detectors, which possess an intermediate threshold energy but are not affected by spurious reactions and have a rather high cross section.
2.1 - The irradiation facility
The irradiation facility is the ETNA lid tank shown in Fig. 1 and 2 and described in detail in previous report
During the course of the experiments the working con ditions were the following:
- source: natural uranium, thickness 2 cn^diameter 90cm - realtor power: (5 + 7)MW
- Materials between source and water: boral slab (1/4")I 19 cm air; 4 cm Al (wall of the tank)
With respect to the previous work ¿\J the reactor power has been increased; however also the core configuration and its distance from the thermal column have been changed, so that the actual source power at 5 Mw is now slightly lower than previously at 2 Mw.
However all the experimental data are always normalized to the same thermal flux impinging on the source, and the-refore to the same source power.
9
and along a radius of the sourcethe thermal flux inside the source can be described by:
cp(r,z) = 2 , 3 · 1 08( 1 - 5 , 6 ° 1 0 ~6r2 - 1,4· 1 0 ~8r4) e ~0' 5 8 5 , Zn / e m2¡
(D
where r and ζ are the radial and axial coordinates in cm and an absolute error of 5$ is estimated.
The mean number of fissions per unit volume in the source is given by:
rRrz
r rn pz ' 7 }
- ^ M c p ( r , z ) r d r d z = ( 2 , 6 5 + 0 , 1 5 ) · 1 θ ' f i s s i o n / c mJ« s (2) nf ,
1
where R=45cm, z' = 2 cm and Σ= 0,20 cm is the mscrosco pic fission cross section for natural uranium.
In the second case whe have used the values of the reac tion rates for Ni(n,p) and Αΐ(η,α) (see below Table I) measured at the input of the water tank.
These values can be calculated by:
R.R. = 2.44·Ν
Jn
f(V)K(?·^) dV.o-(E) (3)
E
2
where :
RR = reaction rate per gram element o(E) = activation cross section
Ν = number of atoms of the isotope in consideration per gram element
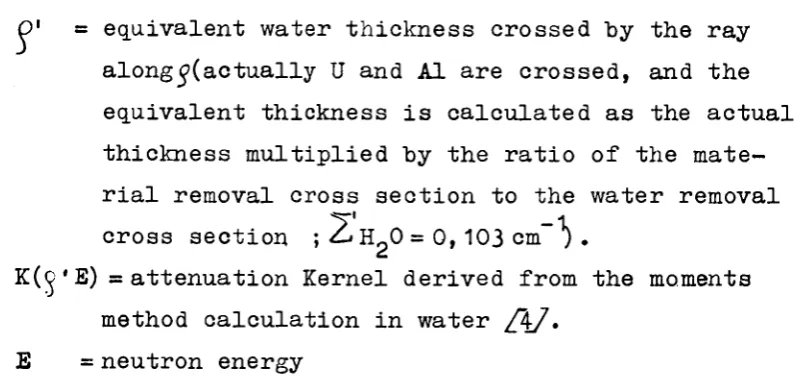
O' = equivalent water thickness crossed by the ray
along ^(actually U and Al are crossed, and the equivalent thickness is calculated as the actual thickness multiplied by the ratio of the mate rial removal cross section to the water removal cross section ; ^ H ^ O = 0, 103 cm" ).
K(c'E) = attenuation Kernel derived from the moments method calculation in water /\/.
E = neutron energy
With the values of Table I it has been deduced that the source must bes
7 λ
nf= (2,9+0,4) · 10 fission/cm s
in good agreement with the previous one. The mean value may therefore be taken as
7 Ì
nf=(2,7 + 0,1) »10 fission/cmJs.
From this the following quantities are deduced:
power per unit volume: 0,87*m watt/cm
totale power: if watt
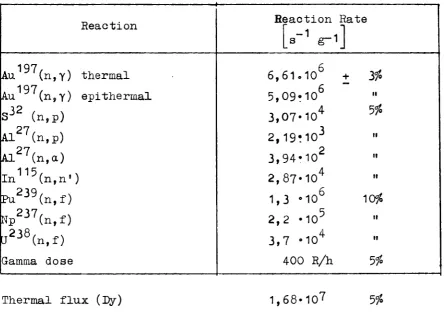
[image:14.595.92.490.105.301.2]The activations (or flux in the case of thermal neutrons) deriving from this source in the tank are shown in Table I and II.
11
Table II refers to measuring points in water (without duct) on the axis of the source as a function of the water distance z.
The neutron spectrum at the input of the tank has a sha pe slightly different from a fission one, due to energy losses in scattering process within the source and Al wall and reflections from walls; the actual shape has been de rived by an analysis of the data of Table I and the result is shown in Fig. 3; this spectrum modification does not seem to have any sensible influence on the attenuation in the ducts and for calculation purposes the spectrum can be considered a fission one.
2.2 - Duct configurations
The duct material is Vedril (C 60$, 0 32$, H 8%) which can be considered equivalent to water as far as the nuclear properties are considered.
During the irradiation the axis of the first section is coincident with the source axis, as shown in Fig. 1.
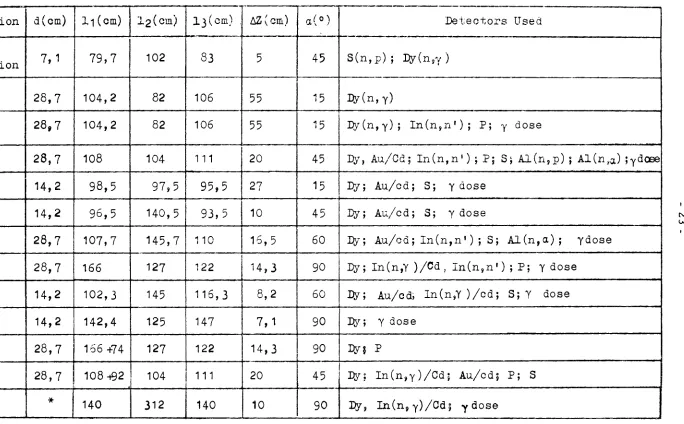
Each configuration is characterized by the inner diame ter, the length of the first, second and third straight section, and the bend angle. Therefore the configuration of Fig. 1 is indicated as (d, 1.., lp, l,;a) where d and 1' are in cm, α in degrees. Also shown in Fig. 1 is the coordinate system used to define the measurement point: ζ is the distance along the axis measured from the mouth. Also shown in Fig. 1 are the coordinates z., z_ and ζ with origin at ζ = 0, z s l + Δζ and ζ = 1? + Δζ, where
each section measured from the intersection with the pre ceeding section. The complete list of the configurations with the geometric parameters and the measurements perfor med is shown in Table III: the first one (T) is a test configuration which does not fit the scheme of the other ones; config. 1a and 1b differ for the thickness of the wall on the mouth which is 2 cm for 1a and 0,30 cm for
1b—f- 10; conf. 9 and 10 are the same as 6 and 2, but with the first leg extendend beyond the bend in order to acquire information on the contributions of different parts of the bend on the reflection. The cylindrical wall thickness is always 0,5 mm and the material composition C 60$, 0 32$, H 8$.
The last configuration (G) refers to the gap around the tank; as shown in Fig. 2 between the aluminum wall of the tank and the concrete shield there is an air gap of 20cm thickness, 3 m wide, which acts as a streaming path in pa-rallel with the duots.
Measurements in this gap have been performed in order to correct for this spurious contribution the data at the end of the ducts.
2.3 - Detectors
The criteria followed for the choice of detectors has already been explained.
A particular difficulty found in this work has been the problem of deteoting in a single experiments activities in a wide range, with lower limits below the background of usual counters.
13
-the size of -the detectors at strong attenuations, and by the use of counters of low background and large sensiti ve volume prepared for the various specific applications
together with other techniques such as burning sulphur pel 32
lets at 370°C for the separation of Ρ activity as descri bed in ref. 5.
Counters of different sensitivity and detectors of dif ferent size have been intercalibrated in order to obtain in each experiment normalized counting rates relative to a standard detector size. The counting rates are then processed according to standard methods to give, when it is necessary, reaction rates (i.e. saturation absolute ac tivities) per gram element or flux.
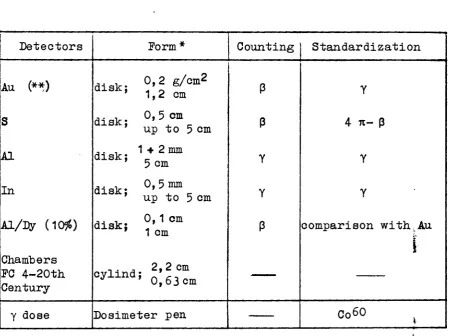
The list of the detectors is shown in Table IV together with the method of counting and of standardization. For most V -ray emitting nuclides the standardization is based on the use of a calibrated detector /δ/. Some of the de tectors have been used only for measuring the flux shape at the mouth, in which case it was considered important to have a large number of reactions for permitting the ana lysis of Fig. 3.
Among these detectors there are the fission chambers coated with Np, Pu. The method used to standardize the
chambers is described in some detail in the Appendix.
3. Results
er-ror arising from statistical uncertainties is reported in Tables and graphs when it is greater than 2$. Vertical lines have been drawn in the figures at z = l. +/lz and l2+4z; it is clearly seen that at these points all the curves giving the flux as a function of ζ show a more or less marked change in slope, corresponding to the loss of total visibility of the preceeding section. A boral or Cd disk, unless otherwise specified, has always been placed at the end of the ducts to reduce the thermal neutron reflection. Also the values mea sured at the end have been corrected for the spurious contri bution deriving from the gap around the tank} this contribu
tion has been measured by irradiating only the last section of a duct as shown in the insert of Fig. 13. In Fig. 13 are also shown the curves of neutron flux and gamma dose attenua tion along the gap or in water near the tank wall (at 3 cm f rom the aluminum wall).
For completeness other results obtained with Cd foils in particular positions are presented in Fig. 14, 15 and 16. In the first two straight Al ducts have been considered, dia meter 30 and 10 cm. All the duct was covered with Cd (thick ness 0,02 cm) with the exception of a cylindrical window extend
ing from ζ-ε to ζ +ε (the actual value of ε ranged from 1 cm to 5 cm according to the value of z) . In Fig. 14 or 15 are shown the following quantities:
- the thermal flux on the axis measured with Dy without any window, this represents the background and is not actually a thermal flux, but rather the epicadmium activation of Dy expressed in thermal flux units
- 15
ground, measured with windows of size specified in the fi gures at various Ζ.
From this experiment a very important quantity is derived, i.e. the thermal neutron current entering the duct walls. The analysis of these data has been performed by assuming a cosine distribution of the current; this is ir. fact confirmed by the agreement of experimental points and a curve giving the flux on the axis with the above hypothesis, at least in the range where experimental errors permit a comparison, as shown in Fig. and 14 and 15. In this case the flux on the axis at Ζ = Zf is given by:
4ε
φ
(Zw)—Γ" -i(z
w)
where a is the duct radius, and i(Z) the current deriving from the unreflected current i°(Z) and the current reflected by the walls.
The reflection is possible only within Ζ.„-ε and Zw + ε
and a simple relationship between i°(Z) and i(Z) is:
1 i(Z) =i°(Z)
1 - α· ε
where for o(, (the albedo) the value 0,8 has been used. The ini tial or unreflected current i°(Z) determined by this method is reported in Tab. XVII.
neutron flux at the end of the duct is deriving for ^60$ from neutrons which enter the bend volume at thermal energies, for ~ßO$ ffcom neutrons which become thermal in the bend. An impor tant consequence of this result is that any calculation which does not take account of energy degradation at the bend will be in error of about a factor 2.
4. Conclusions ,
The reported values of neutron streaming through bent duots represent a detailed, although not complete, serie of data
de-scribing the spatial and energy distribution of flux. The limits of this work are mainly two:
- The sensitivity of detectors or the spurious contributions in some cases do not permit the measurement along all the duct. However this is not very important because from a realistic point of view when the attenuation is very high there is no or little interest in the prediction of the streaming flux. This is the case of high threshold energy detectors whose activity falls off after the bend very ra-pidly with respect to the thermal and epithermal flux, and this means that the contribution of the high energy neutrons to the total dose streaming after the bend is negligible.
- The geometric parameter (duct radius) has not been examined in a wide range. In particular no information has been
- 17
Attempts to correlate the experimental data with a semien-pirical formula have given a very poor agreement and a li-mited range of validity; in particular the Simon-Clifford formula applied to thermal or epithermal neutrons does not fit adequately our results and this is partly due to the approximations in the formula, and partly to the quite dif ferent source conditions. The source in our experiments emits no thermal or epithermal neutrons, and the energy de_ gradation along the duct cannot be neglected, as could be the case for different source spectra. The absence of the direct thermal and epithermal flux from the source permits a comparison with calculations of the energy degradation more significant than previous experiments.
Some details of calculation performed by R. Nicks (Monte Carlo, last collision) have been reported elsewhere; for thermal and epithermal neutron the approach of the problem with the albedo concept is expected to be the most reliable and simple method and results already obtained for straight
Appendix
Calibration of fission chambers
The counting rate C of a fission chamber is given bys
C = ερ F
where F is the fission rate per unit mass of the fissile element, ρ the weight of the fissile element, and £ the probability that a fission event gives a detected count.
For plane fission chambers and very thin coatings ε<* 1, but for cylindrical chambers and rather thick coatings as in our
case ε<Ί, the exact value depending also on the electronic chain. The weight ρ is given by the manufacturer but it can be considered only a nominal value. The problem is therefore to determine the product (ερ).
Pu2 3 9
In this case there is a strong activation cross section in the thermal energy. An irradiation in a known thermal flux gives the value of (ερ) as the ratio C/F^ where
τ, Γ κ- . 6?1°2 3
thc¿*i°i 240
and Φ,, ©Γ are group fluxes and cross section below the cadmium cut off. These have been calculated with removal diffusion
(Sabine) in water and the normalisation to the absolute value has been obtained with gold irradiated around the chamber. Epi
thermal contribution have been subtracted with a second irradia tion with cadmium (cut off 0,5 eV for 2 mm Cd).
At the duct mouth from the measured counting rate we obtain:
- 19
uf£f
The chamber has been irradiated together with a foil of deple_t ed U(350ppm). From the La activity in the foil, corrected for
235
the residual epithermal activity from U , we obtain at the duct mouth F=3,7'104 s g-'' and the ratio C/F assuming a value of
140
0,057 for the Ba yeld. The weight ρ of U in the chamber has been determined in a separate experiment by measuring the
activi-239
ty of U of the chamber and of a standard by the usual methods of activation analysis. From these values one obtains?
e=r
Fp~
=°'
5±
0'
1where the main error is due to the assumptions made in the eva-239
luation of the attenuation of U Ύrays in the chamber walls.
H P2 3 7
The value of ρ has been determined by measuring the activity 233
of Pa of the chamber. We have used the value of 0,44 for the intensity of the 0,313 MeV γ line of Pa2 3 3 (UCRL 8642).
For ε the value 0,5+0,1 previously found for U has been adopted.
From the measured counting rate it results at the duct mouth:
References
[\J Β. Chinaglia, D. Monti "Studio delle irregolarità nelle
schermature" Rapporto finale SORIN F/326 (1964)
/ 2 / B. Chinaglia, G. Bosio, D. Monti "Studio della propagazione neutronica in condotti tubolari con 2 gomiti"
Rapporti F/414, F/433, F/455, F/478, F/508, F/510, F/515, F/526 (1966+ 1968)
/ 3 / U. Canali, B. Chinaglia, D. Monti, R. Nicks "Neutron propå gation through cylindrical ducts" AERE R/5773, p. 657
(1968)
/ 4 / D.K. Trubey ORNI 3487 (1964)
/§/ D.C. Santry, J.P. Butler Can. J. of Chemistry, _£!, n. 1,
P. 123, (1963)
ß>J B. Chinaglia, R. Malvano Nucl. Instr. & Methods 4J?, p. 125,
21
[image:25.595.79.524.223.535.2]-TABLE I
Reaction rates per gram element and gamma flux measured at the mouth of a duct of 30 cm diameter, (a)
1
Reaction
Αα197(η,γ) Au197(n,Y) S3 2 (n,p) Al27(n,p) Al27(n,a) In115(n,n'. Pu239(n,f) Np237(n,f) a238(n,f) Gamma dose
thermal epithermal
)
1
Reaction Rate
_s~
g-1J
6,61.106 + 3$
5,09·106 "
4 5$ 3,Ο7·10*
2,19·103 "
3,94·102
2,87·104 "
1,3 β106 10$
2,2 ·105 "
3,7 ·104
400 R/h 5$
Thermal flux (Dy) 1,68·107
(a) Actually the mouth value is measured at»
Ζ = (0*0,1) cm for Dy, Au, In Z a 0,2 cm for Al
Ζ = 0,5 cm for PS
TABLE I I
R e a c t i o n r a t e s p e r gram e l e m e n t o r f l u x i n p l a i n w a t e r ( w i t h o u t the d u c t s ) , a s a f u n c t i o n of w a t e r t h i c k n e s s Z .
Ζ (cm) 0 4 8 12 16 20 24 28 32 36 40 44 48 52 56 60 54 68 70 72 74
N i ( n , p )
2 . 0 2 . 1 04
8 . 8 - 1 03
4 . 5 " 2 . 3 5 "
1.25 "
6 . 7 ? 1 02
3 . 8 " 2 . 0 2 "
1.13 "
6 . 8 . 1 01
3 . 9 " 2 „39 " 1.39 " 8 . 3 - 1 0 °
5.0 !'
2 . 9 u
1.75 " 1.02 »
8 . 0 " 1 0 "1
I n ( n , n ' )
1.4 - 1 04
4 . 6 · 1 03
2.15 " 1.02 "
5 . 2 5 · 1 02
2 . 7 5 " 1.48 "
8.2 · 1 01
4 . 5 2 ·· 2.59 " 1.52 " 8.7 ' 1 0 ° 5.3 " 3-2 "
1.9 " 1.15 "
Au/Cd
1 . 1 2 · 1 θ 7
1.22 "
5 . 4 5 Ί 06
1.98 "
8 . 0 · 1 05
3 . 5 2 "
1.63 "
8 . 2 · 1 04
4 . 1 " 2 . 0 8 "
1.1 "
6 . 2 · 1 03
3 . 5 " 2 . 0 "
1.13 "
6 . 5 · 1 02
3 . ο 8 " 2 . 1 5 " 1.57 "
Thermal F l u x
1.68-10? 8 . 2 " 5 . 8 " 2 . 8
1.3 "
5 . 8 - 1 06
2 . 6 ·· 1.19 "
5 . 7 5 Ί 05
2 . 9 " 1.58 "
8 . 4 5 Ί 04
4 . 5 " 2 . 4 "
1.38 »
7 . 9 Ί Ο3
4 . 6 sí
2 . 6 4 " 2 . 0 3 IS
TABLE III List of the examined duct configurations
Configuration
Test configuration
1 a 1 b
2 3 4 5 6 7 8 9 10 G d (cm) 7,1 28,7 28,7 28,7 14,2 H,2 28,7 28,7 14,2 14,2 28,7 28,7 ll(cm) 79,7 104,2 104,2 108 98,5 96,5 107,7 166 102,3 142,4 166+74 108»92
* 140
Í2(cm) 102 82 82 104 97,5 140,5 145,7 127 145 125 127 104 312 l3(cm) . 83 106 106 111 95,5 93,5 110 122 116,3 147 122 111 140 AZ(cm) 5 55 55 20 27 10 15,5 H,3 8,2 7,1 14,3 20 10 a(°) 45 15 15 45 15 45 60 90 60 90 90 45 90 Detectors Used
S(n,p) ; Dy(n,v )
Dy(n,y)
Dy(n,y); Ιη(η,η'); Ρ; γ dose
Dy, Au/Cd; Ιη(η,η') ; Ρ; S; Al (η, ρ) ; Al (η,a) îydose Dy; Au/cd; S; γ dose
Dy; Au/cd; S; γ dose
Dy; Au/cd;Ιη(η,η'); S; Al(η,α); ydose Dy; Ιη(η,γ )/Cd, ΐη(η,η') ; Ρ? γ dose
Dy; Au/cd, Ιη(η,γ )/cd; S; γ dose
Dy; Ύ dose
Dy? Ρ
Dy; In(n,y)/Cd; Au/cd; P; S
Dy9 In(n, γ)/0α; γ dose
ro u>
TABLE IV List of detectors
Detectors
Au (**)
S
Al
In
Al/Dy (IO96)
Chambers FC 420th Century
γ dose
Form*
disk; ° i « {
0 m 21,2 cm disk; °'5+cm
up to 5 cm ,, , 1 + 2 mm disk;
5 cm ,. , 0, 5 mm
disk; ' , _
' up to 5 cm
disk, ? '
1 c m' 1 cm
_. , 2,2 cm cylind; _ ¿.,
J 0,63 cm
Dosimeter pen
Counting
β
ß
γ
Y
ß
— — — — — — — — — — — Standardization
γ
4 π β
Υ
γ
comparison with Au
I
σ
06°
* For disks i first number thickness seoond number diameter For cylinder: first number length
second number diameter
(**) Correction factor used for flux depression: thermal 0,9
25
TABLE V - Test configuration (7.1; 79.7; 102; 83; 45°)
Ζ (cm)
0 38 82 134 184
*F(Z) S(n,p)
1
2 , 3 / - 2 1,72/-3 1 , 3 5 / 4
W-5
ε?δ
8
5 6
F(Z) Dy(n,y)
1
3,23/-3
4,04/-4
5,65/-6
1,45/-6
ε?δ
5 25
*F(Z) « ratio between activation measured at Ζ and at the mouth (Z <= o) in Tables V to XVI.'
TABLE VI - Configuration 1a*) (28,7; 104,2; 82; 106; 55; 15°)
Ζ (cm)
0
30,2 60,5 80,8 101,8 111,8 135,7 160,7 177,3 190,3 220,6 251,1 271,6 292,0
F (Ζ) Dy (η,γ)
1
0,620 0,310 0,193 0,124 0,105 0,062 0,037 0,026 0,020 0,012 0,008 0,006 0,0068
-TABLE VIII - (28,7; 108; 104; 111; 20; 45°) I Ζ (cm) 0 10 20 30 40 50 70 80 90 100 110 120 130 140 150 160 170 180 F(Z) Dy(n,y) _ _ _ _ — — 1 1 — — — 4,79/-1 2,90/-1 — — 1,60/-1 1,39/-1 1,20/-1 — — —
4 , 0 / -2
—
2,50/-2
& F(Z)
Κη,η')
1
: 7,45/-1
I i I — 1,04/-1 5,40/-2 — — —
2 , 0 / -2 1,85/-2 — — 1,05/-3 4, 50/-4 — 1,90/-4 zio 1 2 15 20 30 F(Z) P(n,p) 1 7,22/-1 — 2,53/-1 — 1,10/-1 5,25/-2 4 , 0 / -2
—
2, 40/-2 2 , 0 / -2
1, 80/-2 1,10/-2 — — 3,20/-4 1,60/-4 1,0/ -4 ego 4 5 10 15
F(Z) r-af
S(n,p) 1 7,22/-1 — 2,53/-1 1,60/-1 1,10/-1 5,25/-2 4 , 0 / -2
—
—
2 , 0 / -2 1,80/-2 1,10/-2
—
7 , 0 / -4 3,20/-4 1,60/-4 1 , 0 / - 4
F ( Z ) _ Au/cd 1 7,30/-1 — 4,50/-1 3, 44/-1 2,50/-1 1.32/-1 — — —
4 , 5 0 / - 2 3, 70/-2 — — 1, 50/-2 — 5, 50/-3 — Zfo 2 2 F(Z)__ Al(n,p) 1 — 4,50/-1 3, 10/-1 2,10/-1 1,50/-1 7, 80/-2 — — 3,75/-2 3,40/-2 3,30/-2 — — — 5,40/-4 — — Zfo 5 10 15 20 I F(Z) Αΐ(η,α) 1 — 4,50/-1 3,10/-1 2,10/-1 1,50/-1 8,30/-2 — —
4 , 2 5 / - 2 3.70/-2 3,40/-2
—
3 , 0 / - 3 1,0/ - 3
—
2,50/-4
1
ρ of
zf° 3 5 5 20 20 30 30 F(Z) dose Y 1 — —
4 , 9 0 / - 1 3,80/-1 — — 1.35/-1 — —
9 , 0 / -2
—
—
9 , 5 0 / - 3
—
—
ε $
3
[image:31.842.206.769.102.543.2]190 200 210 230 232 250 260 270 280 300 320
D y ( n , y ) 1 . 9 5 / - 2
—
1 , 2 l / - 2 8, 5 0 / - 3
—
4 , 3 0 / - 3
—
2 , 3 0 / - 3
—
1 , 0 / - 3
—
é>
1
2
Κ η , η » )
—
—
1 , 1 0 / - 4 2 , 8 0 / - 5
— — — — — — — ε * 30 50
P ( n , p ) 7 , 0 / - 5 5 , 5 0 / - 5 4 , 6 0 / - 5
— — — — — — — —
ε£
15 15 15S ( n , p ) 7 , 0 / - 5 5 , 5 0 / - 5 4 , 6 0 / - 5 4 , 1 0 / - 5 3 , 9 0 / - 5
— — — — — — Zfo Au/cd 2 , 9 0 / - 3
—
1 . 7 0 / - 3 1 , 0 / - 3 9 , 5 0 / - 4
—
2 , 3 0 / - 4
—
1 , 1 5 / - 4
—
5 , 0 / - 5 ε # 2 2 2 3 3 4 4
A l ( n , p )
—
1 , 2 0 / - 4
— — — — — — — — —
S
50A l ( n , a)
—
1 , 0 / - 4
— — — — — — — — —
é>
50d o s e γ
—_
—
2 , 7 0 / - 3
—
—
—
—
—
6 , 9 5 / - 4
—
3 . 7 0 / - 4
[image:32.842.34.785.143.511.2]29
-TABLE IX - ( 1 4 , 2 ; 9 8 , 5 ; 9 7 , 5 ; 9 5 , 5 ; 2 7 ; 15°)
Ζ (cm) 0 10 20 30 40 50 60 70 80 90 100 110 120 130 140 150 160 170 180 190 200 210 220 223,5 230 P(Z) Dy(n,y) 1 9,0/-1 5,90/-1 3,50/-1 2,20/-1 2,37/-1 9.20/-2
5590/-2
3,95/-2 "2,70/-2 1, 85/-2 1,30/-2 9,0/-3 6,20/-3 4,15/-3 2,70/-3 1,82/-3 1,27/-3 8,80/-4 6,10/-4 4,40/-4 3,15/-4 2,30/-4 2,0/-4 1,59/-4
S
2 2 2 3 F(Z) Au/cd 1 — 3,50/-1 — — — 3,60/-2 — 1,63/-2 — 8,50/-3 6,30/-3 4,45/-3 — 1,90/-3 — 7,0/-4 — 3,26/-4 2,30/-4 1,68/-4 1,23/-4 1,0/-4 9,46/-5 8,0/-5z?'
2 3 3 3 5 5 5 F(Z) S(n,p) 1 — 2,36/-1 — — — 2,40/-2 — — — 8,0/-3 6,80/-3 4,90/-3 3,10/-3 1,50/-3 6,50/-4 3,30/-4 — 1,26/-4 9.50/-5 8,40/-5 7, 60/-5 7, 50/-5 7, 20/-5 —ζ f»
Table IX (follows)
Ζ (cm)
240 250 260 270 280 290
F(Z) D y ( n , y )
1 , 1 0 / - 4 7 , 0 / - 5 4 , 9 / - 5 3, 55/·-5 2 , 9 0 / - 5 2 , 5 0 / - 5
ι
Zio
3 3 5 5 5 5
F(Z) Au/cd
5, 3 0 / - 5 2 , 6 5 / - 5
1 , 5 0 / - 5
—
7 , 1 0 / - 6 5 , 8 5 / - 6
Zfo
5 5 5
6
F(Z) S ( n , p )
6 , 7 0 / - 5
— —
—
—
3 , 3 9 / - 6 ε/ο
10
30
F(Z) Dose γ
—
1 , 2 0 / - 3
— —
—
5 , 9 0 / - 4
Z°Jo
2
31
-TABLE Χ - ( 1 4 , 2 ; 9 6 , 5 ; 1 4 0 , 5 ; 93,5? 10; 45°)
Ζ (cm)
0 10 20 30 40 60 70 80 90 100 110 120 130 140 150 160 170 180 190 200 210 220 230 240 250 11 F(Z) Dy(n,v) 1 9,50/1 — 4,0/1 .— 9,50/2 6,40/2 4,30/2 3,0/ 2 — 1,35/2 7, 50/3 4,40/3 2,60/3 1,60/~3 1,0/3 6, 50/4 4,46/4 2,90/4 2,10/4 1,50/4 1.18/4 9,50/5 8.10/5 3,70/5 ZÌO 1 2 2 2 4 4 4 4 5 F(Z) Au/cd 1 — 3,40/1 — 1,05/1 3,60/2 — 1,50/2 — 8,0/3 — 1,70/3 — 3,0/4 1,80/4 .— 8,50/5 6,30/5 — 3,45/5 — __ — 1,20/5 —
ε io
1 2 2 3 6 6 8 F(Z) S(n,p) 1 — 2,30/1 — 5,70/2 2,22/2 — 1,15/2 — 7,40/3 — 2,20/4 — 2,85/5 — — 9,0/6 6,60/6 — 4,10/6 — — — 2,19/6 Zio 2 8 8 8 10 20 F(Z) dosey 1 — — — 2,45/1 — — — 7,0/2 6,0/2 — 1,28/2 — — 4,30/3 — — — 1,10/3 — — 4,0/4 2,80/4 — —
ε io
Table X (follows)
Ζ (cm)
260
270
280
290
300
310
320
330
F(Z) Dy(n,Y)
| ,, ,
1.20/-5 7,60/-6
— 3.40/-6 2.30/-6 1.68/-6 1,20/-6
ε*
8
10
20
15
20
30
F(Z) Au/cd
2.90/-6 — 1,40/-6
— — —
7, 50/-7 —
ε*
10
30
50
F(Z) S(n,p)
M*«M
— — — — —
5,60/-7 —
l$>
30
F(Z) dose γ
1,27/-4 9,80/-5
— 6,0/-5 4,90/-5 4.0/-5
——
2, 80/-5
ε#
5
8
8
8
10
TABLE XI - (28,7; 107,7; 145,7; 110; 16,5; 60°) Ζ (cm) 0 10 20 30 40 50 60 70 80 90 100 110 120 123,5 130 140 150 170 180 190 F(Z)
Dy(n,Y)
1 1
6 , 9 0 / - 1
—
—
3 , 6 0 / - 1
—
2 . 3 0 / - 1
—
1 , 5 0 / - 1 1 . 2 2 / - 1 1 , 0 3 / - 1 9 , 5 0 / - 2 8, 3 0 / - 2 6 , 1 5 / - 2 4 , 6 6 / - 2 2 , 5 8 / - 2
—
1 , 5 5 / - 2
ε 36 Ι η ( η , η ' ) F(Z)
1 —— — — 1,10/-1 — — — — 2,73/-2 2 , 3 5 / - 2 1,99/-2 1,22/-2 3, 40/-3 — _ _ — — 7,10/-5 Zio 25 F(Z) Au/cd 1 5.90/-1 — — 2,20/-1 — — 8,95/-2 — 5,20/-2 4 , 2 0 / - 2 3,50/-2 3,20/-2 2,10/-2 1,30/-2 — —
2 , 9 0 / - 3 2 , l 8 / - 3
ε io
1
F(Z) S(n,p)
1
4 , 3 0 / - 1
— — 1,10/-1 — — 4,40/-2 — 2, 73/-2 2 , 3 5 / - 2
1,99/-2 1,22/-2 3 , 4 0 / - 3 8, 50/-4 3, 40/-4
—
7 , 5 0 / - 5 5,49/-5
zi
3 3 5 10 10 F(Z) Αΐ(η,α) 1 — — — 1,50/-1 1,05/-1 7,60/-2 —4 , 4 9 / - 2
—
3,20/-2 2 , 7 0 / - 2 2 , 4 3 / - 2 4 , 2 3 / - 3 6,40/-4 1,80/-4
—
—
—
ε
i
2 3 5 10 30 40 F(Z) Dose γ 1 —
4 , 9 0 / - 1 3.95/-1 — — — 1,76/-1 — 1.22/-1 1,05/-1 9,10/-2 8 , 0 / - 2
—
2 , 1 0 / - 2
—
7, 50/-3 5,65/-3
—
[image:37.842.127.718.95.562.2]Ζ (cm) 200 210 220 230 240 250 260 270 280 290 300 310 320 330 340 350 360 F(Z) Dy ( η , γ )
1 , 2 0 / - 2 9 . 5 0 / - 3 7 , 8 0 / - 3
—
5 , 0 / - 3 4 , 3 0 / - 3 3 . 5 0 / - 3 2 , 7 0 / - 3 1 . 9 8 / - 3 1 , 4 0 / - 3 1 , 0 3 / - 3 8 , 0 / - 4 6 , 4 5 / - 4 5 , 2 0 / - 4 4 , 4 8 / - 4 3 , 8 0 / - 4 3 . 4 0 / - 4
ε # 1 1 1 1 2 2 F(Z) I n ( n , n ' )
—
—
—
2 , 8 5 / - 5
— —
1 . 7 5 / - 5 1 , 4 0 / - 5 1 , 1 0 / - 5
— — — — — — — i ZÌO 30 40 40 50 F(Z) A u / c d
——
1 , 2 0 / - 3 9 . 5 0 / - 4
—
—
4 , 7 5 / - 4
—
3 . 2 0 / - 4
—
7 , 3 0 / - 5
—
3 , 1 0 / - 5
—
1 , 5 5 / - 5 1 , 1 9 / - 5
—
8 , 3 0 / - 6
j ε * 2 2 4 4 6 10 15 15 15 F(Z) S ( n , p )
—
3 , 0 / - 5 2 , 3 5 / - 5
— —
1 , 2 5 / - 5
—
1 , 1 9 / - 5
—
5 , 0 / - 6 2 , 9 0 / - 6 1 , 9 0 / - 6
— — — — — Zi 10 10 15 15 20 35 35 F(Z) Α Ι ( η , α )
_ _ — — — — — — — — — — — — — — — —
Zi F(Z)
d o s e y
3 . 2 0 / - 3
—
1 . 8 8 / - 3 1 , 4 3 / - 3
—
8 , 9 0 / - 4
—
5 , 4 5 / - 4
—
—
2 , 1 0 / - 4 1 , 6 0 / - 4
—
1 , 1 0 / - 4
—
—
8 , 4 9 / - 5
TABLE XII - ( 2 8 , 7 ; 166; 127; 122; 1 4 , 3 ; 90°) Ζ (cm) 0 10 20 30 40 50 60 70 80 90 100 110 120 130 140 · 150 160 170 180 F(Z) Dy(η, γ) 1 1
8 , 9 / - 1 7 , 4 / - 1 6 , 0 / - 1 4 , 8 0 / - 1 3 , 6 0 / - 1
2 , 2 5 / - 1
—
1 . 5 0 / - 1 1 , 2 0 / - 1 1 , 0 / - 1 8 , 5 0 / - 2 6 , 9 5 / - 2 5 , 8 0 / - 2 4 , 9 5 / - 2 4 , 6 0 / - 2 3 , 9 0 / - 2
Zio Ι η ( η , γ ) F(Z)
1
—
6 , 1 3 / - 1
—
—
2 , 1 4 / - 1
—
9 , 3 0 / - 2
—
5 , 4 5 / - 2
—
3 , 4 2 / - 2
—
2 , 4 0 / - 1
—
1 , 7 ΐ / - 2
~ ~
—
ε io I n ( n , nF(Z) c)
1
—
—
—
1 , 6 2 / - 1
—
—
3 , 8 0 / - 2
—
—
—
1 , 8 0 / - 2
—
—
—
1 , 1 0 / - 2
- _
6, 8 0 / - 3
zio 2 3 3 4 5
- i í « i _
P ( nyp )
1
—
—
2 , 5 0 / - 1
—
—
7 , 5 0 / - 2
—
—
—
—
1, 8 0 / - 2
—
—
—
1 . 1 4 / - 2
.—
4 , 4 0 / - 3
ε / ο
5
10
F(Z) dose Y
1
—
—
—
3 , 7 / - 1
—
—
_ _
1 , 5 0 / - 1
—
—
9, 5 0 / - 2
—
7 , 7 0 / - 2 6 , 9 5 / - 2 6 , 2 0 / - 2 5 . 9 0 / - 2 3 , 7 9 / - 2
zi
190 200 210 220 230 240 250 260 270 280 290 300 310 320 330 340 350 360 370 380
Dydvy)
2 , 6 0 / - 2
1,85/-2
1.35/-2
1.03/-2
8 , 0 / - 3
6 , 2 0 / - 3 4 , 9 6 / - 3
3 . 9 0 / - 3
3 , 0 6 / - 3
2 , 5 0 / - 3
1 , 9 5 / - 3
—
1 , 3 0 / - 3
9 , 0 / - 4
6 , 2 0 / - 4
4 , 5 0 / - 4
3 , 4 0 / - 4
2 , 6 3 / - 4
2 , 1 0 / - 4
1,68/-4
zio
1,5
Ιη(η,γ)
4 , l 8 / - 3
—
1 · 7 1 / - 3
— —
6 , 4 3 / - 4 4 , 8 2 / - 4
— —
2 , 1 4 / - 4
—
—
5 , 5 0 / - 5
2 , 9 0 / - 5
—
—
8 , 9 5 / - 6
— — ~ Zi 2 3 4
I n ( nrn ' )
2 , 5 0 / - 4
8, 5 / - 5
— — — — — — — — — — — — — — — — — — ZÌO 10 30
P ( n , p )
3 , 3 0 / - 4
1,10/-4
5 , 5 0 / - 5
—
2 , 0 8 / - 5
1,40/-5
1 , 0 / - 5
— — — — — — — — — — — — — Zi 20 20 20 100 100 100 dose Y —,
5 , 9 0 / - 3
4 , 1 0 / - 3
—
—
1 , 6 5 / - 3
—
—
6 , 7 0 / - 4
—
3 , 6 0 / - 4
—
2 , 5 9 / - 4
— — — 1,15/-4 — —
Table XII (follows)
Ζ (cm)
390 400 410 420
F(Z) Dy(n,Y )
1,40/-4 1,20/-4 1,10/-4 1 , 0 / - 4
zi>
1,5 1,5 1,5 1,5
F(Z) Ι η ( η / γ )
3, 85/-6
—
—
2 , 4 5 / - 6
zi
6
5
F(Z) I n ( n , n ' )
_ _
—
— —
zi
P(n,p) F(Z)——
— —
—
zi
F(Z)dose γ
—
—
3 , 6 5 / - 5 3 , 4 / - 5
zi
5 5
Ζ (cm) 0 20 30 40 50 60 70 80 90 100 110 120 130 140 150 160 170 180 190 Dy(n,y) 1 6,0/-1 — 2,50/-1 — 1,0/-1 — 4,30/-2 3,0/-2 2,20/-2 1,65/-2 9,0/-3 5,0/-3 2,9/-3 1,78/-3 1,10/-3 7,0/-4 4,48/-4 2,85/-4
zi
Ιη(η,γ) [image:42.842.212.741.74.528.2]Table XEII (follows) Ζ (cm) 200 210 220 230 240 250 260 270 280 290 300 310 320 330 340 350 360 370 F(Z) Ly(η,γ) 2,0/-4 1,40/-4 1.0/-4 7,60/-5 6,0/-5 — 3,50/-5 1,80/-5 9,5/-6 5,5/-6 3,40/-6 2,20/-6 1,53/-6 — 8,15/-7 6,48/-7 5,0/-7 4,0/-7
zi
1 2 3 3 5 10 20 20 20 40 50 60 60 F(Z) Ιη(η,γ) __ — 1,70/-5 — 1,06/-5 — 3,60/-6 1,60/-6 — 6,20/-7 4,45/-7 — 2,63/-7 — — — 1,40/-7 __zi
5 10 20 20 20 20 20 100 F(Z) Au/cd 3,0/-5 — 1,70/-5 — 1,06/-5 9.0/-6 3,60/-6 — — — — — — — — — — —zi
15 20 25 20 20 F(Z) Sin,ρ) __ — — — — — — — — — — — — — — — — —zi
dose γ F(Z) [image:43.842.162.689.103.544.2]TABLE XIV - ( 1 4 , 2 ; 1 4 2 , 4 } 1 2 5 ; 147? 7 , 1 ; 90«>) Ζ (cm) 0 20 40 70 90 110 140 150 160 170 180 190 200 210 220 230 240 250 260 270 280 290 310 330 390 410 F(Z)
9Κη,γ)
16,30/-1
2,50/-1
6,20/-2
2,77/-2
1,4/-2
6,50/-3
4.30/-3
2,20/-3
1,27/-3
7,50/-4
4,50/-4
2,87/-4
1,83/-4
1,20/-4
7.60/-5
5 , 0 / - 5
3,67/-5
3 , 0 / - 5
2,70/-5
1,30/-5
6,70/-6
2,10/-6
9,50/-7
1,45/-7
7,60/-8
zi
3 3 4 5 6 8 8 5 15 15 15 20 50 100F(Z)
dose γ
1 — —1,02/-1
—4,20/-2
2,40/-2
1,30/-2
4 , 0 / - 3
- 41
TABLE XV - ( 2 8 , 7 ; 1 6 6 + 7 4 ; 127; 122; 1 4 , 3 ; 90°)
Ζ (cm)
29 3 0 , 2 5 0 , 5 5 9 , 5 81 1 0 1 , 8 108 125 132 149 ' 164 165 176 184 199 194 204 215 226 240 247 181
F(Z)
Dy(n,Y )
zi
·
7 . 1 7 / - 1 4 , 7 5 / - 1
—
2 , 3 5 / - 1 1 , 4 6 / - 1 1 . 2 6 / - 1
« ■
7 , 8 2 / - 2 5 , 3 5 / - 2 3 , 6 3 / - 2
—
2 , 6 2 / - 2
—
2 , 1 2 / - 2
—
—
—
—
1 . 5 6 / - 2
—
2 , 3 9 / - 2
»
F(Z)
P(n,p)
2.87/-1
—
—
7, 50/-2
—
—
—
1,75/-2
—
—
—
1,00/-2
—
1,03/-3
—
1,36/-4
5,40/-5
2 , 8 0 / - 5
2 , 2 0 / - 5
—
6,40/-6
—
zi
1
2
2
4
5 10 20 20
Table XV (follows)
Ζ (cm)
191 202 212 223 234 244 255 266 276 291 306 323 335 349 356 364 372 381 389 397 406 415
F (Ζ) Dy(n, γ)
1,60/-2 1.16/-2 8, 4 2 / - 3 6 , 2 7 / - 3 4 , 7 6 / - 3 3 , 7 9 / - 3 2 , 9 7 / - 3 2 , 2 2 / - 3 1,83/-3 1,36/-3 1,05/-3 5 , 2 5 / - 4 3 , 5 8 / - 4 2 , 5 6 / - 4 2 , 0 2 / - 4 1,66/-4 1.36/-4 1,16/-4 9 , 7 5 / - 5 8 , 5 5 / - 5 7 , 9 6 / - 5 7 , 2 ΐ / - 5
zi
1 1 2 2 2 2 2 2 2 2 2 2 2 2
F(Z)
Ρ ( η , ρ )
_ _
—
—
—
—
—
—
—
— —
—
—
— —
—
—
—
—
—
—
—
—
TABLE XVI - ( 2 8 , 7 ; 108 + 9 2 ; 104; 1 1 1 ; 2 0 ; 45°)
Ζ (cm)
0 10,2 10,4 1 0 , 8 2 0 , 1
2 9 , 3 3 0 , 3 3 0 , 5 3 0 , 9 4 9 , 5 5 0 , 5 5 1 , 3 6 9 , 6 7 0 , 9 7 1 , 3 80 81 102 112
F(Z) Dy ( η , γ)
1 1,04 — — — — — — — — — — —
3 , 0 8 / - 1
„ _
_ _
_ _
1 , 3 6 / - 1
„ _
zi
Ι η ( η , γ ) F(Z)1
—
—
—
6 , 3 / - 1
—
4 , 5 / - 1
—
—
—
2 , 4 2 / - 1
—
—
—
—
—
1 , 0 5 / - 1 5 , 7 5 / - 2
-.«
zi
2 2 2 1 1 F(Z) Au/cd 1 —8 . 9 2 / - 1
—
—
—
—
4 , 6 / - 1
—
—
—
2 , 3 4 / - 1
—
1 , 3 2 / - 1
—
—
«._
5 , 5 / - 2
„ „
zi
Ρ ( η , ρ ) F(Z)1
—
—
—
—
2 , 7 5 / - 1
—
—
—
1,1 / - 1
—
—
5 , 3 2 / - 2
—
—
4 , 2 / - 2
~ _
_ „
1 , 9 8 / - 2
zi
1
1
F(Z) S ( n , p )
1
—
—
7 , 1 4 / - 1
—
— —
—
2 , 4 8 / - 1
—
— —
—
—
5 , 2 / - 2
Ζ (cm) 113 118 122 123 125 126 133 134 143 150 157 158 159 160 163 165 167 175 176 Dy(n,Y) —
9 , 2 2 / - 2
—
—
7 , 5 9 / - 2
—
6 , 1 5 / - 2
—
—
3 , 9 8 / - 2
—
—
—
—
5 , 1 9 / - 2 *
_ _
_ „
2 , l 8 / - 2
—.
zi
Ι η ( η , γ )—
3,66/-2
— — —2,72/-2
— —1,24/-2
—1,88/-2*
—7,1 / - 3
—
„ _
„ _
~ „
_ „
4 , 3 / - 3
zi
1 1 1 1 2 2Au/cd
4 , 2 l / - 2
—
2,87/-2
— — —1,73/-2
— —8,74/-3
— —1, S6/-2*
— „ _ —5,02/-3
_ _ - =zi
P(n,p)
_ _ —
1,88/-2
— — —7,1 / - 3
—
—
—
—
3 , 7 / - 4
—
—
—
2, 1 / - 4
_._ _ ~ _ =
zi
1 2 10 10S(n,p)
2,02/-2
— —1, 72/-2
**aa4 , 8 / - 3
—
4 , 7 / - 4
Ζ (cm)
260
272
281
288
300
301
320
Dy(n, γ)
_ _
2.08/3 —
—
1,08/3 —
—
ZÌO F(Z)
Ιη(η,γ)
2,4/4 —
1,23/4
—
—
7,2/5
—
ε
i
3
4
5
F(Z) Au/cd
—_
—
—
8,4/5 —
—
3,9/5 e*
4
8
P(n,p)
__
—
—
—
—
—
—
zi
S(n,p)
_ _
—
—
5,0/7 —
—
3,0/7
zi
50
50
Φ o
47
TABLE XVII
Unreflected thermal neutron current j°(Z) entering the cylindri
cal wall of a straight duct; wall material: aluminum; duct r a d i u s : a .
a = S Ζ
(cm)
1,4
3
5
11
32
62
102
202
278
ι cm
õ°(z)
(n/cm2s)
2, 86/6 4,3/6 3,26/6 1,83/6 9,7/4
1,0/4 1,33/3 1, 40/2 8,1/1
a = 15 ζ
(cm)
5
34
50
95
125
185
270
cm
(n/cm's)
THERMAL
COLUMN"
1
ω
cr
—I
<
or
o
m
cr
u
ί
ο:
LU >
O
υ
—I
<
cr
o
m
'<:
γ
2 < I—
<
4^ 00
Fig. 1 - Configuration of ETNA irradiation facility-showing a duct during irradiation (not to scale), with the geometric parameters d,
49
SOURCE
Axis of Source
Concrete
SCALE 1-20
cm
Lu
Φ
«H-4
O
3
ω o
O Φ
ω
Φ
o
cl-hi
Ρ Β
10
5
-ιο"24
10
5
-2
10"
o
+ o
o
+ o
+
Δ Δ Â Δ Δ +
+ ETNA-SPECTRUM
o WATT-SPECTRUM Ν (E) = 0.453 sh V2~29Ë ■ e °9 6 5
Δ ETNA WATT
o
Δ Δ Δ Δ
ο
+
ο 4
Ο
+
— Γ -1 0
—ι—
12
—τ—
13
Ε — τ
-•10'
- 5
f 2
-I0g
- 5
-10"
MeV 10" 15
51
1 O « . ; I ι ; r— 1 , , — - , 1
β b
I
1Õ1 b 6 4 2 io"2 i 6 42
-3 10 t ! 6 2 io"A ( ....
=Ηψ
\ . :::::::: —;— " : — —— ':}.: ::■: :;.+.
: : ■ · ;1 J ...
. .
'
■ ■
■ l· ■ ■ ■ ....¡— [.__| : · —r— ■ i • . :
j
L 4 _
~~ΤΓ
! ■ ■
_: "
.
| ; . '
:::ί::·ρ:·::
— —
-■ i :' ¡ : : ■ :
— -
---^—
—
— t —
i . '· ! , ¡ ! '
: I
S ^ . 1"> Ä
—:— . ....:..!.. : . : ... :
! ".:! :::[:: i::
■:····; : ■ 1 ; | 1 ; ^ —!— .::|.::. ,,,,:l , ■ '¡ '■ Fiy i .1 ——
L.;_..
m^
--±±1I ...
!
:¡ '
z-r—
■
'I ^ , : 1
4''
■ '.':{■ • '■ ''::[:! !Φ
.1 . : ■ —— 104 β 6 2 ,ο· 8 6 2 IO* θ 6 2 10' 8 6 2) 50 100 150 200 250 . . _ 300
ziem.) ■ Pig. 4 Thermal activation rates in configuration 1a
1 < β
f*· o
>
Lá
! β
6 2 2 10 s e
2
8 6 4 2 -ί. 10 (
ι. ι /
luik : , y — | . ¡ —!— : —|— : " : ' ■ • ■ i % \ ■ . . . .
r sv
— t —
f ■■
Χν i ^ * w
:
ί '
— ι — ι
—.—1
i ι :
—i—f—■—r—1—
: |:::: ■ · | ~ :'::!'::: ' ! ::.:|:..
^ ^ 5
.,„,, ■—i— ;... "Ι"'-:.| :. .
¡ ' " " i - i j j y ^
" ^ ^ ν , ¡ : ! : ¡
Χ' '
Γ**-*,
, ! 1 - Ι — ! — — —
: ! : Ι ! |
| ! '■"■>'■ , _ — ί Cv S«] ¡
—-— i — ι —
^ Ο ν < :
ι "*^■-^5: ! Ι : Ι Τ"-1
: Ι {"'■
ί Ι '! — Ι — 1 — ; —
; Ι: ;■; ■
: Ι '
Ι ι.
Τ '
1
ι
: : ■ " - :
■
Ι : |
Ι i U
-,—ι—|—ί—\—ί—
ι : J ; ■ • : ι :
Δ Π ν
«»ί ify;
o i n
·:Ρ ·:
D D
¡
Jl \
ι ι . [ Τ*1
ι ι
1 :
_ _ j —
' . . i l :
——
¡-¿Ρ :
ose
* = Γ
'ί
-ν'
.
i j
_
— r —
ι ■
ψ
—"i
¡ '
) 50 100 150 200 250 Z ( c m ) 3( IO4 ¡
δ 6 2 IO1 8 6 2
I 0!
θ 6 2 10' β 6 2 )0
l o g o TeJung 110000. Einheit 5 0 ;rn Leuch. Bem, N r 525
10
10
10
<
A Dy + ln(n.f)/Cd fa Au/Cd c P(n.p) * S (n.p)
-#-1
0
50100
150
200
250 Ζ (cm) 30053
o
■ζ.
Ν
1
10
10
io
310
.5
10
1Í
~*\
ί^Α
\ \ \
\ \ \ \
\ ^ ^
ο '
Δ Dy α Dos A AUy
e y δ
'cd
ο S/cd
-._
5à__o 'j
% - A
V ^ .
50 100 150 200 250 Ζ (cm) 300
250 Ζ (cm) 300
55
350 ζ (cm)—400
H· »d
(ft Η·
S
ί
IP Φ
c+ 4 Η· i3 O Ρ
Ö Η
ν η Ρ 3 Ρ P J 3
Qj C+
¡3
CT» 2
4 Si Β μ . ρ c+ Η
¡^
Ρ Ρ ο
Ö C+·'
pu μ . <Ι 3 Ρ Η· £+ C+ Η·
tf ο
Ο 3 C
et· 4
Ρ
Ο «Η
Ρ Φ
<i ω
Μ Η" Ρ <<! ο
. P i
- ί
P J
ο ω ω ω
-2
m
ii
-4 Κ)
in5
-6 10
-7 111
LH
57
104t=*
10
10
3
10
4
10
-5
10
10
10
10
Vv
γ Αz=ni cm
* ^ — ζ =110 c
X^v.
V X ^
m ^Ç*s
^ I
^ | \ \ .
z=153cn
Δ —L Û — û
z=19Vcm
- Λ - / Ù, " ^
7= 174 cm
—é. i A —
V —
J* *
z=2 55cm /
I I I
r6 0 + 6 r(cm) —
S
"sì Λ / τ ι
| \ " k
'
χν
= Λ ^ ;
\ »
\ ^ A >-*.
^
' " " ^
-Λ V
a Dy
β ln(n.jr)/Cd
A A u / C d
o S/Cd
^ \
Δ^
^ +
^^ 3 | \
0 50
P i g .
11100 150 200 250 300 350 , . 400 z ( c m ) —
Fast, epithermal and thermal activation rates and γ doses in configuration 7.
400 ζ (cm)-—
59
ι <
o Ζ \
Ν
Ζ -1
m
-2 10
-3 10
-4 10
-S 10
- 6
m
-7
m
K T 1 1
·» '
^ Ν
\ > > \
\ Ν
\ \ \ \
\ \
\ \
\ —ν
b ì
{ \
\ * \
Λ\
v \ \
\ V \
\
\—a
D Dose y lungo a
■ g,b. c,d. f interca
= A Dy lungo b intercapedine
Δ Dy „ „ in a equa
( )
b<^" X ^
pedine
r
-^ " P r o f i l ;
I 100
220
170 127 120
70
0 g
\ !
_c ί ^ < >
(cm) \ . \
iti di Fe nell'inter
1
200 z'
S o r q e n t e
^ X > v
\ v Vri
\ s \
— ^ » ^ s r - *1
""-^,
capedine
ΓίΧ" : 'ν* Ν η
^ ,
ι
[cm)-30( ι
-c
ί**^ '
V ^ ^ ^ _ι
\ V
d\ \ f<
^Χ-Χ^""^
5,100 200 300 400 500 ζ (cm)^600