Munich Personal RePEc Archive
Measuring the Performance of the
Banking System: Case of Vietnam
(1990-2010)
Thanh, Ngo
Massey University, VNU UEB
May 2011
Measuring the Performance of the Banking System
Case of Vietnam (1990-2010)
Dang-Thanh NGO1
Abstract
Banking is the core of the financial system which has important role in attracting deposits to
provide credits to borrowers, services to customers and booting the economic development. This
paper applied a modified DEA window analysis to analyze the performance changes through
time of the Vietnamese banking system in the 1990-2010 periods. The research suggests that this
performance is decreasing through the time as the size of the banking sector increases; financial
market is more liberate, and when the World and regional economies are problematic. While the
banking system is running at two-third of its capacity, it has limited contribution to the economy.
Therefore, continuing to develop and restructuring the banking system in Vietnam is important
now and then. Using tighten monetary and/or loosen fiscal policy can be seen as a solution for
improving the performance of the Vietnamese banking system.
JEL classification numbers: E50, G21, G28
Keywords: data envelopment analysis, banking system, performance, Vietnam
1 Introduction
From the financial liberalization in the early of the nineteen nineties, the banking system in
Vietnam particularly and the financial system generally has achieved a lot of improvements (Ngo,
2004). Over these last twenty years, the banking system has been transferring from a one-tier
system into a two-tier system which allowed all participants to compete fairly and effectively.
More banks were established (including foreign owned banks and branches), and more banking
services were provided to satisfy the needs of the customers.
The improvements in the banking sector include increasing freedom for banks in their decisions
and activities, the increasing of (domestic) deposits over Gross Domestic Products (GDP), the
increasing in number of foreign financial and banking institutions, and so on. At the same time,
however, there were several negative ones as well. The negative side may include the number of
closed or merged banking institutions, the unstable of the system (through the liquidation crisis
at the end of 2008 or the high non-performance loans ratio, etc.) These are the results of the
operation of the banking sector itself as well as macroeconomic policy of the Government,
especially the monetary and fiscal policy. Thus, it is important to analyze the performance of the
banking system in Vietnam and how it was affected from macroeconomic policy through the
1990-2010 period.
To the limited knowledge of the author, so far, there is still a lack of research on the
efficiency/performance of the banking sector in Vietnam over the decades. It includes the lack of
research from foreign researchers, which of course feel difficult in accessing the data of
Vietnamese banks (it is always difficult to get any data from any financial institutions because
these data are confidential – except things from the Annual reports). It also includes the lack of
research from Vietnamese ones as well as methodologies for analyzing the performance of banks
individually and banking system as a whole is still limited. Therefore, the aim of the paper is to
provide an empirical research on the performance of the Vietnamese banking system (as a whole)
over twenty years (1990-2010) in order to see how efficient the banking system is, and how it
change during the above period. Within this scope of research, the author will try to prove if
there is any relation between banking performance and macroeconomic policy. This relation, if
significant, will be a good guidance for policy makers in Vietnam and also in other developing
countries.
The remainder of this paper is organized as follows. Section 2 gives some overview on the
banking system development in Vietnam. Section 3 reviews the literatures on
efficiency/performance measurement as well as literatures on evaluating the Vietnam banking
system’s performance. Section 4 explains the methodologies and technical procedures which will
be applied in the research. Section 5 shows some empirical results and Section 6 concludes.
2 Overview of the Vietnamese banking system
Basically before the Doi Moi (revolution) in 1986, the Vietnamese economy in general and the
banking system in particular were not market–oriented. There was only the State Bank of
Vietnam (SBV) in the banking system acting as a government’s budget tool. However, changes
Measuring performance of the banking system: Case of Vietnam (1990-2010)
transformed the economy from a closed command economy into a market-oriented one (Siregar,
1999). This led to the transformation of the banking system as well.
Almost economists agreed that the reform of the Vietnamese banking system was started from
May 1990, when the two important decrees were announced: one was the Decree on the State
Bank of Vietnam; and the other was the Decree on Banks, Credit cooperative and Financial
companies2. These two decrees transformed the Vietnamese banking system from one-tier into two-tier, in which SBV now mainly acted as a central bank, while other banks and financial
companies can operate independently commercial activities. Since then, the banking system in
Vietnam had developed very fast, resulting in the number of banking institutions reached 93 at
the end of 2009 (beside 5 State-owned Commercial Banks and 1 Social Bank, 87 were private
commercial banks in which 5 were foreign fully owned and 40 were foreign branches) (see Table
1).
Within these past years, the banking system in Vietnam did gradually developed not only in
number of banking institutions but size of the banking sector in the economy, amount of credits
for the economy, and amount of other banking services as well. Results of this are, the amount of
capital mobilized through the banking sector was around 1,800 trillion VND, nearly 30% up
compares to 2008 (SBV, 2009); hence, the amount of domestic credits that banking sector
provided to the economy was more than 135% of total GDP (ADB, 2011). Table 2 will show
some of the development of the Vietnamese banking sector over this period.
According to Table 2, the increasing of total liquidity of the economy (as SBV mentioned), or
broad money M2 (ADB definition) over total Gross Domestic Product showed that the financial
deepening was raised rapidly, account for nearly 1.5 times of GDP itself in 31st December 2010. More important, ratio of cash over total liquidity was reduced rapidly in the mean time,
suggested that financial activities regarding cash are now being replaced by activities regarding
non-cash payments such as ATM/POS, checks, credit and debit cards, banking transactions,
[image:4.595.73.501.652.833.2]online payments, etc. (see Figure 1).
Figure 1: Cash/Total liquidity ratio (1990-2010, percent)
2 However, as Nguyen (2008) suggested, the starting point may be earlier, from 1988. And as for Le
Source: ADB (2011)
Despite the above development, however, the performance of the banking system has not been
credited well. While quantity is important, quality is even more vital. In this situation, this paper
contributes to the literatures by researching the performance of the banking system in Vietnam
Measuring performance of the banking system: Case of Vietnam (1990-2010)
Table 1: Numbers of banking institutions in Vietnam (1991-2009)
1991 1993 1995 1997 1999 2001 2003 2005 2007 2009
State-owned
commercial banks 4 4 4 5 5 5 5 5 5 5
Joint-stock commercial
banks 4 41 48 51 48 39 37 37 34 37
Joint-venture banks 1 3 4 4 4 4 4 5 5 5
Foreign bank branches 0 8 18 24 26 26 27 31 41 45
Total 9 56 74 84 83 74 73 78 85 92
Source: SBV, several years
Table 2: Some developments of Vietnamese banking system (1990-2010, percent)
1990 1991 1992 1993 1994 1995 1996 1997 1998 1999 2000 2001 2002 2003 2006 2005 2006 2007 2008 2009 2010
Total liquidity
growth rate 53.09 78.73 33.71 18.95 33.19 22.57 22.70 26.10 25.57 39.28 56.25 25.53 17.65 24.94 29.45 29.74 33.59 46.10 20.30 29.00 33.30 Domestic
credit/GDP 23.74 18.40 15.49 19.33 21.26 20.56 20.34 21.30 22.44 22.39 35.15 39.73 44.78 51.65 60.75 69.78 74.96 95.90 94.32 122.99 135.77 Total
liquidity/GDP 27.07 26.47 24.56 23.02 24.09 23.03 23.78 26.01 28.37 35.67 50.47 58.13 61.44 67.04 74.42 82.30 94.70 117.88 109.23 126.17 140.80
Finance/GDP 1.17 1.44 1.42 1.65 1.93 2.01 1.89 1.74 1.74 1.87 1.84 1.82 1.82 1.77 1.78 1.80 1.81 1.81 1.83 1.91 1.89
Deposit/GDP 9.14 7.20 7.29 5.36 8.08 7.42 8.36 9.59 11.17 15.45 20.25 22.62 24.47 32.99 38.48 44.85 53.46 71.70 67.15 77.97 89.35
Dang-Thanh NGO
3 Review on measuring performance of banking system in
literatures
Performance can be measured using efficiency, or, one can “adapt the techniques
of the efficiency measurement literature to the problem at hand” (Lovell, 1995).
Efficient or efficiency is a term which is used popularly in many aspects such as
economics, technology, social science, etc. In economics, under broad meaning,
efficiency can be viewed as productivity and is measured by the ratio between an
output and an input which is used to produce it. However, when it comes to the
case of multiple inputs and outputs, researchers tend to refer it as productive
(technical) efficiency (Färe, Grosskopf and Lovell, 1994, Siems and Barr, 1998)
or X-efficiency (Berger, Hunter and Timme, 1993).
At institutional (or micro) level, there are two approaches for measuring the
efficiency of a bank: parametric and nonparametric. Each approach has its own
advantages and shortcomings compare to the other. The parametric approach tends
to focus on production function or cost function of banks, in which the estimated
function through regression model can be viewed as an optimal function of the
banking system and can be used as the benchmarking frontier (Banker and
Maindiratta, 1988). Although this parametric estimation can provide information
on confidence intervals and deviations, however, it faces the problem of
misspecification in choosing the right functional form (Berger and Humphrey,
1997) and requires large sample. In contrast, the nonparametric approach tends to
envelop data collected from sampled financial institutions in order to estimate the
optimal frontier of the whole sample, and then scores each institution by
comparing its current level with the optimal one. This approach, therefore, is more
flexible compare to the parametric approach (Charnes, Cooper and Rhodes, 1978,
Färe, Grosskopf and Lovell, 1994, Farrel, 1957) and suitable for non-production
institutions.
In term of time trend analysis, most scholars tend to refer efficiency as total factor
productivity (TFP) and use distance function (Shephard, 1970) to measure the
Measuring performance of the banking system: Case of Vietnam (1990-2010)
applied the productivity indexes derived from Shephard’s distance function to
provide the theoretical framework for the measurement of productivity and its
changing, which later became the Malmquist productivity index number approach.
In the banking industry, this approach was popularly applied to calculate the
technological changes and productivity growth, including Berg, Forsund, &
Jansen (1992), A.N Berger & Mester (1997), Grifell-Tatje & Lovell (1997), etc.
However, as they all used institutional data for banks or bank branches, their
studies can analyze individual bank but not the system as a whole entity.
In fact, at macro level, we can analyze the efficiency of a banking system as a
single entity by applying the X-efficiency definition. Thus, a banking system is
defined as efficient if it can fulfill its missions of providing banking services and
monitoring its stability. Therefore, its efficiency can be calculated by comparing
the outputs (quantity and quality of banking services) and the inputs (financial
investments to the banking system) through Data Envelopment Analysis (DEA), a
popular and powerful tool of the nonparametric approach. By applying this idea,
Ngo (2011) assumed that all researched countries use the same financial
investment to provide ten outputs (including Assets of banking system, Credits
provided by banking system, etc.) and conducted a cross-country effectiveness
analysis for the global banking system. This fruitful study proposed that we can
use DEA for macro data in the banking and financial sectors as well.
In term of analyzing the Vietnamese banking system, limited researches were
conducted, both institutionally and individually.
For institutes, there are reviews and reports of international financial institutions
such as the World Bank (WB), International Monetary Fund (IMF)3, Asian Development Bank (ADB), but also reports from specialized organizations such as
Business Monitor International (BMI)4, Moody’s Investor Service (MIS)5 or Fitch
Dang-Thanh NGO
Ratings (FR)6. Last but not least, the annual reports of the SBV are also important but nothing more than giving general information on the Vietnamese banking
system and policy of the SBV. These publications share a common thing as they
do not give any particular attention to the efficiency of the Vietnamese banking
system.
For individuals, researchers tend to focus more on efficiency evaluation but
mostly at micro level. V. H. Nguyen (2007) conducted research on 13 commercial
banks in Vietnam for the period of 2001-2003 and found that these banks were
inefficient in both allocative (regulatory) and technical (managerial capacity)
aspects, with technical inefficiency is more serious7. X. Q. Nguyen & DeBorger (2008) enlarged the sample size to 15 commercial banks continuing to examine
the technical efficiency of the Vietnamese banking system from 2003 to 2006. The
authors showed that the productivity of these banks was on a decreasing trend.
Recent studies of K.M. Nguyen, Giang, & Nguyen (2008, Nguyen, Giang and
Nguyen, 2010) expanded their research to 32 commercial banks (in the period of
2001-2005) through the slacks-based model DEA, argued that there would be a
room to improve the efficiency of those banks. This is consistent with Ngo (2010)
and Vu & Turnel (2010), although the earlier applied DEA approach for the
top-22 banks in Vietnam in 2008 and the latter applied a Bayesian SFA approach
to investigate the Vietnamese banks in 2000-2006 period.
These results suggested that there is a decreasing trend in the efficiency (and
productivity) of (each) commercial banks in Vietnam. However, without the
analysis at macro level (the whole banking system as an entity), there is no
significant proof for that suggestion. Hence, this paper attempts to show a need for
further research on the Vietnamese banking system, especially relating to
efficiency and performance. Only by improving efficiency can the banking sector
5 http://v3.moodys.com/viewresearchdoc.aspx?docid=PBC_119337 6 http://www.fitchratings.com
Measuring performance of the banking system: Case of Vietnam (1990-2010)
of Vietnam compete strongly and fairly with foreign banks in the integrated global
financial system.
4 Methodological
issues
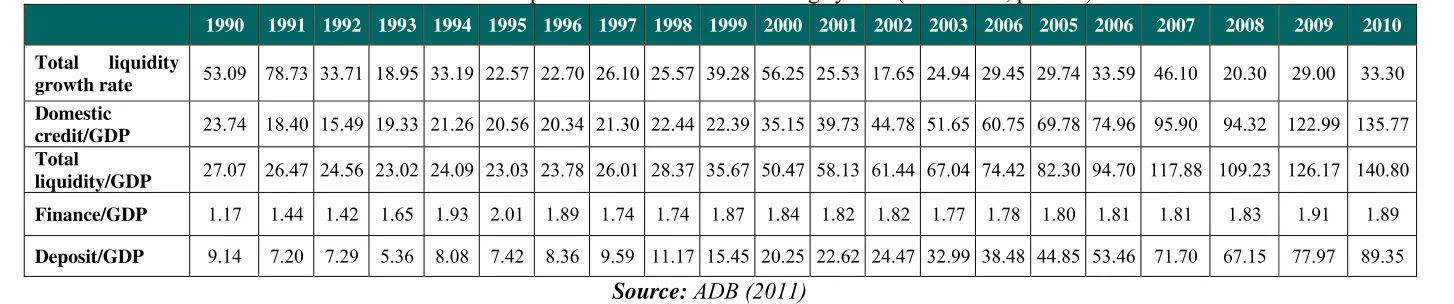
4.1 (General) Data Envelopment Analysis model
The purpose of DEA is to maximizing the outputs while the inputs are constrained
(input-oriented DEA); or minimizing the inputs while outputs are constrained
(output-oriented DEA), for each and every firm in the observation set. By doing
that, the most efficient firms will envelop an (optimal) frontier while remaining
[image:11.595.137.475.271.501.2]firms relatively are inefficient (see Figure 2).
Figure 2: Simple DEA frontier with 2 inputs and 1 output
Note:Efficient score of firm A can be defined by the ratio OA’/OA; similarly for
firm E with OE’/OE; etc.
Source: Ngo (2011)
Charnes, Cooper and Rhodes (1978) developed this model by converted the
maximization (or minimization) problem into a linear program. In this case, a
certain j0-th firm (or DMU – Decision Making Unit) can maximize its efficiency
Dang-Thanh NGO
by solving the following mathematical problem under the assumption that there is
no different in scale between DMUs (CRS model of DEA):
)
(
max
0 ,
m mj m vu
u
y
Subject to:
k kj kx
v
1
0
k kj k m mj m j x v y uEF ≤ 1, 1 ≤ j ≤ n
0 ≤um, vk≤ 1
Where:
um: weight of m-th output factor
vk: weight of k-th input factor
xkj: k-th input of j-th DMU
ymj: m-th output of j-th DMU
n: number of DMU
Later, Banker et al. (1984) improved the model by adding a variable returns to
scale condition in order to analyze the scale effect in efficiency evaluation (VRS
model of DEA). This technique allows researchers to determine whether a DMU
is working at increasing, decreasing or constant returns to scale. As we analyze the
same Vietnamese banking system through time trend, however, the scale effect is
not so important; this paper will apply the CRS model of DEA.
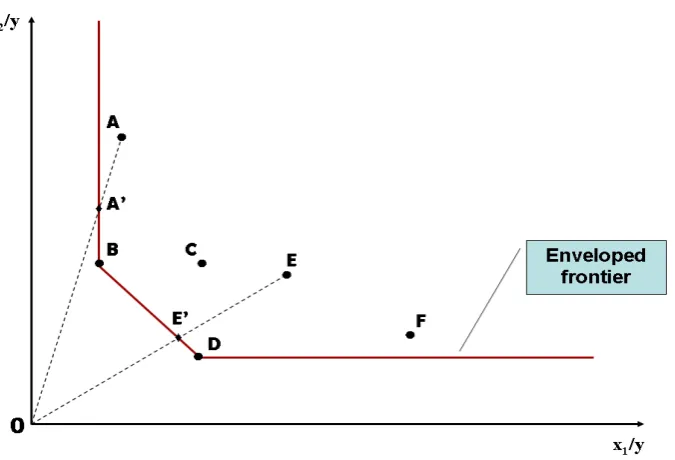
4.2 First stage: DEA model for a single DMU through time trend
According to Asmild et al. (2004), the DEA window analysis model which was
created by Charnes et al. (1985) is useful to analyze the efficiency of a single
DMU over time. This is consistent with Tulkens & Eeckaut (1995) when they use
the term ‘k-specific intertemporal production sets’ to define the general mode for
Measuring performance of the banking system: Case of Vietnam (1990-2010)
single time series of various observations of a single firm (Tulkens and Eeckaut,
1995). Based on that, this paper will propose a modified window analysis DEA
model by looking at the same banking system in different years as different DMUs.
Hence, if we treat the banking system in the period of k years individually, we can
have k observations (or k DMUs). The decreasing or increasing of the efficiency
scores will then show us if there was any technical shift (which leads to technical
efficiency changes) in the examined banking system during that period. In this
situation, the DEA model in this stage is similar to the general DEA model stated
[image:13.595.142.459.287.474.2]in section 4.1 above.
Figure 3: DEA efficiencies of a single DMU through time trend
Figure 3 above explains the situation of efficiency change through time trend for a
single DMU in 5 years (from the time t to t+4). Along this change, this DMU in
time t+1 and t+4 form the enveloped frontier; showing that the efficiency is
increasing from time t to t+1, decreasing from time t+1 to t+2 and staying almost
the same in time t+3, and then increasing again in time t+4.
4.3 Second stage: Tobit regression
Another aim of the research is to find out the effects of macroeconomic policy on
the efficiency of the Vietnamese banking system. This matter was analyzed
Dang-Thanh NGO
other. According to Olugbenga & Olankunle (1998), in Nigeria from 1983 to 1993,
the financial liberalization and deregulation significantly decreased the efficiency
of the banking system during the years immediately after the reform and took long
time to raised up. However, Laeven (2005) analyzed the banking industry of
several East Asian countries and concluded that banking systems with less
government interventions (meaning higher deregulated) performed better than
ones that strongly affected by the state. In 2008, Aburime also conducted a
research on the Nigerian banking industry and found that monetary policy was
positively and significantly affected the profits of the banking sector (Aburime,
2008). And in 2009, Brissimis & Delis (2009) joined this discussion by identified
that monetary policy had no significant impact on bank profits. Therefore, this
paper will use a second stage to define the correlation between efficiency of the
Vietnamese banking system with macroeconomic policy, especially the monetary
and fiscal policies.
After the efficiencies of the Vietnamese banking system were calculated for each
year, the second stage will be conducted using a Tobit regression analysis8 in order to determine the factors affecting the banking efficiencies. Since the
efficiencies scores above are bounded between 0 to 1, non-censored regression
models could be biased (Fethi and Pasiouras, 2010), while Tobit regression is
justify. Following the suggestion of Aburime (2008), the equation for Tobit model
is defined as follow:
EFt = α0 +β1*INTERESTt+ β2*SPENDINGt+ β3*CONCt+ β4*FXt+ β5*INFt + ε6
where EFt is the efficiency score at time t extracted from the 1st stage;
INTERESTt is six months nominal interest rates at time t; SPENDINGt is
government expenditures at time t; CONCt is concentration level of the banking
system at time t, defined by the assets proportion of three largest banks to all
Measuring performance of the banking system: Case of Vietnam (1990-2010)
commercial banks; FXt is nominal exchange rates (VND/USD) at time t; INFt is
inflation level at time t; α0is a constant; β1…4are variable coefficients; ε6 is error
term; and t runs from 1990 to 20109.
5 Empirical
results
In the first stage, the paper develops an output-oriented CRS DEA model for
analyzing the efficiency changes in the Vietnamese banking system from 1990 to
2009. The reason for choosing this model is due to the fact that Vietnamese
banking system is young (compare to other systems in the region and the World)
and still strongly affected by the central banks (SBV); hence, it is possible for the
SBV to control the output of the system in order to contribute to the economic
development of the country. In this situation, the SBV tends to maximize the
outputs using limited inputs (at younger state of development, the nation prefers
investing in industry than service and financial sectors).
According to Ngo (2011), because the banking system acts as an intermediary for
attracting deposits to provide credits to borrowers, services to customers and
booting the financial market (as well as the economy); one input and three outputs
are used in our model. The input variable is the value of total deposits that the
banking system attracted in each year (named Deposits); while the value of credits
(Credits), value of Gross Domestic Product of the nation (GDP), and value of
money supply to the financial market (M2) in the year will be treated as outputs.
In this sense, the model has a total of 4 variables while the sample size is 21
(DMUs) which making the analysis justified10. Data on these variables was extracted from the Statistical Database System (SDBS) of the Asian Development
Bank. Below is some descriptive information on these variables.
9 Data for the five independent variables INTEREST, SPENDING, CONC, FX and INF are annual averaged, extracted from databases of the ADB (INTEREST and SPENDING); the World Bank (CONC and FX); and the IMF (INF).
Dang-Thanh NGO
0.0 0.2 0.4 0.6 0.8 1.0
[image:16.595.104.489.91.216.2]1990 1991 1992 1993 1994 1995 1996 1997 1998 1999 2000 2001 2002 2003 2004 2005 2006 2007 2008 2009 2010
Table 3: Descriptive statistics of input and output variables
Deposits Credits GDP M2
Mean 350317.52 501257.52 618689.48 562801.19
Standard Deviation 529027.73 765144.96 547312.25 775275.51
Minimum 3943 9960 41955 11358
Maximum 1934593 2889525 1980914 2789184
Source: ADB (2012)
The DEA model conducted from these variables will then show us the technical
productivity (or efficiency) of the Vietnamese banking system in the period of
1990-2010 (hereafter we call the banking system in year t under the name DMUt,
i.e. DMU1990, DMU1991, etc.). The empirical results include efficiency scores in
each year, the reference years (which form the frontier), and the targeted outputs
need to be achieved in each year to optimal the activities of Vietnamese banks.
Figure 4: Efficiencies of Vietnamese banking system (1990-2010)
At first, the efficiency scores as shown in Figure 4 provide a general view on
(technical) productivity changes throughout the period, in which the efficiency
[image:16.595.99.498.369.581.2]Measuring performance of the banking system: Case of Vietnam (1990-2010)
slight recovery was seen in the 2009-2010 periods but the efficiency scores were
still low, settled under 0.6. The lowest score is 0.494 in 2007 could be explained
by the “boom and burst” of the Vietnamese securities market in 2006; while the
second lowest is in 2003 when the economy started to get out of the effects of the
regional financial crisis in 1997. This result consistent with the literatures
mentioned in section 3 above suggesting that at the earlier state of development,
the banking system in Vietnam was more efficient in controlling the limited input
(deposits) to provide maximal outputs (credits, GDP, and M2) than in the later
state. This may related to the size of the financial market (and banking system),
while monitoring the system at small size is easier than at larger size. In average,
the efficiency score of the whole banking system during 1990-2010 period is
0.695, which means the system is only running at about two-third of its capacity.
Then, the peers (or reference DMUs) which focused on only two years, 1991 and
1994, propose that these two year were times when the Vietnamese banking
system reached its optimal level, regarding using deposits to create credits, GDP,
and money supply. For 19 years in which the system were less efficient (1990,
1992-1993, and 1995-2010), the system in 1991 (DMU1991) was used to be the
reference 17 times, while the DMU1994 was equally used in 16 times. When
comparing the lambda weights, however, the DMU1994 had higher value than
DMU1991 (see Table 4). The fact that the SBV normalized its credit relations
with international monetary institutes (IMF, WB, and ADB) in 199311 was one important factor made DMU1994 became the most efficient year in the whole
period as such.
Table 4: Peers and Lambda weights for Vietnamese banking system
Year Lambda weight Year Lambda weight
1991 1992 1991 1992
1990 0.017 0.259 2002 22.808 2.368
1992 1.511 n.a 2003 22.783 7.246
Dang-Thanh NGO
1993 1.238 0.257 2004 15.978 13.824 1995 0.891 1.182 2005 10.983 22.865
1996 1.522 1.378 2006 43.544 21.794
1997 1.961 1.813 2007 49.498 40.094
1998 3.982 1.977 2008 15.57 65.233
1999 11.559 n.a 2009 n.a 92.384
2000 17.976 0.062 2010 n.a 130.258
2001 22.575 n.a TOTAL 244.396 402.994
The third point that DEA model tells us is about objective (or targeted) value of outputs, which should be achieved if the banking system can optimize its efficiency. According to this result, as the efficiency scores decreasing through the time, differences between objective and original value became bigger; that made total difference of the whole period reach 96,763,482 billion Dong, account for more than 7.4% of total GDP from 1990-2010. Within this difference (or so-called
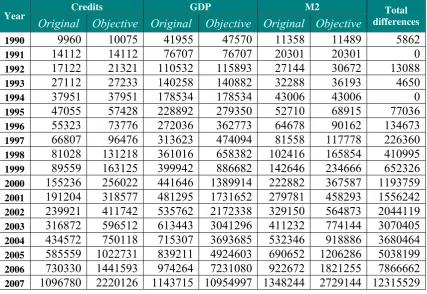
[image:18.595.85.513.383.677.2]waste), the most wasted factor is GDP (around 81%) while Credits and M2 are 8% and 11% wasted accordingly. It suggests that the contribution of banking system into economic development in Vietnam has been very limited.
Table 5: Targeted value for output variables when reach efficient frontier
Year Credits GDP M2 Total
differences
Original Objective Original Objective Original Objective
1990 9960 10075 41955 47570 11358 11489 5862 1991 14112 14112 76707 76707 20301 20301 0 1992 17122 21321 110532 115893 27144 30672 13088 1993 27112 27233 140258 140882 32288 36193 4650 1994 37951 37951 178534 178534 43006 43006 0 1995 47055 57428 228892 279350 52710 68915 77036 1996 55323 73776 272036 362773 64678 90162 134673 1997 66807 96476 313623 474094 81558 117778 226360 1998 81028 131218 361016 658382 102416 165854 410995 1999 89559 163125 399942 886682 142646 234666 652326 2000 155236 256022 441646 1389914 222882 367587 1193759
Measuring performance of the banking system: Case of Vietnam (1990-2010)
2008 1400693 2695393 1485038 12840692 1622130 3121510 14149734 2009 2039687 3506052 1658389 16493623 2092447 3973051 18182203 2010 2889525 4943424 1980914 23255496 2789184 5601879 26141176
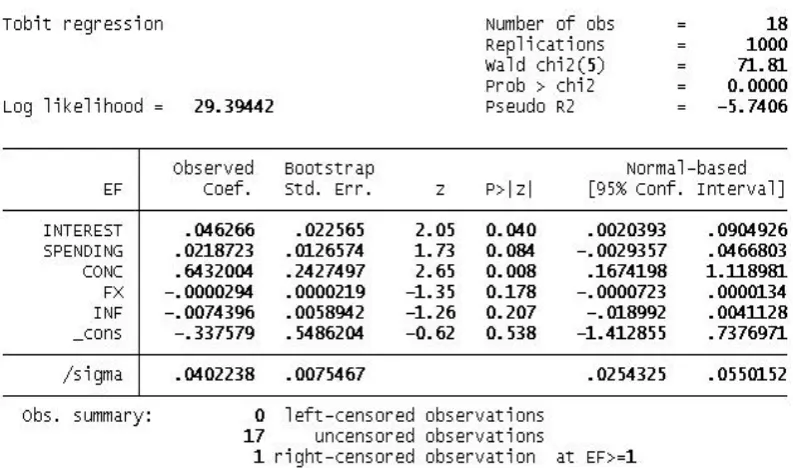
In the second stage, first we ran a basic Tobit regression to define if there is any
correlation between efficiency of the banking system and the independent
variables of INTEREST, SPENDING, CONC, FX, and INF. The result is shown in
Figure 5. However, as our sample is small (18 observations, as we do not have the
data of INTEREST for two years 1990 and 1991), we ran another bootstrapped
Tobit regression to see the changes (Figure 6). It is worth to notice that under
normal Tobit model, all independent variables are significantly correlated with the
banking system’s efficiency (while the first three variables have positive
correlations, FX and INF is negatively correlated to efficiency). Under bootstrap,
exchange rates and inflation are no longer correlated; however, banking
concentration, short term interest rates and government expenditures are still have
big impact to the efficiency of the Vietnamese banks. This suggest that under a
tighten regime of monetary policy and/or loosen regime of fiscal policy, the
[image:19.595.97.499.442.648.2]Vietnamese banking system can work more efficient than in other situations.
Dang-Thanh NGO
Figure 6: Bootstraped Tobit resression results
6 Conclusions
Measuring performance of the banking system: Case of Vietnam (1990-2010)
References
[1] U. T. Aburime, Determinants of bank profitability: Macroeconomic evidence from Nigeria, SSRN eLibrary, (2008), 34.
[2] ADB, Key Indicators for Asia and the Pacific 2011, Asian Development Bank, 2011.
[3] ADB, Statistical Database System Online, Asian Development Bank, 2012. [4] M. Asmild, J. Paradi, V. Aggarwall and C. Schaffnit, Combining DEA
Window Analysis with the Malmquist Index Approach in a Study of the Canadian Banking Industry, Journal of Productivity Analysis, 21, (2004), 67-89.
[5] R. D. Banker, A. Charnes and W. W. Cooper, Some Models for Estimating Technical and Scale Inefficiencies in Data Envelopment Analysis,
Management Science, 30, (1984), 1078-1092.
[6] R. D. Banker and A. Maindiratta, Nonparametric Analysis of Technical and Allocative Efficiencies in Production, Econometrica, 56, (1988), 17.
[7] S. A. Berg, F. R. Førsund and E. S. Jansen, Malmquist indicies of productivity growth during the deregulation of Norwegian banking, 1980-89,
The Scandinavian Journal of Economics, 94, (1992), S211-S228.
[8] A. N. Berger and D. B. Humphrey, The dominance of inefficiencies over scale and product mix economies in banking, Journal of Monetary Economics, 28, (1991), 117-148.
[9] A. N. Berger and D. B. Humphrey, Efficiency of financial institutions: International survey and directions for future research, European Journal of Operational Research, 98, (1997), 175-212.
[10] A. N. Berger, D. B. Humphrey and D. Hancock, Bank efficiency derived from the profit function, Journal of Banking and Finance, 17, (1993), 317-347.
[11] A. N. Berger, W. C. Hunter and S. G. Timme, The efficiency of financial institution: A review and preview of research past, present, and future,
Journal of Banking and Finance, 17, (1993), 221-249.
[12] A. N. Berger and L. J. Mester, Inside the black box: What explains differences in the efficiencies of financial institutions?, Journal of Banking and Finance, 21, (1997), 895-947.
[13] S. N. Brissimis and M. D. Delis, Bank heterogeneity and monetary policy transmission, Bank of Greece, Athens, Greece, 1-42, 2009.
[14] D. W. Caves, L. R. Christensen and W. E. Diewert, The economic theory of index numbers and the measurement of input, output and productivity,
Econometrica, 50, (1982), 1393-1414.
Dang-Thanh NGO
(1985), 95-112.
[16] A. Charnes, W. W. Cooper and E. Rhodes, Measuring The Efficiency Of Decision Making Units, European Journal of Operational Research, 2, (1978), 15.
[17] R. G. Dyson, R. Allen, A. S. Camanho, V. V. Podinovski, C. S. Sarrico and E. A. Shale, Pitfalls and protocols in DEA, European Journal of Operational Research, 132, (2001), 245-259.
[18] R. Färe, S. Grosskopf and C. Lovell, Production Frontiers, Cambridge University Press, New York, 1994.
[19] M. J. Farrel, The Measurement Of Productive Efficiency, Journal of the Royal Statistical Society, 120, (1957), 37.
[20] M. D. Fethi and F. Pasiouras, Assessing bank efficiency and performance with operational research and artificial intelligence techniques: A survey,
European Journal of Operational Research, 204, (2010), 189-198.
[21] E. Grifell-Tatje and C. A. K. Lovell, The sources of productivity change in Spanish banking, European Journal of Operational Research, 98, (1997), 364-380.
[22] L. Laeven, Banking Sector Performance in East Asian Countries: The Effects of Competition, Diversification, and Ownership, World Bank, Washington, DC, 42, 2005.
[23] C. A. K. Lovell, Measuring the macroeconomic performance of the Taiwanese economy, International Journal of Production Economics, 39, (1995), 165-178.
[24] D. T. Ngo, Financial liberalization progress in Vietnam – Reality and Solutions, University of Economics and Business, Vietnam National University, Master, (2004), 113.
[25] D. T. Ngo, Evaluating the efficiency of Vietnamese banking system: An application using Data Envelopment Analysis, University of Queensland, Brisbane, Australia, 26, 2010.
[26] D. T. Ngo, Effectiveness of the Global Banking System in 2010: A Data Envelopment Analysis approach, Chinese Business Review, 10, (2011), 961-973.
[27] K. M. Nguyen, T. L. Giang and V. H. Nguyen, Ranking efficiency of commercial banks in Vietnam with super slacks-based model of Data Evelopment Aalysis, Seikei University, Tokyo, Japan, 23-31, 2008.
[28] K. M. Nguyen, T. L. Giang and V. H. Nguyen, Efficiency and super-efficiency of commercial banks in Vietnam: performances and determinants, National Economics University, Hanoi, Vietnam, 17, 2010. [29] V. H. Nguyen, Measuring Efficiency of Vietnamese Commercial Banks: An
Application of Data Envelopment Analysis (DEA), in Technical Efficiency and Productivity Growth in Vietnam, Publishing House of Social Labour, 2007.
Measuring performance of the banking system: Case of Vietnam (1990-2010)
Academia Sinica, Taiwan, 15, 2008.
[31] S. O. Olugbenga and A. P. Olankunle, Bank performance and supervision in Nigeria: Analysing the transition to a deregulated economy, African Economic Research Consortium (AERC), Nairobi, Kenya, 1-50, 1998.
[32] SBV, Annual Report, (2009).
[33] R. W. Shephard, Theory of cost and production functions, Princeton University Press, Princeton, NJ, 1970.
[34] T. F. Siems and R. S. Barr, Benchmarking the productive efficiency of U.S. banks, Financial Industry Studies, (1998), 11-24.
[35] R. Siregar, Management of macroeconomic policies Vietnam., in Rising to the Challenge in Asia: A Study of Financial Markets: Volume 12 – Socialist Republic of Vietnam, Asian Developmen Bank, Manila, 1999.
[36] J. Tobin, Estimation of Relationships for Limited Dependent Variables,
Econometrica, 26, (1958), 24-36.
[37] H. Tulkens and P. V. Eeckaut, Non-parametric efficiency, progress and regress measures for panel data: Methodological and aspects, European Journal of Operational Research, 80, (1995), 474-499.