Published Online November 2013 in SciRes (http://www.scirp.org/journal/psych) http://dx.doi.org/10.4236/psych.2013.411120
Development and Evaluation of the Posttraumatic Growth
Status Inventory
Tatjana Alexander
1, Rainer Oesterreich
21Department of Rehabilitation Psychology, Albrecht-Ludwigs-University of Freiburg, Freiburg, Germany 2Department of Quantitative Methods, University of Technology, Berlin, Germany
Email: [email protected]
Received August 11th, 2013; revised September 12th, 2013; accepted October 13th, 2013
Copyright © 2013 Tatjana Alexander, Rainer Oesterreich. This is an open access article distributed under the Creative Commons Attribution License, which permits unrestricted use, distribution, and reproduction in any medium, provided the original work is properly cited.
Posttraumatic growth reflects beneficial psychological processes in persons with traumatic experiences. Existing measures of growth were criticized due to their retrospective self-report format that may cause biases in capturing the growth processes in individuals with several specific kinds of trauma, such as phy- sical or psychological disabilities of close family members, bereavement and some others kinds of trau- matic experience. In this case, the feelings of guilt may prevent the persons from being aware of the fa- vorable personal changes. The objective of this study was to develop and to evaluate an alternative meas- uring instrument that uses a status quo response format instead of retrospective items and covers addi- tional areas of growth-related changes. The samples comprised 440 adult persons with traumatic expe- rience, including 181 parents of children with mental and/or physical disabilities. Exploratory and confir- matory factor analyses revealed a 7-factors solution, corresponding to the following subscales: Relation- ships to Others, New Possibilities, Personal Strength, Appreciation of Life, Spiritual Changes, Generativ- ity, and Openness. Results showed good reliability and concurrent validity. The PGSI is recommended particularly for use in longitudinal studies as well as in samples of persons whose trauma relates to a se- vere psychological or physical disability in their families.
Keywords: Posttraumatic Growth; Coping; Resources; Inventory
Introduction
In the past decade, the possibilities of multifaceted positive psychological outcomes, as a consequence of a traumatic life experience, such as an onset of severe health problems in a person her/himself or in a close family member, bereavement or experience of violence, became more and more the objective of theoretical and empirical research work. The approaches to de- scribe the underlying psychological changes led to creating scientifically-founded concepts like posttraumatic growth (PTG, Calhoun, & Tedeschi, 1999; Tedeschi & Calhoun, 2004), ad- versarial growth (Linley & Joseph, 2004), thriving (O’Leary & Ickovics, 1995), benefit finding (Affleck & Tennen, 1996), and stress-related growth (Park, 1996). From these terms, describ- ing comparable processes in the aftermath of a traumatic event, the term “posttraumatic growth” seems to be the most establi- shed. The concept ‘posttraumatic growth’ serves as an expres- sion for processes of changing life orientations and priorities as well as the achievement of a new level of feelings and self- awareness. These processes are initiated by the attempts to adapt to highly challenging life circumstances that can produce high levels of psychological distress. The person’s struggle with the new reality in the aftermath of trauma is essential in influ- encing the degree and the individual profile of posttraumatic growth. Eventually, the processes of growth involve a move- ment beyond pre-trauma levels of adaptation, they represent ra- ther ongoing development as a static outcome (Tedeschi & Cal-
houn, 2004). Persons often characterize the corresponding chang- es as valuable enrichment in their lives. The following domains of perceived personal growth processes were discussed in em- pirical literature: changes in self like feelings of being strong and more self-assured, a new sense of increased closeness in re- lationships with others, open-mindedness, religiosity/spirituali- ty changes, as well as alterations in philosophy of life including increased life appreciation and the attempt to live each day to the fullest (Schaefer & Moos, 1992; Calhoun & Tedeschi, 1999; Tedeschi & Calhoun, 2004; Danoff-Burg & Revenson, 2005).
In order to capture growth processes, studies use the Post- traumatic Growth Inventory (PTGI, Tedeschi, & Calhoun, 1996), the Benefit Finding Scale (BFS, Antoni et al., 2001; Tomich & Helgenson, 2004), or the Stress-Related Growth Scale devel- oped by Park and collaborators (SRGS, Park, Cohen, & Murch, 1996). These measures differ in regard to the following aspects which will be addressed in turn: a) the target population, for whom the particular measure was designed, b) priority at the focal point in the assessment procedure, c) the degree to which a measure allows for the differentiation between various growth domains, (d) and general connotation of the items.
was also used to capture beneficial psychological changes in fa- mily caregivers (Kim, Schulz, & Carver, 2007).
b) When regarding the content, the growth measures differ slightly in the focal point in the assessment procedure. All three measuring instruments represent the growth facets relationships to the others, and personal strength, respectively.
However, the Benefit Finding Scale only contains a great number of items capturing family relationships growth and ac- ceptance. In contrast, the PTGI as well as the SRGS, but not the BF measures religious/spiritual changes. Furthermore, the PTGI includes items that relate to “life appreciation” and “new possi- bilities” growth domains, which are not covered sufficiently by the SRGS and the BFS. At last, the SRGS is a single measure which comprises several items capturing self-understanding and affect-regulation as additional growth aspects.
c) The degree to which each of the measures allows for the differentiation between various growth domains depends on the dissimilarity in items content and on the underlying factorial structure of the questionnaires, which may serves as a founda- tion for composition of separate subscales. For the PTGI, the stability of a five-factor structure was proved in empirical stud- ies (Tedeschi & Calhoun, 1996; Maercker & Langner, 2001; Taku et al., 2008).
Less unambiguous were the results of factor analyses on the BFS and the SRGS items. Various investigations revealed dif- ferent factorial solutions [Antoni et al., 2001 (BFS, 1 factor); Weaver et al., 2008 (BFS, multiple factor models); Kim, Schulz, & Carver, 2007 (BFS, 6 factors); Park, Cohen, & Murch, 1996 (SRGS, 1 factor); Armeli, Gunthert, & Cohen, 2001 (SRGS, 8 factors); Maercker & Langner, 2001 (SRGS, 1 factor)]. As a consequence, no established subscales were created; the total scores only had been commonly used in studies as a global growth assessment.
d) The fourth difference concerns the general connotations of each of the separate items. The BFS inquires about things “The disease taught me to do or to feel”, suggesting a somewhat pas- sive role for the affected persons, whereas the PTGI and the SRGS ask for changes, which “one has experienced as a result of traumatic events”, seeing respondents as more “active” sub- jects.
On the whole, existing measures of growth proved to be very useful in the research on positive adaptation and beneficial psychological processes in the aftermath of significant trau- matic events. Nevertheless, they were also criticized in the li- terature due to several limitations. The main criticism arises out of the retrospective self-report format: All currently available measures ask for subjective experiences of trauma related changes; they do not capture the “status quo” of growth proc- esses. The retrospective measurement of changes implies, that people can correctly compare their actually attributes with their pre-trauma characteristics. However, the recollection of how they were prior to the time of traumatic life event may be dis- torted due to cognitive biases. For example, McFarland and Alvaro (2000) observed that traumatic event victims tended to derogate their pre-event characteristics. Another study address- ed the issue, whether current methods of measuring PTG (i.e., linked questions to stressful event) generally create a positive bias which may undermine the data validity (Smith & Cook, 2004). In order to examine positive biases in self-reported growth, Smith and Cook compared reports of growth from two groups of individuals. In the first group, participants completed the Posttraumatic Growth Inventory in relation to a specific stress-
ful event. In the second group, PTGI questions were not linked to specific events. Instead, participants were instructed to gen- erally think about the past 4 years, and indicate the degree to which specific, personal changes occurred. In the “unlinked group” only, individuals exposed to traumatic events reported greater growth in Personal Strength and Relationships to Others than participants who did not experience a traumatic event within last four years. The authors conclude that current meas- urements may actually underestimate PTG to a small but sig- nificant degree. Linking questions about PTG to specific stress- sors could influence participants to be cautious about attributing their growth experiences to a stressful event.
Furthermore, due to a retrospective item format, current growth scales are less appropriate in measuring the beneficial growth processes in individuals whose traumatic experience is related to several specific conditions like a physical disease or a psy- chological disorder in their families. In this case, the feelings of guilt may prevent the persons from being aware of the favor- able personal changes (Peters & Jackson, 2009; Johnson, O’Reil- ly, & Vostanis, 2006; Alexander & Wilz, 2010). Qualitative re- search demonstrates several concrete examples of such intra- psychic ambivalence. For instance, a mother of a child with se- vere health-related problems reported barriers to acknowledge positive changes: “The harm of my child cannot be profitable for me in any way” (Schirmer & Alexander, 2013).
Another criticism of the currently available growth scales is that they do not cover all potentially relevant growth domains (e.g., Park & Lechner, 2006). Thus, according to findings from qualitative research, positive changes often occur in areas like more attentiveness for one’s own needs and feelings (Mohr et al., 1999), self-care (e.g., Siegel & Schrimshaw, 2000; Paken- ham, 2007; Affleck et al., 1987), open-mindedness and the way one treats others, particularly the pleasure in supporting others and in sharing one’s own knowledge and helpful life experience (Cadell & Sullivan, 2006; Danoff-Burg & Revenson, 2005; Up- degraff et al., 2002). The last mentioned intrapersonal changes often occur in relation to several specific kinds of trauma, in- cluding experience concerned to severe physical or psycholo- gical health conditions in the family (e.g. Alexander & Wilz, 2010; Barskova & Oesterreich, 2009). None of the existing growth measures includes subscales which address the corres- ponding growth areas.
esses in individuals with different kinds of traumatic experi- ence.
In order to estimate the concurrent validity of the PGSI, we aimed for capturing the correlations between the PGSI sub- scales and the psychological health indicators as well as corre- sponding correlations between the PGSI and several measures of coping behavior. As demonstrated in empirical investigations, posttraumatic growth has been found to be positively linked to several criteria of psychological health and to the adaptive cop- ing strategies, in case a sufficiently long period of time has passed since the initial traumatic event (Siegel & Schrimshaw, 2007; Ho, Chan, & Ho, 2004; Lechner et al., 2006; Mc Millen & Cook, 2003; Morris, Shakespeare-Finch, & Scott, 2007; Sch- midt et al., 2012; Kountrouli, Anagnostopoulos, & Potamia- nos, 2012). Further studies showed significant negative rela- tionships between the posttraumatic growth and maladaptive, dysfunctional coping, like substance abuse and behavioral dis- engagement (Urcuyo et al., 2005; Milam, 2004; Loiselle et al., 2011).
In view of the results from these studies, we resolved to use the mental health- and coping-related variables as appropriate criteria in testing the concurrent validity of the PGSI in the final stage of the study. We expected negative associations of the PGSI with depression, anxiety, physical complaints and mal- adaptive coping strategies. In contrast to this, we hypothesized, that the correlations between the PGSI and different adaptive coping strategies, such as active coping, seeking for social sup- port and regenerative coping would be positive.
Method
Participants and Procedure
The general purpose of this study was to develop a measur- ing instrument of posttraumatic growth that, due to its status quo item format (as well as capacity to capture additional growth areas), may be particularly appropriate for using with individu- als who experienced several specific kinds of trauma, such as a physical disease or a psychological disorder in a close family member. In addition to this, the questionnaire should be, overall, applicable in studies focusing on beneficial psychological pro- cesses in the aftermath of different kinds of serious traumatic experience. Consequently, in the stage of item selection and the initial psychometric screening, we decided to select participants with a broad array of significant psychological traumas. In the second stage, the psychometric properties and the factorial structure of the newly developed inventory were repeatedly tested, especially in samples of individuals with disease-related traumata.
In accordance with this procedure, the data collected from sample one were used to complete the item selection, to iden- tify the factorial structure underlying the newly developed Post- traumatic Growth Status Inventory and to screen psychometric properties of the separate PGSI subscales. The first sample con- sisted of 118 university students and 96 employed adults with different kinds of significant traumatic experience. Several ad- vertisements at the university and an advertisement at a local newspaper provided information about the project. Due to the fact that the whole questionnaire packet was somewhat long and required ca. sixty minutes to fill-out all measures, the parti- cipants could pick up the questionnaire at the university and complete it at home. In an attempt to reduce the missing data and to foster the motivation, all participants received ten Euros
and a brief anonymous feedback concerning their individual test scores in comparison with the norm values of the used mea- suring instruments (when available) and the mean values from the whole sample.
Sample two was recruited in order to test the stability of the initial factorial solution that was identified in sample one, and to provide empirical evidence concerning the validity and the reliability of the newly developed Posttraumatic Growth Status Inventory. As mentioned above, an important aim of the study was to develop a measure of posttraumatic growth that should be suitable to capture growth processes in individuals whose trauma relates to their close relatives’ highly stressful experi- ence, such as a mental or a physical disability in their families. Consequently, the second sample should include individuals with this kind of trauma. To recruit the eligible participants, we contacted professionally moderated self-help groups for parents of children with different kinds of disabilities as well as several doctors’ offices. One hundred eighty-one parents of children with mental or physical disabilities and 45 adult persons whose trauma related to their own severe medical conditions gave their consent to participate in the study and completed the ques- tionnaires. The corresponding return rate resulted in 92%. To foster commitment, similar to sample one, the participants re- ceived anonymous detailed feedback regarding their individual test scores in comparison with the mean values from their ref- erence group as well as the information about the main results of the whole study, after completion of the investigation.
Measures
Demographics and Information about Traumatic Events
All participants responded to several questions concerning demographic information. As preview research demonstrated the role of emotional support as an important predictor on post- traumatic growth and, generally, positive psychological adjust- ment (Barskova & Oesterreich, 2009; Taylor & Stanton, 2007), the respondents were also asked to which extent they have the possibility to talk with a supportive person about their problems in a confidential way, if necessary. In addition, participants of sample one (mixed sample of university students and employed adults with different kinds of traumatic experience) were asked to provide information about the traumatic life event they had experienced within the past five years, including the nature of the event and the time elapsed since the event. Participants of the sample two (whose trauma was related to either their own severe medical condition or to their child mental or physical di- sability) were asked about the time elapsed since the diagnosis and the extent to which the awareness of the diagnosis was up- setting for them, with scores ranging from 0 (hardly upsetting) to 3 (completely upsetting).
Coping
reliability and convergent validity of the Brief COPE subscales (Carver, 1997; Muller & Spitz, 2003). Several subscales of the questionnaire may be classified as adaptive, functional coping behavior (e.g., active coping, planning, and using emotional support), the others capture rather maladaptive, dysfunctional co-ping (e.g., substance use, behavior disengagement, and self- blame).
In order to estimate the degree to which participants use re- generative coping that is not captured by the Brief COPE, we composed a short scale consisting of 4 items (e.g., “I learn spe- cific relaxation techniques”). The internal consistency of this additional short scale was acceptable (Cronbach’s alpha of .71 in sample one and Cronbach’s alpha of .73 in sample two).
Health Indicators
The Impact of Event Scale-Revised (IES-R; Weiss & Mar- mar, 1997) was applied to capture the degree of the posttrauma- tic stress disorder symptoms (PTSD) in the aftermath of trau- matic events. The IES-R is a 22-item scale assessing intrusive thoughts, avoidance, and hyperarousal symptoms consistent with PTSD. Participants were asked to focus on the time im- mediately after their traumatic experience and then indicate how much they were distressed or bothered during this time by each “difficulty” listed. Items were rated for frequency of oc- currence on a 5-point scale ranging from 0 (“not at all”) to 4 (“extremely”). The convergent validity of the IES-R was ex- amined in previous studies by assessing the correlations be- tween the IES-R and the PTSD checklist and could be classified as “high” (Creamer, Bell, & Failla, 2003).
Somatization, depression and anxiety subscales from the Brief Symptom Inventory (BSI, Derogatis, 1993) were used to assess recent mental health status. The somatization subscale captures psychological distress resulting from the perception of body dysfunction (e.g., cardiovascular, gastrointestinal, and re- spiratory). The depression subscale addresses symptoms of cli- nical depressive syndrome, such as withdrawal of interest in life activities, dysphoric affect, and loss of energy. Typical anxiety symptoms measured with the anxiety subscale are nervousness, restlessness, and tension. Previous studies have revealed satis- factory internal reliability of above .70 and the good convergent validity for the separate BSI subscales (Derogatis & Melisara-tos, 1983; Derogatis, 1993). Concordant to the results from the previous research, the internal reliabilities of the BSI subscales reached in our study (in the sample two) adequate values of .84, .86, and .83 for anxiety, depression, and somatization subscales, respectively.
To receive additional information concerning participants’ somatic complaints, we applied the Freiburg Complaint List (the FBL-R, Batra, Slifkin, & Fahrenberg, 1995). The FBL-R is a self-report standardized questionnaire that lists different gen- eral as well as specific physical complaints including tiredness, pain, sensory, cardiovascular, and gastrointestinal symptoms. The respondents were asked how often they experience each of the different somatic complaints mentioned in the questionnaire. The total score of the FBL-R was used in our study as an indi- cator of the self-reported physical well-being. Prior research provided empirical evidence for the concurrent validity of the Freiburg Complaint List. In a representative sample of adults, highly significant correlations were found between FBL-R scores and indicators of illness, health concern, and utilization of health services (Fahrenberg, 1995).
Posttraumatic Growth
Participants of sample one responded to the initially 48 items which should constitute the newly developed Posttraumatic Growth Status Inventory. Some of the items were adapted from existing scales, and others were generated from the relevant empirical and theoretical literature and from the interviews with individuals facing various traumatic events (for authors’ quail- tative research and literature review see Barskova & Oester- reich, 2009; Schirmer & Alexander, 2013).
A substantial part of the persons (n = 45) who were inter- viewed in the stage of the item generation, were individuals with a traumatic experience related to severe physical condi- tions or psychological disabilities of their close relative (a child or a spouse living in the same home). Each item from the initial item pool was rated using a 7-point Likert scale, ranging from 1 (does not apply) to 7 (completely applies). Items addressed the following nine potential growth domains: appreciation for life (e.g., “Every day is special to me”), relationships to others (e.g., “I know I can depend on others in difficult times”), new possi- bilities (e.g., “I know from experience that difficult and fearful events can bring about various unexpected possibilities”), per- sonal strength (e.g., “I can handle difficulties well”), spirituality (e.g., “I have a pronounced religious or spiritual faith”), open- ness (e.g., “I enjoy listening to others opinions even when they contradict what my convictions are”), treating others (e.g., “I enjoy sharing my experiences to help others to find a solution to their problems”), sustainability (e.g. “Sometimes, I reflect how my life would be after the next five years”), and world view (e.g., “I am interested in other cultures”). In the second sample, respondents completed the final form of the newly
developed PGSI that contained 36 items.
Participants of both samples also completed the Posttrau- matic Growth Inventory (PTGI, Tedeschi, & Calhoun, 1996). The PTGI is a 21-item questionnaire that measures the degree of the positive changes experienced in the aftermath of a trau- matic event. The PTGI contains five subscales. The internal consistency for the total score and separate subscales of the PTGI has been reported as satisfactory (Cronbach’s Alpha co- efficient for the total score = .90; Relating to others = .85; Per- sonal Strength = .72; New Possibilities = .84; Spiritual Change = .85; and Appreciation of Life = .67). Further, women were found to receive higher scores than men (Tedeschi & Calhoun, 1996).
Data Analyses
Data analyses procedure included seven major stages. First,
scales and post-event symptoms of posttraumatic stress disorder, such as avoidance, intrusions and hyperarousal, were calculated. In terms of concurrent validity, we expected that the PGSI sub- scales would be positively associated with symptoms of post- traumatic stress disorder experienced immediately in the after- math of a traumatic event.
At stage 5, using the data of the sample two, we conducted the Confirmatory Factor Analysis (CFA) upon the remaining thirty-six items to examine the construct validity and the stabil- ity of the factorial solution. Further, we tested the criterion and concurred validity as well as the Cronbach’s Alpha reliability of the finally 36-item version of the Posttraumatic Growth Sta- tus Inventory (stage 6 and stage 7) in sample two. Similarly to the procedure in sample one, the criterion validity was esti- mated by analyzing the correlations between the newly devel- oped PGSI subscales and the “classical” measure of posttrau- matic growth from Tedeschi and Calhoun (1996). The concur- rent validity was assessed in this final stage by calculating the correlations between the PGSI subscales and psychological health indicators as well as corresponding correlations between the PGSI and several measures of coping behavior. As it is recommended in the guidelines on estimating the validity of the measures comprising of the multiple subscales (APA, 1999; Crocker & Algina, 1986), we used several kinds of potentially associated variables in order to provide a possible differentiated picture of concurrent validity for each separate subscale. By reason that the validity estimation procedure of this kind bears a predominantly descriptive character, we refrained from the ap- plication of the alpha error corrections, as it is common in the initial testing of the psychometric properties of the newly de- veloped measuring instruments with a multi-factorial structure (APA, 1999; Crocker & Algina, 1986).
Confirmatory Factor Analysis
An import part of this study was the application of the con- firmatory factor analysis (CFA) in sample 2 to examine con- struct validity and stability of the factorial solution of the PGSI. In contrast to the EFA, the aim of which is simply to identify the factor structure underlying the set of variables, the goal of the CFA is to test a hypothesized factor structure or statistical model and to assess its fit to the data.
The estimation of model fit was based on multiple criteria that reflected statistical and practical considerations. The re- ported goodness-of-fit statistics include chi-square value, the normed chi-square (chi square/df), as well as the Goodness of Fit Index (GFI) and the Root Mean Square Error of Approxi- mation (RMSEA). The statistically significant chi square indi- cates that a significant proportion of variance in the data re- mains unexplained by the model; however a statistically sig- nificant chi-square can often be produced as an artifact of sam- ple size and small variations in the data (Hu & Bentler, 1995). The normed chi-square (chi square/df) should fall within the levels of 1.0 to 3.0 for acceptable fit (Carmines & McIver, 1981). The RMSEA expresses the lack of fit due to reliability and also model (mis)specification. RMSEA should be smaller than .08 for acceptable fit, values ranging from .08 to .10 indi- cate mediocre fit, and those greater than .10 indicate poor fit (Byrne, 2001; MacCallum, Browne, & Sugawara, 1996). The GFI is the Goodness of Fit Index. The GFI can be classified as absolute index of fit because it basically compares the hypothe- sized model (i.e., factorial structure) with no model at all. The GFI varies from 0 to 1, but theoretically can yield meaningless
negative values. By convention, GFI should by equal to or greater than .90 to accept the model (Jöreskog & Sörbom, 1984; Loehlin, 2004). By this criterion the present model is accepted.
Results
Step 1: Item Selection and Preliminary Assessment of
Validity and Reliability of the Newly Developed
Subscales Based on the Data from the Sample One
The Descriptive Characteristics of Sample One
As reported above, sample one consisted of 118 undergradu- ate students who experienced a highly stressful event during the past five years as well as 96 employed adults who also stated that they were traumatized by a personally significant event within the same 5-years period of time. The average age in this sample was 32 years; sixty-five percent of the respondents were women (n = 140) and thirty-five percent were men (n = 74). The events the study participants had experienced were catego- rized as follows: a) bereavement (25%); b) serious disease of close relatives (19%); c) severe enduring interpersonal conflicts with one significant person (14%); d) completely change of the familiar surroundings (12%); e) personal illness or accident (6%); f) grave work-related or academic problems (6%); g) so- cial abuse (by a group of people) (4%); h) a victim of violence (4%); i) injury-producing accidents in immediate family (3%); j) pregnancy-related problems (2%); k) witness of violence (1%); l) bankruptcy (1%); m) tsunami (.5%); n) other (2.5%). On the average, participants’ most stressful event occurred 35.78 months (SD = 21.05), i.e., approximately three years prior to data col- lection.
Item Selection Based on Results of the Exploratory Factor Analysis
All 48 items from the original pool were entered into an ex- ploratory factor analysis using principal components extraction and oblique rotation. The oblique rotation was chosen by reason that, corresponding with previous research (Tedeschi & Cal- houn, 1996; Maercker & Langner, 2001), the different domains of posttraumatic growth were expected to be correlated. The factor solution was determined by the number of factors gener- ated with eigenvalues greater than 1, as well as by theoretical considerations. Because the factor solutions for students and non-students were virtually identical, data from the sub-samples of participated students and employed adults with traumatic experience were combined. Eight factors had an eigenvalue greater than one. Examination of the pattern of factor loadings revealed 8 items that had factor loadings less than .30. These items were dropped. The remaining forty items were subjected to another exploratory factor analysis. Results of this second factor analysis were principally the same as the original facto- rial solution. Each item loaded highest on its respective factor and had relatively low loadings (<.30) on all other factors. Cor- responding to the content of the items which constituted the separate factors, the factors were labeled as following: relation- ships to others, personal strength, new possibilities, spiritual- ity/religiosity, openness, generativity, appreciation for life, and sustainability. Eight subscales with the similar labels as those of the separate factors were composed based on the results from the factor analysis.
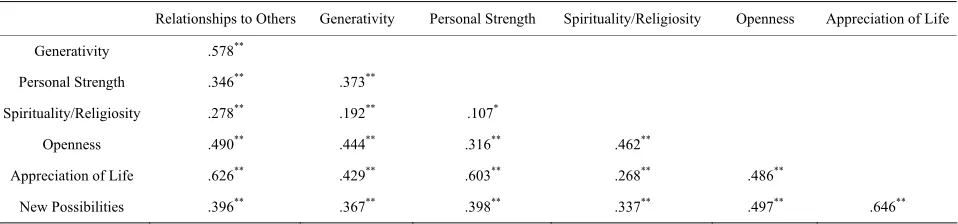
prisingly, the sustainability subscale showed very low correla- tions with other subscales of the questionnaire, a part of which was even non-significant negative, indicating that sustainability does not constitute a facet of posttraumatic growth. Conse- quently, the four items of this subscale were also eliminated. For the remaining seven inventory subscales (Table 1), positive
statistically significant inter-correlations were demonstrated (Table 2).
Preliminary Assessment of the Psychometric Properties of the PGSI
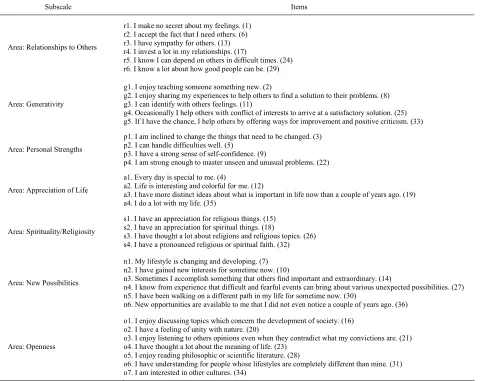
The thirty-six items of the resulting Posttraumatic Growth Status Inventory (PGSI) are listed in Table 1, along with the scale names. Response options of the items are “does not ap- ply”, “hardly applies”, “somewhat applies”, “partially applies”, “applies”, “more applies”, and “completely applies”. The short definitions of the seven subscales are as follows. The relation- ships to others subscale refers to warm, trustfully relationships to other people, the generativity subscale reflects pleasure in supporting others and in sharing one’s own knowledge and helpful life experience, the appreciation of life area links to
active lifestyle and the attempt to live each day to the fullest, and the openness area relies to open-mindedness, philosophic or scientific interests. Finally, three further subscales capture sense of personal strength, appreciation for religious/spiritual things, and recognition of new possibilities for one’s life, re- spectively. Cronbach’s alpha coefficients of the total PGSI score and its separate subscales exceeded in sample one the recommended criterion of .70 for acceptable instrument internal reliability (Nunnaly & Bernstein, 1994).
[image:6.595.64.545.343.724.2]The Cronbach’s alpha of the total PGSI score reached a value of .92, indicating a high degree of internal reliability. The known-groups validity of the PGSI was estimated via dichoto- mizing the variable “IES values” by a median split and compar- ing the PGSI subscales means of persons whose reported IES values in the first weeks after a critical event were high with those of persons with low IES values. In accordance to the ex- pectations, the PGSI values of individuals with a high level of PTSD symptoms following a stressful event were higher than the posttraumatic growth scores of persons who did not suffer from pronounced stress disorder symptoms, with the exception of the subscale “personal strength”. T-tests for independent
Table 1.
The composition of the PGSI subscales.
Subscale Items
Area: Relationships to Others
r1. I make no secret about my feelings. (1) r2. I accept the fact that I need others. (6) r3. I have sympathy for others. (13) r4. I invest a lot in my relationships. (17)
r5. I know I can depend on others in difficult times. (24) r6. I know a lot about how good people can be. (29)
Area: Generativity
g1. I enjoy teaching someone something new. (2)
g2. I enjoy sharing my experiences to help others to find a solution to their problems. (8) g3. I can identify with others feelings. (11)
g4. Occasionally I help others with conflict of interests to arrive at a satisfactory solution. (25) g5. If I have the chance, I help others by offering ways for improvement and positive criticism. (33)
Area: Personal Strengths
p1. I am inclined to change the things that need to be changed. (3) p2. I can handle difficulties well. (5)
p3. I have a strong sense of self-confidence. (9)
p4. I am strong enough to master unseen and unusual problems. (22)
Area: Appreciation of Life
a1. Every day is special to me. (4)
a2. Life is interesting and colorful for me. (12)
a3. I have more distinct ideas about what is important in life now than a couple of years ago. (19) a4. I do a lot with my life. (35)
Area: Spirituality/Religiosity
s1. I have an appreciation for religious things. (15) s2. I have an appreciation for spiritual things. (18)
s3. I have thought a lot about religions and religious topics. (26) s4. I have a pronounced religious or spiritual faith. (32)
Area: New Possibilities
n1. My lifestyle is changing and developing. (7) n2. I have gained new interests for sometime now. (10)
n3. Sometimes I accomplish something that others find important and extraordinary. (14)
n4. I know from experience that difficult and fearful events can bring about various unexpected possibilities. (27) n5. I have been walking on a different path in my life for sometime now. (30)
n6. New opportunities are available to me that I did not even notice a couple of years ago. (36)
Area: Openness
o1. I enjoy discussing topics which concern the development of society. (16) o2. I have a feeling of unity with nature. (20)
o3. I enjoy listening to others opinions even when they contradict what my convictions are. (21) o4. I have thought a lot about the meaning of life. (23)
o5. I enjoy reading philosophic or scientific literature. (28)
o6. I have understanding for people whose lifestyles are completely different than mine. (31) o7. I am interested in other cultures. (34)
Table 2.
Intercorrelations between the PGSI subscales in sample one (N = 214).
Relationships to Others Generativity Personal Strength Spirituality/Religiosity Openness Appreciation of Life
Generativity .578**
Personal Strength .346** .373**
Spirituality/Religiosity .278** .192** .107*
Openness .490** .444** .316** .462**
Appreciation of Life .626** .429** .603** .268** .486**
New Possibilities .396** .367** .398** .337** .497** .646**
Note: *
p < .05; **
p < .01.
samples showed that these differences were significant for the PGSI total score (t = 1.90; p < .05) as well as the following
subscales: relationships to others (t = 1.75; p < .05), generativ-
ity (t = 1.93; p < .05), openness (t = 3.01; p < .01), and new
possibilities (t = 1.74; p < .05). Table 3 contains more detailed information concerning the size of bivariate correlations be- tween three main kinds of PTSD symptoms (intrusions, avoid- ance and hyperarousal) and different PGSI subscales. The total score of PGSI was significant positively related to intrusion and hyperarousal symptoms, experienced during the first weeks af- ter a traumatic event, however, neither PGSI total score nor any of the PGSI subscales were statistically significant associated with avoidance symptoms.
Further, Pearson correlations between the PGSI subscales and the corresponding subscales from the retrospective growth mea- suring instrument of Tedeschi and Calhoun (1996) were com- puted as estimates of criterion validity. For generativity and openness PGSI areas, the total score of the PTGI measure from Tedeschi and Calhoun was used as criterion value. All correla- tion coefficients were highly statistically significant, they rang- ed from r = .35 (for generativity subscale) to r = .78 (for religi- osity/spirituality subscale), indicating sufficient criterion valid- ity. The results are summarized in Table 4.
Step 2: Estimating Stability of the Factorial Solution
and Assessing the Psychometric Properties of the
PGSI Based on the Data from Sample Two
Descriptive Characteristics of Sample Two
A second sample of individuals with traumatic experience was recruited with the aim to evaluate the psychometric proper- ties of the newly developed Posttraumatic Growth Status Inven- tory in groups of individuals whose trauma related to enduring stress conditions. This sample consisted of two subgroups. The first subgroup included 110 parents of children with serious mental disabilities (Down syndrome; n = 56, autism or Asper- ger syndrome; n = 54) as well as 71 parents of visually handi- capped children. Thirty-four percent of all children had other comorbid physical disabilities, such as congenital heart defects, epilepsy, cerebral palsy, sensory problems, and others. The se- cond subgroup of sample two included n = 45 individuals whose traumatic experience was related to their own severe medical condition.
The parents were on the average forty-one years old, the ma- jority was well-educated (13.58 years of formal education, on the average) and 142 (78%) were married. Seventy-five percent were mothers and twenty-five percent were fathers. Seven years
passed on the average since the child’s diagnosis. The mean age of the children was ten years.
The individuals with a disease-related trauma (n = 45) were on the average thirty-nine years, with the mean of formal edu- cation of 13.72 years. Seventy-nine percent were men. Simi- larly to the sub-sample of parents, the diagnosis dated back ap- proximately 7 years. The most frequently documented illnesses in this subgroup were HIV, cardiac diseases and cancer.
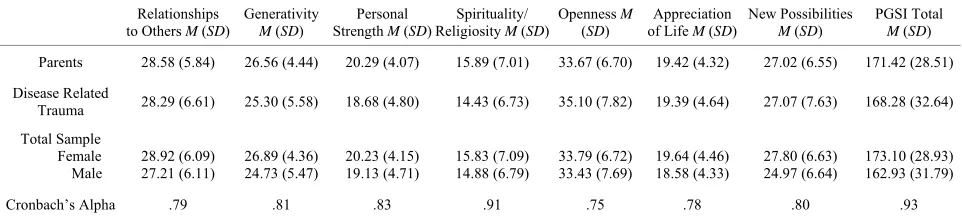
In the entire sample, the majority of participants (78%) char- acterized the first awareness of the diagnosis as a “definitely upsetting” event. The explorative analyses of relationships be- tween the PGSI and respondents’ demographic characteristics yielded a weak statistically significant correlation between PGSI total score and gender (r = .16), indicating that women’s values were slightly higher than those of the men. Table 5 demon-
strates the means for PGSI subscales depending on the kind of the traumatic event.
Confirmatory Factor Analysis and Estimation of Reliability
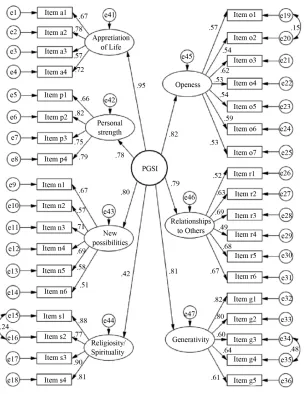
In order to estimate the stability of the factorial solution gain- ed based on the exploratory factor analysis upon the data from sample one, we conducted the confirmatory factor analysis (CFA) in the second mixed sample of individuals with traumatic ex- perience using maximum likelihood method. On the whole, the initial seven-factorial model demonstrated a reasonably good fit to the data: the RMSEA = .078; chi square = 1385 (df = 584; p
= .00); chi square /df = 2.37; GFI = .965. Figure 1 shows the
results the CFA including the factor loadings of the separate items and the subscales composition.
Cronbach’s alpha coefficients are displayed in Table 5. In-
ternal consistency reliabilities were sufficiently high and, simi- larly to the analogous estimations in sample one, the recom- mended criterion of .70 for acceptable instrument internal reli- ability (Nunnaly & Bernstein, 1994) was exceeded for all PGSI subscales. The Cronbach’s alpha reliability of the total PGSI score was with .93 very high.
Analysis of Criterion Validity, Correlations between PGSI and Indicators of Mental Health
Table 3.
Correlations between PGSI subscales and PTSD symptoms in sample one (N = 214).
Relationships
to Others Generativity
Personal Strength
Spirituality/
Religiosity Openness
Appreciation
of Life New Possibilities PGSI Total
IES Intrusions .12* .13* −.08 .08 .25** .01 .10 .14*
IES Avoidance .06 .09 −.04 .02 .04 .08 .07 .07
IES Hyperarousal .07 .05 −.20** .23** .22** −.03 .10 .11*
IES Total .11* .11* −.15* .14* .22** .03 .12* .14*
Note: In sample one (N = 214) Cronbach’s alpha coefficients of the three IES subscales reached values of .80, .72, and .80, of the IES total the value of .85. *p < .05; **p
[image:8.595.55.540.111.190.2]< .01.
Table 4.
Criterion validities of the PGSI subscales in sample one (N = 214) and sample two (N = 226).
Relationships
to Others Generativity
Personal Strength
Spirituality/
Religiosity Openness
Appreciation of Life
New
Possibilities PGSI Total
Sample One .58** .35** .47** .78** .41** .60** .66** .67**
Sample Two .63** .37** .40** .74** .40** .32** .58** .59**
Note: The coefficients represent Pearson correlations between PGSI subscales and corresponding subscales of PTGI from Tedeschi and Calhoun (1996). For generativity and openness subscales, the correlations with the total score of the PTGI were calculated.
Table 5.
The means and standard deviations for PGSI subscales and PGSI total in both sub-samples of sample two, and Cronbach’s alpha reliabilities of the PGSI subscales.
Relationships to Others M (SD)
Generativity M (SD)
Personal Strength M (SD)
Spirituality/ Religiosity M (SD)
Openness M (SD)
Appreciation of Life M (SD)
New Possibilities M (SD)
PGSI Total M (SD)
Parents 28.58 (5.84) 26.56 (4.44) 20.29 (4.07) 15.89 (7.01) 33.67 (6.70) 19.42 (4.32) 27.02 (6.55) 171.42 (28.51)
Disease Related
Trauma 28.29 (6.61) 25.30 (5.58) 18.68 (4.80) 14.43 (6.73) 35.10 (7.82) 19.39 (4.64) 27.07 (7.63) 168.28 (32.64)
Total Sample Female Male
28.92 (6.09) 27.21 (6.11)
26.89 (4.36) 24.73 (5.47)
20.23 (4.15) 19.13 (4.71)
15.83 (7.09) 14.88 (6.79)
33.79 (6.72) 33.43 (7.69)
19.64 (4.46) 18.58 (4.33)
27.80 (6.63) 24.97 (6.64)
173.10 (28.93) 162.93 (31.79)
Cronbach’s Alpha .79 .81 .83 .91 .75 .78 .80 .93
Note: “Parents”: Parents of children with mental or physical disabilities (n = 181). “Disease related trauma”: Individuals with a severe medical condition (n = 45). Cron- bach’s alpha coefficients represent the reliabilities of the PGSI subscales in the whole sample two (N = 226).
tion subscale to r = .74 for religiosity/spirituality subscale). To test whether the PGSI-subscales are substantially associ- ated with depression, anxiety and somatization symptoms, we analyzed the Pearson correlations of the PGSI-subscales with the BSI and the FBL. The results are illustrated in Table 6. The
PGSI areas were almost without any exemption statistically sig- nificant inversely associated with BSI anxiety subscale (r = −.15 to r = −.38). Additionally, all PGSI domains with exemp- tion of the religiosity/spirituality domain were statistically sig- nificant inversely related to BSI depression symptoms (r = −.20 to r = −.53). Further, all PGSI areas with exemption of the “new possibilities” subscale showed statistically significant negative correlations with BSI somatization scale (r = −.16 to r = −.30) as well as with psychosomatic symptoms measured with the FBL (r = −.12 to r = −.30). On the whole, these results indicated that a higher level of posttraumatic growth was related to a low le- vel of anxiety, depression and somatization symptomatology.
Analysis of Relationships between the PGSI and Frequency of Using Different Adaptive and Maladaptive Coping Strategies
In order to test concurrent validity, Pearson correlations be-
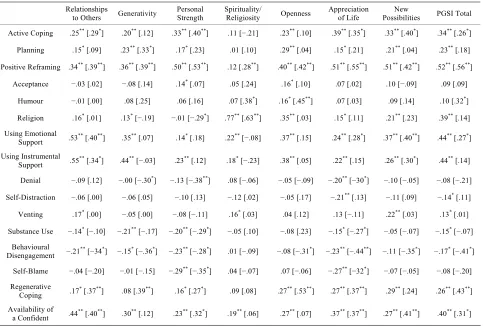
tween PGSI subscales and different coping strategies were cal- culated. As discussed in the literature on stress and coping, one and the same coping strategy may be more or less adaptive, de- pending on the special kind of the major stressful event and on the individual life situation (Meichenbaum, 1985; Antonow- sky, 1987; Connor-Smith & Flachsbart, 2007). Taking into con- sideration this knowledge from previous research with a long tradition, we decided to accomplish two separate analyses on the relationships between PGSI growth domains and coping stra- tegies, because of the very different nature of traumatic events in both subgroups (parents of children with mental and/or phy- sical disabilities and individuals whose trauma related to their own severe medical conditions). The results from the correspon- ding analyses are presented in Table 7.
Correlations between PGSI and Coping Strategies in the Parents Sub-Sample
[image:8.595.56.541.246.297.2] [image:8.595.58.539.361.471.2]Figure 1.
[image:9.595.56.540.532.629.2]Confirmatory factor analysis, factorial structure of the PGSI.
Table 6.
Correlations between PGSI subscales and mental health indicators in sample two (N = 226).
Relationships
to Others Generativity
Personal Strength
Spirituality/
Religiosity Openness
Appreciation of Life
New
Possibilities PGSI Total
BSI Anxiety −.33** −.27** −.35** −.15* −.20** −.38** −.15* −.33**
BSI Depression −.37** −.32** −.46** −.08 −.20** −.53** −.27** −.40**
BSI Somatization −.30** −.24** −.24** −.17** −.16** −.29** −.11 −.27**
FBL Psychosomatic
Complaints −.29** −.18** −.30** −.12* −.19** −.33** −.10 −.27**
Note: In the sample two (N = 226), Cronbach’s alpha coefficients of the three BSI subscales reached the values of.84, .86, and .87, of the FBL the value of .92. *p < .05; **p
< .01.
Planning, positive reframing, turning to religion, as well as us- ing emotional and instrumental support.
On the other side, there were statistically significant negative correlations of these PGSI areas with two kinds of dysfunc- tional coping behavior; substance use and behavioral disenga- gement. The personal strength subscale showed similar cor- relations with adaptive and dysfunctional coping strategies.
Table 7.
Correlations between PGSI subscales and frequency of using different coping strategies, in both subgroups of sample two (parents of children with disabilities, n = 181, and persons with a severe medical condition, n = 45).
Relationships
to Others Generativity
Personal Strength
Spirituality/
Religiosity Openness
Appreciation of Life
New
Possibilities PGSI Total
Active Coping .25** [.29*] .20** [.12] .33** [.40**] .11 [−.21] .23** [.10] .39** [.35*] .33** [.40*] .34** [.26*]
Planning .15* [.09] .23** [.33*] .17* [.23] .01 [.10] .29** [.04] .15* [.21] .21** [.04] .23** [.18]
Positive Reframing .34** [.39**] .36** [.39**] .50** [.53**] .12 [.28**] .40** [.42**] .51** [.55**] .51** [.42**] .52** [.56**]
Acceptance −.03 [.02] −.08 [.14] .14* [.07] .05 [.24] .16* [.10] .07 [.02] .10 [−.09] .09 [.09]
Humour −.01 [.00] .08 [.25] .06 [.16] .07 [.38*] .16* [.45**] .07 [.03] .09 [.14] .10 [.32*]
Religion .16* [.01] .13* [−.19] −.01 [−.29*] .77** [.63**] .35** [.03] .15* [.11] .21** [.23] .39** [.14]
Using Emotional Support .53
** [.40**] .35** [.07] .14* [.18] .22** [−.08] .37** [.15] .24** [.28*] .37** [.40**] .44** [.27*]
Using Instrumental
Support .55** [.34*] .44** [−.03] .23** [.12] .18* [−.23] .38** [.05] .22** [.15] .26** [.30*] .44** [.14]
Denial −.09 [.12] −.00 [−.30*] −.13 [−.38**] .08 [−.06] −.05 [−.09] −.20** [−30*] −.10 [−.05] −.08 [−.21]
Self-Distraction −.06 [.00] −.06 [.05] −.10 [.13] −.12 [.02] −.05 [.17] −.21** [.13] −.11 [.09] −.14* [.11]
Venting .17* [.00] −.05 [.00] −.08 [−.11] .16* [.03] .04 [.12] .13 [−.11] .22** [.03] .13* [.01]
Substance Use −.14* [−.10] −.21** [−.17] −.20** [−.29*] −.05 [.10] −.08 [.23] −.15* [−.27*] −.05 [−.07] −.15* [−.07]
Behavioural
Disengagement −.21** [−34*] −.15* [−.36*] −.23** [−.28*] .01 [−.09] −.08 [−.31*] −.23** [−.44**] −.11 [−.35*] −.17* [−.41*]
Self-Blame −.04 [−.20] −.01 [−.15] −.29** [−.35*] .04 [−.07] .07 [−.06] −.27** [−32*] −.07 [−.05] −.08 [−.20]
Regenerative Coping .17
* [.37**] .08 [.39**] .16* [.27*] .09 [.08] .27** [.53**] .27** [.37**] .29** [.24] .26** [.43**]
Availability of a Confident .44
** [.40**] .30** [.12] .23** [.32*] .19** [.06] .27** [.07] .37** [.37**] .27** [.41**] .40** [.31*]
Note: The coefficients without any brackets represent the Pearson correlations in the sub-sample of parents. The coefficients in square brackets represent the corre- sponding Pearson correlations in the sub-sample of persons with a disease-related trauma. *p < .05, **p < .01.
(r = .22 for using emotional support and r = .18 for using instru- mental support). The correlations between this PGSI subscale and maladaptive coping strategies were not significant.
The openness PGSI domain was positive statistically signifi- cant related to eight adaptive coping strategies (active coping, planning, positive reframing, acceptance, turning to religion, using emotional and instrumental support, and humour) and it was not related to any kind of dysfunctional coping behavior. The appreciation of life and the new possibilities PGSI sub- scales showed positive associations with six adaptive coping strategies (active coping, planning, positive reframing, turning to religion, using emotional and instrumental support). In addi- tion, for the appreciation of life area, but not for the new possi- bilities PGSI area, the negative statistically significant correla- tions with four maladaptive coping strategies (denial, substance use, behavioral disengagement, and self-blame) were demon- strated. Five of seven growth subscales (relationships to others, personal strength, openness, life appreciation, and new possi- bilities) as well as the PGSI total score were positively corre- lated with regenerative coping (r = 16 to r = .29). Finally, the PGSI total score was positive, statistically significant associ- ated to six potentially adaptive coping strategies (active coping, planning, positive reframing, turning to religion, using emo- tional and instrumental support) and it was significant nega- tively correlated with two kinds of dysfunctional coping (sub-
stance use and behavioral disengagement).
Correlations between PGSI and Coping Strategies in the Sub-Sample of Persons with Their Own Disease-Related Trauma
Following correlation patterns between PGSI areas and dif- ferent kinds of coping behavior were demonstrated in the sub- sample of 45 persons with a severe medical condition (Table 7).
and openness subscales were negatively related to behavioral disengagement (r = −.36 and r = −.31). The religiosity/spiritu- ality subscale was positively correlated with three adaptive co- ping strategies (positive reframing, humour, and turning to reli- gion). However, similarly to findings from the parents sub-sam- ple, it was not associated with any dysfunctional coping strate- gies. For five PGSI areas (with exemption of religiosity/spiri- tuality and new possibilities subscales, respectively), positive statistically significant correlations with regenerative coping were demonstrated (r = .27 to r = .53).
Are There Systematic Differences in Pattern of Correlations between PGSI and Various Coping Strategies across both Groups: Parents of Children with Mental and/or Physical Disabilities vs. Individuals with a Disease-Related Trauma?
Data analyses revealed several similarities in patterns of cor- relations between both subgroups constituting the second sam- ple: parents of children with mental and/or physical disabilities vs. individuals with their own disease-related trauma. Thus, the personal strength and life appreciation subscales were most con- sistently negative correlated with maladaptive coping strategies in both groups. Alike, the “relationships to other” PGSI sub- scale showed consistent positive associations with adaptive co- ping behavior in parents as well as in the outpatients group.
Interestingly, statistical analyses offered also several differ- ences in pattern of correlations between both subgroups. Where- as functional coping strategies “planning”, as well as “coping through active seeking emotional and instrumental support” were consistently positive correlated with PGSI factors in the parents sample, they were not statistically significant associated to the most of PGSI factors in the sample of persons with their own disease-related trauma. By contrast, coping through humo- rous handling of burdensome life situations was more frequent- ly linked to PGSI subscales for the outpatients sample than for the sample of parents. Additionally, denial and behavioral dis- engagement as maladaptive coping strategies were definitely more strongly related to PGSI subscales in the outpatients group than in parents of children with disabilities.
Regarding differences in the relative impact of the separate PGSI domains, the generativity and openness subscales yielded a stable pattern of positive, statistically significant correlations with several kinds of adaptive coping behavior in parents’ sam- ple, but not in the sample of individuals whose traumatic ex- perience was related to their own severe medical condition.
Discussion
The aims of the study described in this paper were to develop and to evaluate a measuring instrument that allows for captur- ing the current status in processes of growth in the aftermath of traumatic experience. Unlike contemporary available retrospec- tive growth questionnaires (the PTGI, the SRGS and the BSI), the new measure was designed to estimate the actual profile of different growth related aspects. Accordingly, when completing the PGSI, respondents do not need to remember their crucial experience and to recall how they were prior to the stressful event; they should simply describe their actual behavior, think- ing and feeling. This kind of item format was chosen in order to avoid distortion through potential cognitive biases, documented in previous investigations (McFarland & Alvaro, 2000; Smith & Cook, 2004). Additionally, taking into account findings from recent empirical literature on posttraumatic growth (Cadell &
Sullivan, 2006; Danoff-Burg & Revenson, 2005; Updegraff et al., 2002; Pakenham, 2007), the initial item pool contained items asking for self-awareness, world view and the way of treating others, beside the items focused on already well-known growth areas (such as relationships to others, personal strength, and appreciation of life) as they are addressed in the currently most established retrospective measure of PTG from Tedeschi and Calhoun (1996). The findings provide evidence of sound reliability, as well as good convergent and concurrent validity of the Posttraumatic Growth Status Inventory subscales. The results of the confirmatory factor analysis yielded support for stability of the initial factorial solution. Interestingly, five ex- tracted factors, e.g. personal strength and appreciation of life, correspond to the growth facets which were identified in factor analyses upon growth related items in other studies (e.g., Te- deschi & Calhoun, 1996). This attests to the soundness and satis- fying validity of the construct ‘posttraumatic growth’. The PGSI contains seven subscales and permits the capturing of personal changes in the following growth domains: relationships to oth- ers, spirituality/religiosity, appreciation of life, generativity, openness, personal strength, and new possibilities. In compari- son to the “classical” retrospective posttraumatic growth meas- ure from Tedeschi and Calhoun (1996), the PGSI assesses growth associated processes in two additional areas, generativity and openness. The 7-stage item response format permits a precise differentiation between various degrees in the distinct growth related characteristics.
Comparison of mean PGSI scores showed significant differ- ences between participants who suffered from less or more symptoms of posttraumatic stress disorder in the first time after a traumatic event. Thereby, the known-groups validity of the newly developed questionnaire could be demonstrated. Further, the acceptability of the PGSI is demonstrated by minimal miss- ing data (2.7% in sample one and 2.4% in sample two). On the whole, the study provides empirical evidence for good psycho- metric properties and practicability of the newly developed growth status inventory.
validity of individual reports on growth related processes could be increased by the means of using item format which focuses on the actual experience and not on perceived inner changes.
Additionally, the newly developed measure may be very use- ful for capturing positive personal changes in samples of indi- viduals whose trauma relates in a particular degree to experi- ence of stigmatization, like potentially stigmatizing diseases (e.g., mental disorders, HIV) as well as social or sexual abuse. As documented in empirical literature, the proceeding of the stigma-associated feelings of “spoiled identity” (Goffman, 1986) often lead to inducing the re-examination of old values and pri- orities and to efforts of creating a new definition of self iden- tity. The active establishment of an alternative identity as a po- sitive adjustment instead of a resignation requires openness to a new experience and enhanced tolerance towards other ways of life and other ways of communication. Since the PGSI contains a separate openness subscale which addresses this special com- ponent of positive individual psychological changes, this inven- tory may be more appropriate in capturing the corresponding processes than the conventional posttraumatic growth and be- nefit finding measuring instruments. Although a part of our stu- dy’s participants were individuals who experienced traumas with such stigmatization potential, further research is required to provide additional evidence concerning the applicability of the PGSI in these specific populations.
Another area of application for the PGSI may be longitudinal studies designed to investigate different stages in processes of posttraumatic growth in persons with enduring stress conditions subsequent to an acute traumatic event, such as a case of severe disability-related health problems in a person her/himself or in a close family member. Two groups of persons with analogous kinds of traumatic experience were participants of our study: parents of children with psychological and physical disabilities as well as individuals whose trauma related to their own severe medical conditions. In both samples, good psychometric prop- erties of the PGSI were demonstrated. Additionally, the data analyses offered the ability of the PGSI to differentiate between individuals with dissimilar kinds of traumatic experience. The pattern of correlations between the separate PGSI subscales and various potentially adaptive and maladaptive coping strategies were partially different in parents and outpatients samples. Thus, “coping though active seeking instrumental or emotional support” and “planning” were more consequently related to the separate growth domains in the parents sample than in the sam- ple of individuals with an illness-related trauma. It may point to important differences in potential adaptive significance of cop- ing behavior. For parents caring for children with mental dis- abilities, positive personal changes in terms of growth may involve acquirement of such essential skills as mobilization of their social networks for help in caring the child and for infor- mational support. The efforts to mobilize the social environ- ment would be inevitably related to the necessity to overcome feelings of shame due to the ‘particular kind’ of the child’s disability and to accept the new after-child-diagnosis life situa- tion. To undergo this experience could require personal strength and individual development in terms of personal growth. Atten- tion-grabbing is also another systematic dissimilarity, and pre- cisely in use of denial as a coping strategy that was more con- sistently negatively linked to PTG areas in the outpatients’ sam- ple than in the parents’ sample. What may imply denial for persons raising children with autism or Down syndrome? It could basically imply the recognizing the feeling that “my child
is o.k.”. In fact, this kind of perception neither necessarily leads to dysfunctional behavior, nor it should be an indication of re- sistance to the processes of trauma-related growth. Conversely, if persons with a severe disease respond with denial to their diagnosis or to their physical symptoms, it may be frequently linked to a lack of compliance with medical treatment as well as to the insistence on several old maladaptive unhealthy habits as a phenomenon that is opposite to personal changes in terms of stress-related growth.
Limitations and Considerations
Despite generally promising study results, several limitations should also be kept in consideration concerning the findings re- ported above.
First, a mixed sample of undergraduate students and adults with significant traumatic experience were used at the stage of item selection. It might stand to reason to query whether the students can be representative for the population of traumatized individuals. However, it is not unusual, to use the students sam- ples at the initial phase in the development of psychological measuring instruments (Stanton et al, 2000; Tedeschi & Cal- houn, 1996). Furthermore, students are comparable to the gen- eral population pertaining to experience with trauma (Vrana & Lauterbach, 1994).
Second, a cross-sectional study design was used to evaluate the psychometric properties of the PGSI. A cross-sectional in- vestigation does not permit any unambiguous conclusions in terms of causality. Consequently, the direction of relationships between separate PGSI areas and indicators of mental health, such as anxiety, depression and psychosomatic symptoms as well as between PGSI and different coping strategies remained unclear. Future longitudinal studies with repeated measure- ments are warranted to test corresponding causation hypotheses. Additional longitudinal studies may also be necessary to pro- vide more information about the alterability of the PGSI values across various periods of time.