http://dx.doi.org/10.4236/ojapps.2016.67039
Area Classification of Surrounding Parking
Facility Based on Land Use Functionality
Jingjing Yin, Yulong He, Xiaoduan Sun
College of Metropolitan Transportation, Beijing University of Technology, Beijing, China
Received 7 June 2016; accepted 11 July 2016; published 14 July 2016
Copyright © 2016 by authors and Scientific Research Publishing Inc.
This work is licensed under the Creative Commons Attribution International License (CC BY).
http://creativecommons.org/licenses/by/4.0/
Abstract
The different land use surrounding parking facility has significant impact on parking behavior. This paper studies the functional classification of land use surrounding parking facility, which is fundamentally important for in-depth research on parking behavior. 37 parking facilities located between the second and sixth ring roadway in Beijing were selected for this study. Based on the surveys conducted at these parking facilities, various parking behavior were analyzed, based on which the scope of the different parking was determined. The information on location, land use characteristics, public transport, the surrounding parking situations are collected for each inves-tigated parking facility. Applying the SPSS clustering method, the threshold was developed for the classification. Totally, five categories are proposed for the land use functionality surrounding parking facility as the results of this study.
Keywords
Parking Lot, Functionality, Land Use, SPSS, Classification
1. Introduction
The different land use surrounding parking facility has significant impact on parking behavior. The different land use surrounding parking facility can produce different parking demand, and it also can make the parking behavior significantly different.
po-lygon, it solves the coincidence problem of catchment areas, and then presents a delineating method for potential catchment area [2]; Miao lixin said that the land use, the economic factors, and the traffic condi-tions should be considered to arrange parking facilities, and establish corresponding policies and strategies to solve the problem of parking [3]; Huang Rongqing said that the function of a certain zone within an area depends on the location, resources, geographical and natural environment, historic development as well as its functionality in the area [4]; Meng Fanru researched the type of function structure and the layout cha-racteristics of functions, which is about the core area of high-speed railway station. He researched it in a systematic way by using comparative analysis and ease study, and investigated the pattern of space use and development intensity of the core area of high-speed railway station [5]; Wu yang pointed the characteris-tics of fringe area function, the principles for identifying types of urban fringe, and evaluated its functions
[6].
At present, for the research of the land use surrounding the parking facility, basically in the level of qualita-tive research, the basis of classification is not clear, and the classification is simple. Studying the functional classification of land use is the premise and foundation for in-depth research on parking behavior, and the paper is based on the international and domestic researches. In view of the domestic development trend of the parking area function, carrying on the quantitative research about the division of the area surrounding the parking lot, the related basis and specific recommendations of the classification are put forward, hoping to provide reference for other cities.
2. Survey Scheme
37 parking facilities located between the second and sixth ring roadway in Beijing were selected for this study. The properties of the parking facilities include commercial, office, residential, Culture and sports, hospitals, and mix.
2.1. Determining the Influenced Scope of the Parking Lot
From the parking lot to the destination all the completion of this process is to be with man’s activities for ma-terial carrier, it means the people acceptable range on foot. Therefore, the influence range around the parking lot can be determined according to the suitable walking distance.
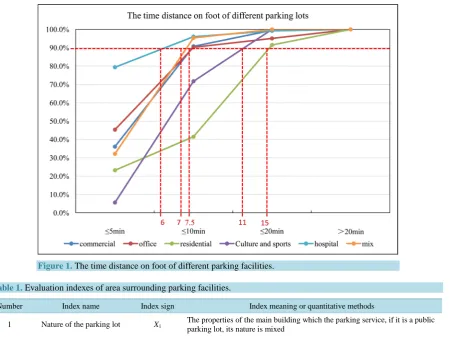
In this paper, through the way of the actual distribution-recycling questionnaire, 3475 questionnaires were gotten, and these questionnaires are from 140 parking lots. Get the time of drivers from the parking lot walking to the destination, as shown in Figure 1, Select the 90% walking time conversion into distance, and it is the in-fluence of the parking lot.
The 90% of the walking time distance with different properties of parking facilities [7], the hospital is about less than 6 minutes, the mix is less than 7 minutes, the office and commercial are less than 7.5 minutes, the cul-ture and sports is about less than 11 minutes, the residential is about less than 15 minutes.
Specified in the “Highway capacity Manual” [8]: The pedestrian walking speed depends on the pedestrian in the elderly (above 65 years old). If 0% ~ 20% of the pedestrian is the elderly, to calculate the pavement, the pe-destrian walking speed can use1.2 m/s; If more than 20% of the pepe-destrian is the elderly, the pepe-destrian walking speed can use 1 m/s. This paper, according to data from the survey, the percent of the pedestrians higher than 60 years old is 11%, obviously, the percent of the pedestrians higher than 65 years old will be more than 11%, So the pedestrian walking speed can use 1.2 m/s. So the formula of 90% total walking distance is time (min) × 60 × 1.2, obtained by calculations, the influence of the parking lot of commercial, office, residential, culture and sports, hospital, mixed [9], is 540 meters, 540 meters, 1080 meters, 792 meters, 432 meters, 504 meters respec-tively [10].
2.2. The Data Investigation and Sorting Surrounding Parking Facility
Figure 1. The time distance on foot of different parking facilities.
Table 1. Evaluation indexes of area surrounding parking facilities.
Number Index name Index sign Index meaning or quantitative methods
1 Nature of the parking lot X1 The properties of the main building which the parking service, if it is a public
parking lot, its nature is mixed
2 Bus traffic X2 The number of bus lines surrounding the parking lot
3 Subway traffic X3 The number of subway lines surrounding the parking lot
4 Location X4 The linear distance from the central city to the parking lot, the unit is km
5 Number of parking spaces X5 The actual number of parking Spaces
6 Distribution of the parking lot X6 Number of other parking facilities around within the scope of influence
We obtain the basic data for the further research from the data of the 37 parking facilities through investigat-ing and normalizinvestigat-ing the data of the six indicators. They are the six initial index variables.
3. The Classification of the Area Surrounding Parking Facility
3.1. Clustering Analysis
Using a two-stage clustering method to categorize the parking lot, using SPSS software, parking lot can be di-vided into 5 groups, specific classification is as follows:
Class 1: parking lot: 1, 2, 4, 5, 7, 21, 26, 27, 32, 33, a total of 10. Class 2: parking lot: 28, 34, 35, a total of 3.
Class 3: parking lot: 3, 8, 9, 10, 11, 16, 17, 20, 22, 24, 29, a total of 11. Class 4: parking lot: 30, 36, a total of 2.
Class 5: parking lot: 6, 12, 13, 14, 15, 18, 19, 23, 25, 31, 37, a total of 11.
According to the initial investigation results and the development intensity of the parking facilities, deter-mined the value of five types, shown in Table 2, the value will be used later.
3.2. Factor Analysis
be-tween the variables, reduce the number of variables, after receive the transformation principal components, shown in Table 3.
As you can see by the above form, the cumulative contribution rate of factor 1 ~ 4 was 89.847%, more than 85%, therefore the four factors can be used instead of the initial variables, four factors were expressed in Z1 ~ Z4,
and the factor score coefficient is shown in Table 4.
Linear correlation analysis the assignment results of the parking lot development intensity and principal component, the results as shown in Table 5.
As you can see from Table 5, the significance level of Z4 is 0.509, and it shows that Z4 has significantly lower
levels. Selecting Z1/Z2/Z3 as the independent variables with significantly higher levels, and then we can get the
Y equation which is about the development strength of the parking lot, as shown below:
595 . 4 473 . 0 389 . 0 765 .
0 1− 2+ 3+
−
= Z Z Z
Y
(1) The Z1, as well as Z2 and Z3, is a linear combination of the initial variable, according to Table 4.
Table 2. Assignment of clustering results.
Clustering results Class 1 Class 2 Class 3 Class 4 Class 5
Assignment results 5 2 3 1 4
Table 3. Total variance explained.
Component
Initial Eigenvalues Extraction sums of squared loadings Rotation sums of squared loadings
Total % of Variance Cumulative % Total % of Variance Cumulative % Total
1 2.534 42.241 42.241 2.245 37.417 37.417 1.521 25.346 25.346
2 1.485 24.758 66.999 1.235 20.575 57.993 1.162 19.362 44.707
3 0.696 11.602 78.601 0.490 8.168 66.160 1.099 18.311 63.019
4 0.675 11.246 89.847 0.066 1.106 67.266 0.255 4.247 67.266
5 0.438 7.299 97.147
[image:4.595.89.540.263.730.2]6 0.171 2.853 100.000
Table 4. Component score coefficient matrix.
Component
Z1 Z2 Z3 Z4
X1 −0.043 −0.044 0.108 0.014
X2 0.354 0.279 −0.349 −0.081
X3 0.677 −0.322 0.167 0.068
X4 0.129 0.106 0.793 −0.130
X5 −0.010 −0.014 0.003 0.370
X6 −0.239 0.764 −0.082 0.129
Table 5. Coefficients.
Model
Unstandardized coefficients Standardized coefficients
t Sig.
B Std. Error Beta
(Constant) 4.595 0.169 27.202 0.000
Z1 −0.765 0.202 −0.545 −3.784 0.001
Z2 −0.389 0.209 −0.271 −1.861 0.042
Z3 0.473 0.198 0.339 2.393 0.023
Table 6. Category classification.
Classification Y range
I <4.4
II 4.4 ~ 4.5
III 4.5 ~ 4.6
IV 4.6 ~ 4.7
V >4.7
6 5 4 3 2 1 3 6 5 4 3 2 1 2 6 5 4 3 2 1 1 082 . 0 003 . 0 793 . 0 167 . 0 349 . 0 108 . 0 764 . 0 014 . 0 106 . 0 322 . 0 279 . 0 044 . 0 239 . 0 010 . 0 129 . 0 667 . 0 354 . 0 043 . 0 X X X X X X Z X X X X X X Z X X X X X X Z − + + + − = + − + − + − = − − + + + − = (2)
Combined with formula (1) and formula (2) it is concluded that Y about initial variable equation is as follows:
595 . 4 109 . 0 140 . 0 191 . 0 291 . 0 572 . 0 106 .
0 1− 2− 3+ 4+ 5− 6+
= X X X X X X
Y . (3)
Put the normalized data into the basis of the above equations, get the finally division standard of the sur-rounding area of parking lot, according to the development intensity, it is divided into classification I~V from small to large, as shown in Table 6.
4. Conclusions
This paper investigated the 37 parking facilities in Beijing, and chosen six indexes, including nature of the parking lot, bus traffic, subway traffic, location, number of parking spaces and distribution of the parking lot. Through those, area of surrounding parking facility was classified based on land use functionality. This paper first, through the questionnaire survey and analysis, determined the influence area of different nature of the parking, the influence of the commercial parking lot, office parking lot, residential parking lot, culture and sports parking lot, hospital parking lot, and mixed parking lot is 540 meters, 540 meters, 1080 meters, 792 me-ters, 432 meme-ters, 504 meters respectively; second, investigated the variables data of the parking lot, and after fi-nishing the survey data normalization processing, used SPSS to eliminate the correlation between indicators and establish a classification function; thirdly, through the function that can be seen, the nature of the parking lot, parking location, and number of parking spaces are positively related to the classification results, the public transit around the parking lot and the parking situation are negatively related to the classification results, the bus conditions affected the most significant, the impact of nature of the parking lot was not significant; and the last, this paper divided the area surrounding the parking lot into 5 classification and determined the threshold.
In this paper, due to the data acquisition is difficult, there are also some disadvantages, for example, sample size is not very enough and the results are not verified, about these problems, we will to do further research in the future.
References
[1] Song, H. (2008) Research on the Theory and Method of Definition for Traffic Impact Area. Master Thesis, Dalian Jiao tong University, Dalian.
[2] Wang, S.W., Sun, L.S. and Rong, J. (2013) Catchment Area Analysis of Beijing Transit Stations. Journal of Trans-portation Systems Engineering and Information Technology, No. 3, 183-188.
[3] Miao, L.X. and Liu, B. (1999) Land Use Patterns and Parking Planning for City CBD. City Planning Review, No. 23, 50-52, 63.
[4] Hang, R.Q. (2007) The Area Function and City Layout of Beijing. Journal of Capital University of Economics and Business, No. 9, 49-54.
[5] Meng, F.R. (2011) Functional Layout Planning Study for Urban Core Area of High-speed Railway Station. Master Thesis, Chang’an University, Chang’an.
[6] Wu, Y. (2010) An Urban Fringe Functions Research of Wuhan City.
Plan-ners, No. 22, 87-90.
[8] Ren, F.T, Liu, X.M. and Rong, J. (2007) Highway Capacity Manual (HCM 2000). China Communications Press, Bei-jing.
[9] Zhou, Z.H. and Wang, B. (2004) The Parking Demand Calculation Under Comprehensive Land Development. Trans-poWorld, No. 11, 49-51, 20.
[10] Yin, J.J., He, Y.L. and Sun X.D. (2016) Effect Area Analysis of Beijing Parking Lot. Journal of Beijing University of Technology, No. 42, 433-439.
[11] Chen, Y.X., He, Y.L. Sun, X.D. and Ma, X.L. (2014) A Multi-Index Evaluation for the Level of Service of Sidewalks Based on the Clustering Method. Journal of Beijing University of Technology, No. 40, 549-554.
Submit or recommend next manuscript to SCIRP and we will provide best service for you:
Accepting pre-submission inquiries through Email, Facebook, LinkedIn, Twitter, etc. A wide selection of journals (inclusive of 9 subjects, more than 200 journals) Providing 24-hour high-quality service
User-friendly online submission system Fair and swift peer-review system
Efficient typesetting and proofreading procedure
Display of the result of downloads and visits, as well as the number of cited articles Maximum dissemination of your research work