http://dx.doi.org/10.4236/wjm.2016.65015
Viscosity Transient Phenomenon in Drop
Impact Testing of Soft Material
Chen Liu, Yukio Fujimoto, Yoshikazu Tanaka, Eiji Shintaku, Toshiki Nakanishi Department of Transportation and Environmental Engineering, Graduate School of Engineering, Hiroshima University, Higashi-Hiroshima, Japan
Received 1 April 2016; accepted 6 May 2016; published 9 May 2016
Copyright © 2016 by authors and Scientific Research Publishing Inc.
This work is licensed under the Creative Commons Attribution International License (CC BY).
http://creativecommons.org/licenses/by/4.0/
Abstract
The authors carried out drop impact tests for several soft materials under a flat frontal impact condition in which a drop hammer with a flat bottom surface strikes a plate-like soft material in the normal direction. The experimental results indicated that the impact force waveforms of soft materials consisted of a thorn-shaped waveform and a subsequent mountain-shaped waveform. The thorn-shaped waveform was strongly affected by the strain rate. In the present study, the oc-currence mechanism of this distinctive waveform was discussed from the viewpoint of the viscos-ity transient phenomenon. A standard linear solid (SLS) model in which the viscosviscos-ity transient phe-nomenon was considered was applied to the simulation. Some features of the impact force waveform of soft materials could be explained by the SLS model. Furthermore, the thorn-shape waveform could also be observed in the impact force waveforms of human skin and free-falling hollow balls.
Keywords
Strain Rate Dependence, Soft Material, Impact Force, Thorn-Shape Waveform, Viscosity Transient, Standard Linear Solid (SLS) Model, Flat Frontal Impact
1. Introduction
The authors develop an impact force sensor that can accurately measure a high-speed impact force waveform and apply the sensor to impact tests of several soft materials. Experiments are carried out using compact drop test equipment under a flat frontal impact condition [1]-[3].
plate, a silicon rubber plate, a nitrile rubber plate, tofu, konjac, an oil clay plate, a low-rebound urethane foam plate, a cork plate, sliced ham, pork ham steak, and pork. With the exception of the cork plate, all of these mate-rials exhibit a thorn-shaped waveform and a subsequent mountain-shaped waveform [1]-[3].
In the impact testing of soft materials, a thorn-shaped waveform (spike-like feature) has appeared in previous experiments [4]-[6]. Song et al. concluded that this feature was a result of the radial inertia effect [4]. However, the authors believe that this unique waveform is a result of the double-strike phenomenon caused by the viscos-ity transient phenomenon [3]. When a soft material receives an impact force, a large viscous resistance is in-duced at the beginning of the impact. The viscous resistance then decreases rapidly with time. Furthermore, the authors demonstrate that the feature of the impact force waveform can be qualitatively simulated by a standard linear solid (SLS) model [2]. In the SLS model, the damping coefficient of a dashpot is treated as time depen-dent.
In the present study, the influences of strain rate and impact area on the thorn-shaped waveform are discussed based on the SLS model and the experimental results.
2. Impact Force Waveform of Soft Materials under Flat Frontal Impact
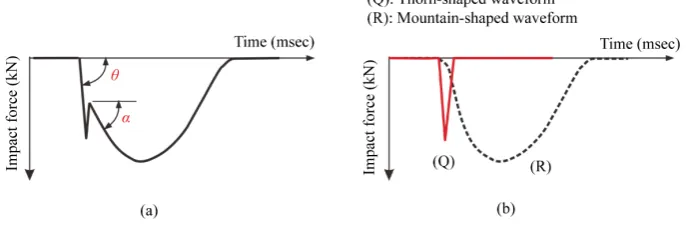
Figure 1(a)shows a typical impact force waveform of soft material under a flat frontal impact [1]-[3]. Figure
1(b) summarizes the feature of thorn-shaped waveforms obtained by the experimental observations. The impact force waveform of soft materials is the mixture of two types of waveforms. The first (thorn-shaped) waveform shows a large viscosity resistance (red isosceles triangle Q), and the second (mountain-shaped) waveform shows a small viscosity resistance (dashed black curve R). This resistance change occurs suddenly at the thorn peak. In other words, a viscosity transient is induced at the thorn peak. The soft material surface is struck twice by the relative movement of the colliding objects.
The thorn-shaped waveform has a steep slope on the rising segment (which is θ), which usually approximates a straight line. The θ and the thorn peak become large as the strain rate increase. The second part of the wave-form has a gentler slope (which is α) and is mountain shaped. The slope α becomes gentler than the initial slope
θ because a viscosity discontinuity is induced by the first strike.
3. Compact Drop Test Equipment and Condition of Flat Frontal Impact
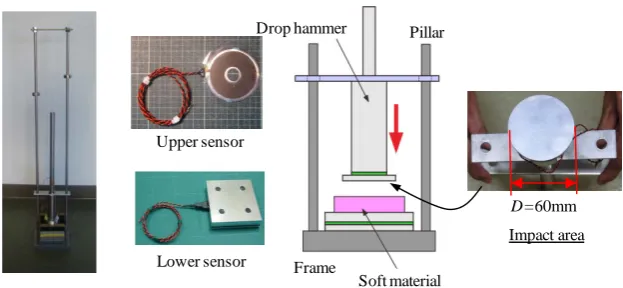
Figure 2shows the free-fall drop test equipment used in the present study. The drop hammer is made of an
alu-minum circular disk plate, a stainless cylinder weight, and a steel bar (total mass: 1.9 kg). The contact surface of the hammer bottom is a disk plate having a diameter of D = 60 mm. The upper sensor is an orbicular pad sensor and is attached near the bottom of the drop hammer. The lower sensor is a 100 mm × 100 mm pad sensor and is attached to the bottom of the frame. Both sensors are made from piezoelectric film. A high-speed voltage re- corder with a sampling rate of 20 kHz to 200 kHz is used to record the sensor output. The output of the upper sensor is modified by 8% in order to account for the mass of the disk plate. Rigorous tests using a servo-con- trolled testing machine and a high-rigidity load cell confirmed that both sensors can measure the impact force very accurately when the contact time is in the range of 0.1 ms to 2 s. The drop height h is the height from the upper surface of the soft material to the bottom surface of the drop hammer.
[image:2.595.142.486.582.695.2]The soft materials are square shaped and their surface areas are larger than the area of drop hammer bottom.
Figure 1. (a) Typical impact force waveform of soft material under a flat frontal impact. (b)
Figure 2. Drop test equipment and the upper and lower sensors used in the device.
4. Simulation of Impact Force Waveform by the SLS Model
Figure 3 shows the condition under which the drop weight (mass: m = 1.9 kg) collides with a plate-like soft
material at speed V0. The thickness of the soft material is T. The soft material is modeled by the SLS model. The
mass (drop weight) is not connected to the spring and dashpot. The SLS model adds an elastic spring k1 to the
Maxwell model (a viscous damper c and an elastic spring k2) in parallel. The impact velocity V0 is given to the
mass as the initial condition. The differential equation of the SLS model is given as Equation (1), where x2 is the
displacement of the hammer position, and x1 is the displacement of the dashpot. The initial strain rate is ε0 = V0/T (s−1). The Runge-Kutta method is used for solving the equation of motion. The time increment in the
cal-culation is 5 × 10⁻⁶ s. The software was developed by the authors using Visual Basic.
(
)
(
2 1 2)
2 2 12 2 1 1
0
mx k x k x x
k x x cx
+ + − =
− =
(1)
The spring coefficients k1 and k2 are assumed to be constant throughout the collision. As mentioned above, we
believe that the viscosity transient occurs during the early stage of the impact force. This influence is taken into consideration through the damping coefficient c of the dashpot, which is treated as a time-dependent value.
5. Comparison of Experimental and Simulation Results
5.1. Influence of Impact Velocity on the Thorn-Shaped Waveform
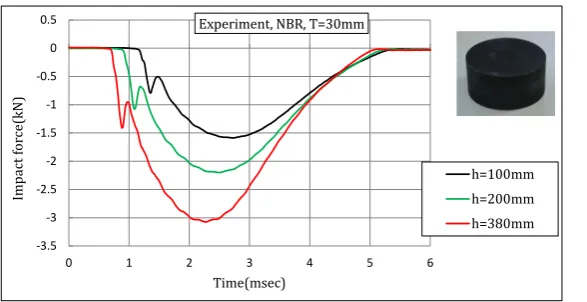
Figure 4 compares the impact force waveforms of the upper sensor measured by compact drop test equipment.
The soft material is a nitrile rubber (NBR) square plate with one side 100 mm. The thickness is T = 30 mm (rubber hardness: 70). The drop height is h = 100, 200, or 380 mm. The impact velocity is V0 = 1.4 m/s when h =
0.1 m (strain rate: ε0 = V0/T = 46 s−1), V0 = 1.98 m/s when h = 0.2 m (ε0 = 66 s
−1), and V
0 = 2.73 m/s when h
= 0.38 m (ε0 = 91 s
−1). A thorn shape is clearly observed in the rising segment of the waveform. In the
experi-mental figure, when the drop height h becomes large, the slope θ of the rising segment becomes steeper and the height of the thorn peak becomes larger. The heights of thorn peak and mountain peak are roughly proportional with the impact velocity V0.
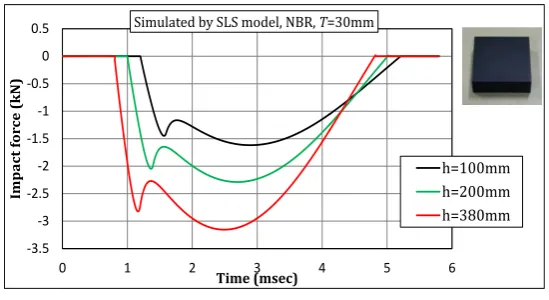
Figure 5 shows the impact force waveforms simulated by the SLS model for the three cases. Figure 6shows
the values of the assumed parameters in the SLS model. The spring coefficients are k1 = 1000 kN/m and k2 =
3000 kN/m. The damping coefficient c of the dashpot is assumed to be a time-dependent value, which changes during the impact period. When 0 < t < 0.2 ms, c = 2000 kg/s. During the period 0.2 < t < 0.4 ms, c decreases linearly from 2000 kg/s to 300 kg/s. During the period t > 0.4 ms, c = 300 kg/s. The period 0.2 < t < 0.4 ms is the period of the viscosity transient.
The simulation was conducted by varying k1, k2, and c in order to search for the condition in which the
simu-lated waveform becomes close to the experimental waveform. In other words, k1, k2, and c are decided such that
the thorn height, the subsequent mountain height, and the total impact period of the waveform match those of the experiments.
Lower sensor Upper sensor
Drop hammer Pillar
Frame
Soft material
Impact area
Figure 3. SLS model for the simulation of impact force waveform of soft material.
Figure 4. Impact force waveform measured by the weight drop onto NBR
[image:4.595.182.451.82.224.2]plate with T = 30 mm.
Figure 5.Impact force waveform of NBR plate simulated by the SLS model.
A thorn-shaped waveform is clearly observed in the simulation. Note that, in the simulation, the slope θ of the thorn becomes steeper and the thorn height becomes larger according to the increase in the impact velocity V0
(or strain rate ε0). The total impact period is approximately the same as that of the experiments. The height of
the thorn peak is roughly proportional to the impact velocity V0 (=h1/2) in both the experiments and the
simula-tion. In other words, the shape of the thorn is related to the strain rate of the soft material.
In Figure 5, the impulse of the simulated waveform is larger than that of the experimental waveform. One
reason for this difference is considered to be that the SLS model cannot exactly represent the coefficient of res-titution of the drop hammer after the collision.
-3.5 -3 -2.5 -2 -1.5 -1 -0.5 0 0.5
0 1 2 3 4 5 6
Im
p
act
for
ce
(
kN)
Time (msec) Experiment, NBR, T=30mm
h=100mm h=200mm h=380mm
-3.5 -3 -2.5 -2 -1.5 -1 -0.5 0 0.5
0 1 2 3 4 5 6
Im
pa
ct
for
ce
(k
N)
Time (msec)
Simulated by SLS model, NBR, T=30mm
[image:4.595.176.452.261.413.2] [image:4.595.176.451.450.600.2]Figure 6.Spring coefficients k1 and k2 and damping coefficient c
assumed for the NBR plate with T = 30 mm.
5.2. Influence of Impact Area on the Thorn-Shaped Waveform
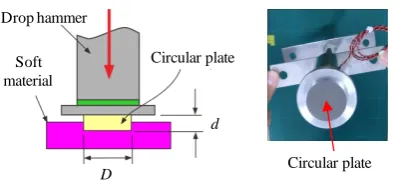
Circular aluminum plates having a diameter of D = 20, 30, 40, or 50 mm and a thickness of d = 5 to 8 mm was attached to the bottom of the drop hammer, as shown in Figure 7. The hammer was dropped from a height of h
= 380 mm onto a 30 mm-thick NBR plate. The purpose of this experiment was to determine how the impact force waveform is influenced by the impact area. Since the circular plate is thick, the impact force acts only on the circular plate and does not reach the bottom of the drop hammer.
Figure 8 shows the measured impact waveforms. Solid curves correspond to the upper sensor, and dashed
curves correspond to the lower sensor. Since the diameter of the aluminum disk is small, the disk is buried deeply into the NBR. Therefore, according to the reduction of the impact area, the contact time of the waveform becomes long and the peak force becomes small. In addition, the thorn peak becomes lower as the impact area becomes smaller. This suggests that the thorn becomes unclear for the case in which the drop hammer has a spherical bottom surface.
Figure 9 shows the impact force waveforms simulated by the SLS model. The assumed k1, k2, and c are
summarized in Table 1. The values of k1, k2, and c in Figure 6 are assumed for the case of D = 60 mm. Then,
the values of k1, k2, and c are proportionally changed in accordance with the respective impact area.
In Figure 9, the thorn height decreases as the impact area becomes smaller. Moreover, the impact time
in-creases as the impact area becomes smaller. In other words, the simulation results qualitatively represent the characteristics of the experimental results.
5.3. Case of an Oil Clay Plate under a Flat Frontal Impact
Figure 10(a)shows the impact force waveform (as measured by the upper sensor) of an oil clay plate with 100
mm square. Its thickness is about T = 50 mm. The drop heights are h = 100 and 530 mm. A large thorn is ob-served. As the drop height increases (V0 becomes higher), the slope θ becomes steeper and thorn peak becomes
higher. The thorns are more obvious than those for other materials. As shown in the enlarged view, the shape of the thorn is similar to an isosceles triangle.
Figure 10(b) shows the waveforms simulated by the SLS model. Here, k1 is assumed to be equal to 40 kN/m,
and k2 is assumed to be equal to 800 kN/m. The damping coefficient c of the dashpot is assumed to be a time-
dependent value, which changes during the impact period.
Table 2shows thespring anddamping coefficients of the oil clay. During the period of 0 < t < 0.2 ms, c =
1500 kg/s. During the period of 0.2 < t < 0.5 ms, c decreases linearly from 1500 kg/s to 100 kg/s. During the pe-riod of t > 0.5 ms, c = 100 kg/s. The period 0.2 < t < 0.5 ms is the period during which the viscosity transient occurs. The spring coefficients are k1 = 30 kN/m and k2 = 800 kN/m.
6. Discussion
Figure 11 shows the two types of collision condition under a flat frontal impact. Condition 1 is the case that the
soft material surface is larger than the area of drop hammer bottom. Condition 2 is the case that the soft material surface is smaller than the area of drop hammer bottom. All the previous our experiments were carried out under
0 500 1000 1500 2000 2500
0 500 1,000 1,500 2,000 2,500 3,000 3,500
0 1 2 3 4 5
C (
kg
/s
ec
)
k1
, k2
(
kN
/m)
Time (msec) k1 k2
Figure 7.Circular aluminum plate attached to the bottom of the drop
[image:6.595.183.444.210.360.2]weight.
[image:6.595.89.539.588.719.2]Figure 8. Impact force waveforms measured by the weight drop onto NBR plate with T = 30 mm.
Figure 9. Impact force waveforms of NBR plate simulated by SLS model.
Table 1. Spring coefficients and damping coefficients of NBR assumed in the SLS model.
Diameter of AL plate Impact area Spring coefficient Damping coefficient c (kg/sec)
D (mm) A (mm2) k
1 (kN/m) k2 (kN/m) 0 < t < 0.2 msec 0.2 < t < 0.4 msec t > 0.4 msec
60 2827 1000 3000 2000 Linearly decrease 300
50 1963 694 2083 1389 Linearly decrease 208
40 1257 444 1333 889 Linearly decrease 133
30 707 250 750 378 Linearly decrease 75
20 315 111 333 222 Linearly decrease 33
Circular plate Drop hammer
Soft material
Circular plate
d
D
-3.5 -3 -2.5 -2 -1.5 -1 -0.5 0 0.5
0 5 10 15 20
Im
pa
ct
fo
rc
e (
kN)
Time (msec)
Experiment, NBR, T=30mm, h=380mm
D=60mm D=50mm D=40mm D=30mm D=20mm
-3.5 -3 -2.5 -2 -1.5 -1 -0.5 0 0.5
0 5 10 15 20
Im
pa
ct
for
ce
(k
N)
Time (msec)
Simulated by SLS model, NBR, T=30mm, h=380mm
Table 2.Spring coefficients and damping coefficient of oil clay plate assumed in the SLS model.
Spring coefficient Damping coefficient c (kg/sec)
k1(kN/m) k2(kN/m) 0 < t < 0.2 msec 0.2 < t < 0.5 msec t > 0.5 msec
Oil clay (T = 50 mm) 30 800 1500 Linearly decrease 100
[image:7.595.86.539.97.317.2](a) (b)
[image:7.595.122.510.335.443.2]Figure 10. Impact force waveforms of oil clay plate measured experimentally and simulated by SLS model.
Figure 11. Two types of collision conditions under flat frontal impact.
the Condition 1. In the Condition 1, the surrounding soft material near the edge of the drop weight bottom is momentarily deformed by the impact. This edge effect may be the cause of the thorn.
So, we conducted the experiment under the Condition 2. An NBR circle plate with 50 mm diameter which is smaller than the area of drop hammer bottom is used for the experiment. The thickness of NBR is T = 30 mm and the drop height is h = 100, 200, or 380 mm.
Figure 12 shows the impact force waveforms of the upper sensor measured by the compact drop test
equip-ment. As is seen in the figure,the thorn-shaped waveform became smaller than that of Figure 4. However, the thorns are still observed in the rising segment of the waveform.
Another experiment of Condition 2 was carried out using an oil cray circle plate with 50 mm diameter. The thickness of oil cray is T = 50 mm and the drop height was h = 100 or 530 mm. Figure 13 shows the impact force waveforms. Although the height of the thorn became smaller, thorn-shaped waveform still occurred. Why does this small thorn occur? The author thought that it may be a friction effect between the drop weight bottom and the soft material surface. Usually, soft material deforms into a barrel shape by the frictional forces induced in the upper and lower surface of the soft material. So, we conducted an experiment with paint machine oil to the upper and lower surfaces of NBR circle plate. However, the thorn-shaped waveform which did not change so much was appeared for all the cases.
Oil clay contains two components: a liquid (oil) and a solid. Therefore, the viscous resistance of oil may in-itially appear as a thorn-shaped waveform, followed by a mountain-shaped waveform indicting the resistance of the solid. However, the thorn-shaped waveforms also occur in NBR which does not contain liquid. Therefore, the physical reason for the occurrence of the thorn is unknown at present.
From this fact, the authors are thinking the followings reasons.
-1.2 -1 -0.8 -0.6 -0.4 -0.2 0 0.2
0 10 20 30 40
Im
pa
ct
for
ce
(
kN)
Time (msec)
Experiment, Oil clay, T=50mm
h=100mm h=530mm
-1.2 -1 -0.8 -0.6 -0.4 -0.2 0 0.2
0 10 20 30 40
Im
pa
ct
for
ce
(k
N)
Time (msec)
Simulated by SLS mlodel, Oil clay, T=50mm
Figure 12.Impact force waveforms measured by the weight drop onto NBR plate with T = 30 mm.
Figure 13.Impact force waveforms measured by the weight drop onto oil clay plate with T = 50 mm.
• Discontinuous viscosity behavior similar with some colloidal suspensions [7] [8] may occur at the thorn peak.
• Breaking of surface tension of soft material may occur at the thorn peak.
• Internal friction may change from static friction to dynamic friction at the thorn peak.
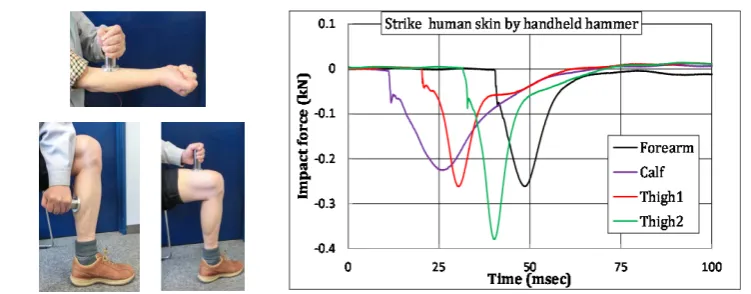
7. Impact Force of Human Skin under a Flat Frontal Impact
The drop hammer was removed from the compact drop test equipment, and the hammer was held by hand, as shown in Figure 14. Then, the relatively smooth areas of forearm skin, calf skin, and thigh skin were struck by the hand-held hammer. Considering the above mentioned results, a thorn-shaped waveform should be observed on flat skin areas without bone directly underneath. Impact force waveforms with steep slopes θ in the rising segment and small thorns were observed in most cases.
8. Impact Force of Free-Falling Hollow Balls
Figure 15 shows the impact force waveform of a superball (solid ball) with an excellent rebound property, as
measured through free-fall drop tests from heights of 1.0 m and 2.0 m. No thorn appears in the waveform. Simi-larly, the impact forces of a hardball (used for baseball), a softball, a golf ball, and a bowling ball (solid balls) did not generate thorn-shaped waveforms due to the spherical surfaces of the balls.
Figure 16shows the waveforms of a handball, a rubber ball, and a tennis ball (hollow balls) obtained through
free-fall drop tests. Even though they have spherical surfaces, the hollow balls generate a steep slope θ and a small thorn. This is thought to be the reason that the contact area of a hollow ball is flattened at the moment of impact, and a condition similar to a flat frontal impact is achieved.
-3.5 -3 -2.5 -2 -1.5 -1 -0.5 0 0.5
0 1 2 3 4 5 6
Im
pa
ct
for
ce
(k
N)
Time(msec)
Experiment, NBR, T=30mm
h=100mm h=200mm h=380mm
-1.2 -1 -0.8 -0.6 -0.4 -0.2 0 0.2
0 10 20 30 40
Im
pa
ct
for
ce
(k
N)
Time(msec)
Experiment, Oil clay (circle), T=50mm
[image:8.595.184.446.272.421.2]Figure 14. Human skin was struck by a hand-held hammer. The measured impact force wave-forms are shown on the right.
[image:9.595.161.477.265.396.2]Figure 15. Impact force induced by free-falling superball (solid ball).
Figure 16.Impact force induced by free-falling hollow balls.
9. Conclusions
The impact force waveforms of soft materials were examined based on a drop impact experiment and a dynam-ics model. Experiments were carried out using compact drop test equipment under the condition of a flat frontal impact. The standard linear solid model (SLS model), in which viscosity transient was considered, was used for the simulation of the impact force waveform. The results obtained here were as follows:
1. The impact force waveforms of soft material consist of a thorn-shaped waveform and a subsequent moun-tain-shaped waveform. The thorn-shaped waveform is influenced by the strain rate. The rising slope θ of the thorn becomes steeper as the strain rate increases. The height of the thorn peak becomes higher as the strain rate increases.
2. The SLS model can qualitatively simulate the characteristics of thorn-shaped waveforms.
3. Under the condition of a flat frontal impact, the thorn appears clearly according with the increase in the
-0.5 -0.4 -0.3 -0.2 -0.1 0 0.1
0 2.5 5 7.5 10
Im
pa
ct
f
or
ce
(k
N)
Time (msec)
Superball, m=0.049kg
h=1.0m h=2.0m
-0.5 -0.4 -0.3 -0.2 -0.1 0 0.1
0 2.5 5 7.5 10 12.5 15
Im
pa
ct
for
ce
(k
N)
Time (msec)
Hollow balls (Tennis ball, Rubber ball, Handball)
Tennis ball, h=2m
Rubber ball, h=2m
[image:9.595.203.486.402.554.2]impact area. If either the surface of the drop hammer or the surface of the soft material is curved, the thorn-shaped waveform becomes unclear. These conditions can be reproduced in the simulation using the SLS model.
4. From the experimental observations, the authors think that viscosity transient is induced at the thorn peak. At the moment of impact, a large viscous resistance is induced near the surface of soft material, and the viscous resistance is rapidly reduced after generation of the thorn. However, the physical reason of the viscosity tran-sient phenomenon is unclear.
Acknowledgements
We thank the Editor and the referee for their comments. The authors also thank to the Venture Business Labor-atory of Hiroshima University for the financial support.
References
[1] Fujimoto, Y., Liu, C., Tanaka, Y. and Shintaku, E. (2013) Measurement of Double-Strike Phenomenon of Impulsive Force Using Fluctuating Load Detection Plate. The Japanese Society for Experimental Mechanics, 13, 112-120. (In Japanese)
[2] Liu, C., Tanaka, Y. and Fujimoto, Y. (2015) Viscosity Transient Phenomenon during Drop Impact Testing and Its Simple Dynamics Model. World Journal of Mechanics, 5, 33-41.
[3] Fujimoto, Y., Liu, C., Tanaka, Y., Shintaku, E. and Nakanishi, T. (2015) Thorn-Shape Waveform and Double-Strike Phenomenon Seen in the Impact Force of Soft Material. World Journal of Mechanics, 5, 59-69.
[4] Song, B., Ge, Y., Chen, W.W. and Weerasooriya, T. (2007) Radial Inertia Effects in Kolsky Bar Testing of Extra-Soft Specimens. Experimental Mechanics, 67, 659-670. http://dx.doi.org/10.1007/s11340-006-9017-5
[5] Kwon, J. and Subhash, G. (2010) Compressive Strain Rate Sensitivity of Ballistic Gelatin. Journal of Biomechanics, 43, 420-425. http://dx.doi.org/10.1016/j.jbiomech.2009.10.008
[6] Chen, W., Lu, F. and Winfree, N. (2002) High-Strain-Rate Compressive Behavior of a Rigid Polyurethane Foam with Various Densities. Experimental Mechanics, 42, 65-73. http://dx.doi.org/10.1007/BF02411053
[7] Hoffman, R.L. (1972) Discontinuous and Dilatant Viscosity Behavior in Concentrated Suspensions. I. Observation of a Flow Instability. Transactions of the Society of Rheology, 16, 155-173. http://dx.doi.org/10.1122/1.549250
Appendix: Impact Force Waveform of a Spherical Collision with Oil Clay
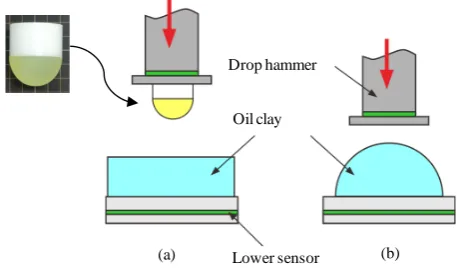
Figure A1(a) shows a urethane rubber hemisphere (rubber hardness: 90, diameter: 40 mm) fixed to the bottom
of the drop hammer and a flat oil clay plate (T = 50 mm). Figure A1(b) shows a drop hammer with a flat bottom and an oil clay prepared into a semi-spherical shape. In both cases, the drop height is h = 380 mm. Figure A2
[image:11.595.198.435.199.333.2] [image:11.595.182.447.368.518.2]shows the measured impact force waveforms. The thorn shape does not appear in the figure. Thus, when the col-liding body or the receiving body is not planar, a thorn is less likely to appear in the waveform because the im-pact area spreads gradually. The start of the imim-pact force of the lower sensor is delayed compared to the upper sensor. This is due to the influence of the mass inertia of the oil clay.
Figure A1.Experiment to examine spherical collisions. (a) Drop hammer is hemispheical. (b) Clay is hemispheical.
Figure A2. Impact force induced by hammer drop onto an oil clay
(spher-ical collision).
Drop hammer
Oil clay
Lower sensor
(a) (b)
-1 -0.8 -0.6 -0.4 -0.2 0 0.2
0 10 20 30 40 50 60
Im
pa
ct
for
ce
(k
N)
Time (msec)
Spherical collision of oil clay, h=380mm