Car-Park Management using Wireless Sensor
Networks
J. P. Benson, T. O’Donovan, P. O’Sullivan, U. Roedig, C. Sreenan
University College Cork (UCC), Cork, Ireland
—
J. Barton, A. Murphy, B. O’Flynn
Tyndall National Institute, Cork, Ireland
Abstract— A complete wireless sensor network solution for car-park management is presented in this paper. The system archi-tecture and design are first detailed, followed by a description of the current working implementation, which is based on our DSYS25z sensing nodes. Results of a series of real experimental tests regarding connectivity, sensing and network performance are then discussed. The analysis of link characteristics in the car-park scenario shows unexpected reliability patterns which have a strong influence on MAC and routing protocol design. Two unexpected link reliability patterns are identified and doc-umented. First, the presence of the objects (cars) being sensed can cause significant interference and degradation in commu-nication performance. Second, link quality has a high temporal correlation but a low spatial correlation. From these observations we conclude that a) the construction and maintenance of a fixed topology is not useful and b) spatial rather than temporal message replicates can improve transport reliability.
Index Terms— Car-park monitoring, link reliability, topology reliability, wireless sensor networks, deployment, experiences.
I. INTRODUCTION
Car-park management systems operate by monitoring the availability of car-parking spaces and making that information available to customers and facility administrators. Customers use it for guiding them in their choice of parking space; ad-ministrators use it to aid in overall management and planning. Sensor networks are a natural candidate for car-park manage-ment systems, because they allow status to be monitored very accurately - for each parking space, if desired. Wireless sensor networks have the advantage that they can be deployed in existing car-parks without having to install new cabling for network and electricity to reach each sensing device. For this reason, wireless sensor networks also have use for road-side car-parking.
Initially it was planned to use existing components and protocols to build the sensor network application for car-parks. However, our preliminary tests showed that an acceptable application quality could not be achieved due to a highly unreliable message delivery. This unreliability was caused by the unexpected behaviour of the communication methods and protocols used. More specifically, MAC and routing protocol behavior was very unreliable. This observation motivated the experimental analysis of the communication behavior pre-sented in the paper (see Section IV). The results of this in-vestigation guided the design of the communication protocols
used for the car-park application described in the paper (See Section III).
The first communication problem is related to the phe-nomenon observed by the sensor network. Sensor nodes are currently deployed on the ground in the center of a parking spot. As cars have to drive over the sensor, it must have a low profile and this results in the antenna being placed only a few centimeters above ground. Such a placement in general reduces the communication range. If a car is parked, a large metal object is placed above the antenna which obstructs com-munication dramatically1. This effect has a strong influence on
the topology and thus the routing mechanism in place. A pre-constructed routing topology might break when a car enters or leaves the car-park. This topology break occurs exactly at the moment it is needed to forward the sensor data of interest. Therefore, the routing protocol used for the car-park application is designed to deal with this problem.
The second communication problem is caused by the real-world properties of the link quality. In node-to-node commu-nication, a (high) percentage of packets are lost during trans-mission due to interference. Most communication protocols take this effect into account and use multiple transmissions or acknowledgments to boost transmission probability. However, our experiments show that packet losses have a high temporal correlation. Link quality drops for a long period of time (in the order of seconds) and during this period no communication is possible. Thus, re-transmissions or acknowledgments have no effect. Another observation is that packet losses have a low spatial correlation. If node A is currently unable to communicate with B, it has a good chance to communicate with C; even if B and C are only a few centimeters apart. Therefore, spatial rather than temporal message replicates can improve transport reliability. In other words, it is useful to transmit messages on multiple paths to the sink instead of using one path with retransmissions or acknowledgments.
The paper is organized as follows. Section II describes related work. Section III describes the overall system ar-chitecture, including details of the hardware and software used to construct the sensor network. Section IV discusses experiments regarding communication and sensing. The paper concludes in Section V.
II. RELATEDWORK
Most indoor car-parks employ a simple barrier system to track the number of vehicles currently occupying spaces, typically conveying this information to drivers via exterior signs mounted at the entrance and on nearby streets. Car-parks in which the occupancy of individual spaces is monitored are much less common, and there are very few product offerings, with the most prominent being Siemens SiPark[1]. In SiPark a device is mounted on the ceiling above each parking space. This uses an ultrasound sensor for detecting the presence or absence of a vehicle. These devices are connected using a bus-style network to distribute power and transmit sensing reports. In our system we employ wireless nodes because the bene-fits of a wireless solution are (a) significantly lower installation costs, especially for existing car-parks, and (b) additional use for on-street parking. There are several start-up companies that are actively working in this space, e.g. ParkingCarma [2], Streetline Networks [3], and vehicleSense [4], but details of their technology are not available and thus it is not clear how they have addressed the important practical issues we raise in this paper. Using wireless sensor nodes for car-parking was also the subject of a project at the University of California at Berkeley [5] and more recently at EPFL Switzerland [6]. In designing a system for car-park management one encounters a wide range of research problems, most of which are receiving considerable attention in the research literature. For example issues of energy efficiency, topology control and routing, and medium access control, to mention but a few. Our contribution in this paper is not to present novel algorithmic solutions to such problems, but rather to identify the practical deployment issues we encountered in and the pragmatic solutions that we devised. This real-world experience is a valuable contribution to the networking research community and to others involved in the commercialisation of wireless sensor networks. There are a small number of papers that have specifically addressed issues related to cars and wireless sensor networks. In [7], Piorkowski and Grossglauser present an algorithm for tracking the movement of nodes in situations where the nodes are constrained, such as on a road. In [8], Miura et al describe results of a simulation where reports from wireless sensor nodes are passed from car-to-car in order to achieve scalable dissemination of information regarding parking spaces. There are of course many publications in the related area of inter-vehicle communication and, to a lesser extent, communication between vehicles and electronic roadside infrastructure.
III. SYSTEMARCHITECTURE
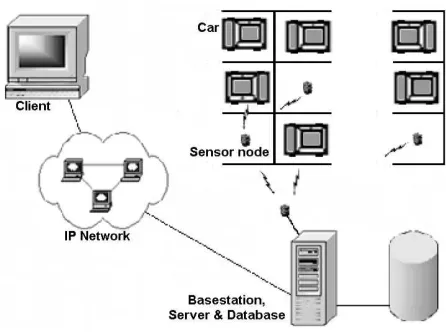
The overall architecture was guided by the principle of tiered functionality, with the lowest level comprising the sens-ing functionality, a middle tier dealsens-ing with data forwardsens-ing, and the upper tier handling data storage, processing and client interfaces. The architecture is depicted in Fig. 1 and mimics the actual physical topology used in our current deployment. This section gives an overview of the system, which will be detailed later in the paper.
[image:2.612.327.550.51.217.2]The DSYS25z [11], [9] sensing nodes run Tiny OS Version 1.1.7, together with custom medium access control (MAC)
Fig. 1. System Architecture
and routing protocols, and a driver for the magnetic sensor. The application-layer software is responsible for reading from the sensor at a regular programmed period and forwarding the reading to a neighbour for multi-hop delivery to a base
station (currently a PC). A Java-based server interacts with
a serial-forwarder program to acquire and process the data.
First, it determines the originating node, then it processes the new reading as follows: If the reading indicates a change in the current value for that node, then the server records the time at which the new packet was received and if it receives several successive updates indicating the same change in status then it accepts and records the change. The idea is to avoid reacting to transient changes, due, for example, to vehicles driving over a vacant parking space.
A. Server and Client Software
The server is a Fedora Core 3 Linux PC running Apache Tomcat 5 and MySQL. The main application updates the MySQL database as it receives fresh reports from the network. The user interface to the web application can be any Java-enabled web browser. The web application shows a map of the car-park and which parking spaces are vacant or occupied. The interface allows different categories of users, including that of administrator. It is possible to configure several aspects of the system, for example, new sensor nodes can be added, existing sensor nodes in parking spaces can be moved to a different parking space by dragging and dropping, and the reporting interval of the system can be changed. A user can also generate reports which can show the occupancy status of the car-park for a period of hours, days or months. The
web application was implemented using Java Server Faces
and HTML. The map which appears on the client browser is
a Java applet. The Java build tool ant was used to manage
the web application and to compile and install it as a web application in the Tomcat server.
B. Sensor Hardware
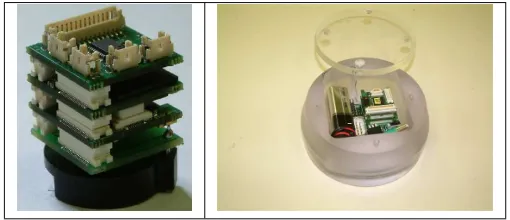
Fig. 2. DSYS25 Sensor Hardware
Fig. 3. Component Graph of the parking Application
Its modular nature lends itself to the development of numerous layers for use in different application scenarios. Layers can be combined in an innovative plug and play fashion and include communication, processing, sensing and power. The communi-cation layer is comprised of an ATMega128L micro-controller, RF transceiver and antenna. An FPGA for high-speed DSP forms the processing layer while various application specific sensors, as well as a generic sensor interface/communications layer, have been developed for the sensing layer. The power layer may include batteries or other energy supply mechanisms such as solar cells. The sensor hardware is depicted in Fig. 2. For the parking application, the communication layer is equipped with a CC2420 Zigbee compliant transceiver and a simple wire antenna. For the detection of cars, a specific sens-ing layer includsens-ing a magnetic field detector was developed. The power layer was replaced by a set of two AA batteries (or alternatively a 9v battery as shown in the picture) as sensor node lifetime is considered more important than node size. The resulting system is encased in a 15cm x 15cm plastic box that can be glued to the ground.
C. Sensor Software
The platform runs a tailored version of TinyOS, an operating system designed at UC Berkeley and engineered to run in hard-ware platforms with severe resource constraints. The entire system can be described in terms of a graph of components and a scheduler. Components encapsulate functionality and state and provide well defined, bi-directional interfaces that can be "wired" to other components forming complex applications. The scheduler provides deferred execution of non-time critical and computationally intensive sequences of operations.
Fig. 3 shows the component graph of the parking application implemented for the DSYS25 sensor nodes.
The main part of the sensor application logic is implemented
within the the ParkLot component. The ParkLot component
itself uses the magnetic sensor componentMagnand the
rout-ing componentDiffMultiHopRouter. TheParkLot component
sends and receives messages from the sink via the
DiffMulti-HopRouter component. The DiffMultiHopRouter component
and the routing mechanism used is described in detail in Paragraph III-D. The actual forwarding from node to node
is handled by the CC2420_PEFRG_Radiocomponent which
handles the Zigbee transceiver specifics and implements the MAC protocol (Represented by the
GenericCommPromiscu-ous component in Fig. 3). TheCC2420_PEFRG_Radio
com-ponent and the MAC protocol is described in Paragraph III-E. Periodically, the sink broadcasts a message to the network which configures the behaviour of theParkLotcomponent and builds the routing topology. This broadcast message informs the sensor nodes of the sensing frequency f that has to be used. Thus, the ParkLot component is activated periodically as defined byf. When activated, the magnetic sensor is used
via Magn to determine the presence of a car. The Magn
component and the detection mechanism is described in detail in Paragraph III-F. The result of the sensing task is sent via
the componentDiffMultiHopRouter towards the sink. Faulty
nodes can be detected by the sink if no sensor information is received from this particular node for a defined time period.
Since the deployed sensor nodes have to last for a sig-nificant amount of time, sophisticated power management of the nodes is necessary. The power management is imple-mented within several components used in the node. The
ParkLot component is used to duty cycle the magnetic
sen-sor. TheCC2420_PEFRG_Radiocomponent duty cycles the
transceiver chip independently. The power management fea-tures of the TinyOS operating system are used to duty cycle the CPU. The power management is discussed in Paragraph III-G. The simple design of theParkLotapplication and the sens-ing and routsens-ing component chosen ensures that the resultsens-ing sensor system is easy to debug. Sensor readings are, for example, always sent to the sink, regardless of an actual status change. In-field processing is omitted to keep the sensors as simple as possible.
D. Message Routing
A simple selective flooding routing scheme is used for the deployment. The protocol consists of two steps: topology discovery and data forwarding. For each step dedicated mes-sages are used (called command and data mesmes-sages) which are always sent as a broadcast.
Topology Discovery: The sink periodically sends a
com-mand message. The message contains information needed to
setup the data forwarding and the sensing behavior of the
waiting a short random time. The random time is introduced to reduce collisions among broadcasting nodes.
Data Forwarding: In short, data messages will fan out
initially and thereafter they will only be forwarded by nodes that are nearer to the base station. A node reporting a sensor reading to the sink transmits the message as a broadcast. The message contains the sensor samplemdd, the node idmdi, a vertical movement counter mdv preset to the (small) valuev
(which allows messages to be passed to nodes of similarmdh
thus facilitating fanning out of messages along disjoint routes)
, the hop-distance mdh of the node and a sequence number
mds. A node receiving the packet checks that the packet was not already processed using the sequence numbermdsand the node idmdi. If the packet was already processed, the replica is silently dropped. If the packet was not yet processed, the
hop-distance of the sending node mdh is compared with the
hop-distancehof the receiving node. Ifh > mdh, the message is silently discarded. However, ifh < mdhthe valuesmdhand
mdv in the message are updated (mdh = h andmdv =v)
and the message is re-broadcast. In the special case where
h = mdh and mdv > 0, the value mdv in the message is
updated (andmdv=mdv−1) and the message is re-broadcast
thereby allowing the fanning out of messages along multiple routes.
The protocol implements a selective flooding. The
hop-distancemdh and the vertical movement countermdv ensure
that the flooding is selective and that the flooding is directed towards the sink. The protocol was designed in this way for several reasons. First, updates for each car-park space are typically sent with a low frequency (e.g. every minute, although this can be increased during periods of high activity) and thus, bandwidth is not the limiting factor in a car-park of reasonable size. Communication related power consumption of each node is determined by the transceiver duty cycle (described in the next paragraphs) and not by the amount of messages sent. Therefore, a selected flooding approach is feasible. Second, the protocol is very simple and debugging is relatively easy. This is extremely important when dealing with real-world deployment issues. Finally, the protocol deals with the encountered communication channel properties, described in detail in the next Section. The coarse-grained topology built by the protocol is reasonably robust to deal with fluctuating channel quality caused by arriving/departing cars. Further, the protocol distributes message replicas spatially which deals with the problem of temporarily bad link quality.
E. Message Forwarding
The CC2420_PEFRG_Radiocomponent is responsible for
the message forwarding between two neighbouring nodes. This includes the implementation of a MAC protocol and operation patterns that enable transceiver power management.
The CC2420 Zigbee chip used allows only a packet based operation. A complete packet is transferred into a register on the CC2420 chip (e.g. using the SPI of the CPU). Then, a signal is send to the chip to transmit the complete packet. Additional functionality such as CRC checksum calculation and acknowledgments can also be handled by the transceiver
chip. If a packet is received, the complete packet is stored in the transceiver and an interrupt is signaled for the CPU. Thereafter, the packet can be transferred to the main memory. Only operations based on complete packets are possible and therefore the MAC protocol and transceiver power man-agement must be tailored towards these limitations. Each packet is sent several times as a trail of identical packets (so called framelets [5]). The message is transferred successfully if the receiver captures one of these framelets. The packet repetition allows the receiver to periodically switch on and off the transceiver chip. Thus, an energy efficient transceiver operation is possible while ensuring that each node can receive messages. The medium access control protocol (MAC) used is contention-based. Before a node starts transmitting a packet, it listens for the duration of one framelet transmission to the medium. If no transmission is in progress, the node can begin its own transmission. Otherwise, a random delay is imposed before the procedure described initiates again. The transceiver operation and MAC protocol is described in detail in [10].
The MAC protocol does not use message repetition or ac-knowledgements to improve transmission reliability. As the ex-periments in the next Section show, packet losses have a high temporal correlation. Therefore, these reliability improvement mechanisms are not useful for the target application scenario. Instead, the routing protocol performs message duplication and achieves the necessary reliability improvements.
F. Magnetic Sensor
The magnetic field detector used for this application is the Speake FGM-3 which uses 12mA of power and is operated at 3.3v. It outputs rectangular pulses with frequency inversely proportional to the magnetic field strength. The presence of metal changes the magnetic flux of the surrounding area and this change is shown by a change in the frequency of a quartz oscillator. Due to the high frequency of pulses generated (range 50-120kHz) it was decided to treat the sensor as an external clock whose frequency could be measured by counting how many pulses arrived during a fixed interval measured by the processors internal clock. The sensor output was connected to a 16-bit counter pin on the processor (TimerCounter3).
The TinyOS Magn component is activated periodically as
defined by the sensing frequency f. When activated, the
TimerCounter3register is set to zero. Then, the pulses received
from the magnetic sensor are counted for a predefined timets
(usually ts = 200ms). This process is repeated a predefined
number ns of times (usually ns = 3) and the result is
averaged. The result is compared with a calibration value that is determined when the node is first switched on (no car present). If the measured pulse number is significantly higher (determined by a threshold, usually 10% higher than the calibration value), a car is detected. Finally, the Magn
component returns a binary value indicating if a car is present or not.
Component Current Active
Current Sleeping
CPU 8mA 15µA
Transceiver 18mA 1µA
Sensor 12mA 1µA
TABLE I
ENERGYPROPERTIES
Duty Cycle Sensing frequencyfs
(ts= 0.2s,ns= 3)
Node lifetime
d= 0.1 fs= 1/1s 32 days d= 0.01 fs= 1/1s 230 days d= 0.1 fs= 1/5s 34 days d= 0.01 fs= 1/5s 314 days
TABLE II
EXPECTED NODE LIFETIME
G. Power Management
The possible sensing resolution - time needed to detect a change in car-park occupancy - of the parking application is constrained by the available energy in the node and the power management used. Tab. I lists the energy properties of the different elements in the sensor node.
The table shows that the all sensor node components have similar energy consumption. The power consumption of the
sensor node, with all components in active state is P =
38mAh. A typical AA battery can produce about C =
1000mAhand therefore the sensor could only operate for 52 hours without any power management features (with two AA batteries).
The power management is implemented within several components used in the node. TheParkLotcomponent is used
to duty cycle the sensor used. The CC2420_PEFRG_Radio
component duty cycles the transceiver chip independently. The power management features of the TinyOS operating system are used to duty cycle the CPU. TheParkLotsamples the magnetic sensor with a sensing frequency f. A typical value would be one sample per minute (f = 1/60s). The magnetic sensor has only to be active during the sampling phase which is defined by the sampling timetsand the number of samples ns taken (typical values are ts = 0.2s,ns = 3, see Section III-F), thereafter, the sensor is set to sleep. The transceiver is periodically set into active mode to listen for incoming messages. A typical value is a duty cycle ofd= 0.1 (10% of the time active, 90% of the time sleeping). The CPU would use a similar duty cycle as is used to alter the state of the transceiver. Thus, the resulting node lifetime can be estimated using:
T =C/((PCP U+PT RS)·d) +PSN S·n·ts·f) (1)
Results for typical operation conditions are shown in Tab. II.
IV. EXPERIMENTALEVALUATION
A. Sensor Test
During tests it was found that the magnetic sensor was extremely sensitive to orientation and could produce vastly different results depending on its orientation. Essentially, the sensor detects the Earth’s magnetic field and in some ori-entations the presence of a car above can produce erratic results. Therefore it was necessary to carefully deploy the nodes and calibrate in-situ. It was found that manual placement of the sensor along an East-West or West-East orientation produced the most stable results. In future deployments a more sophisticated sensor capable of self-calibration and correct operation regardless of orientation would be advantageous.
The determination of the correct threshold difference in the number of pulses detected to indicate the presence of a vehicle was less straightforward than originally envisaged. There are numerous vehicles available of various sizes, compositions and with varying distances between the body of the vehicle & the ground. In addition, most vehicles do not have uniform undercarriages in terms of composition and layout. These facts present an impediment to the successful usage of a magnetic sensor.
Exhaustive testing of the sensor with all possible types of vehicle was not the aim of this project and, in addition, it was infeasible in terms of both manpower and budgetary con-straints. Therefore testing was carried out using two common but quite different vehicle types. The first vehicle, a VW Polo SDi, was chosen as it represented a standard car type and would therefore be the most common vehicle type sensed. The second vehicle, a Toyota Landcruiser, was chosen as it represented SUVs and commercial vans and was significantly different in composition to the Polo.
The sensor was tested with each vehicle using various thresholds (% difference from calibration value) with a greater threshold indicating a less sensitive sensor configuration. Sen-sor data was examined at increments along the length of the vehicles and subsequently analysed. The most likely placement of the sensor was noted to be somewhere between the front and rear axles of the vehicles as this would be a central position on the car-park space. Therefore the criteria for successful vehicle detection is the ability to detect the vehicle in question with the sensor at any central point between the two axles. Testing revealed that the Landcruiser could be detected successfully at a threshold of 10% (compared to 15% for the Polo). The question of generating false positives was addressed by placing one of the vehicles within 0.75 metre of the sensor in various positions. At the chosen threshold of 10% this failed to generate a false positive.
B. Connectivity Test
0 20 40 60 80 100 120
0 10 20 30 40 50
Packet Delivery Rate [%]
Distance d [m]
[image:6.612.86.262.54.180.2]50cm elevation 1cm elevation Ground level
Fig. 4. Basic packet delivery rate at different deployment heights.
0 20 40 60 80 100 120
5 5.5 6 6.5 7
Packet Delivery Rate [%]
Distance d [m]
receiver 1, test 1 receiver 2, test 1 receiver 1, test 2 receiver 2, test 2
Fig. 5. Basic packet delivery rate at different points in an empty car-park.
transmission characteristics in the target setting (Test B). Within the second set of experiments, different sender/receiver constellations in a car-park scenario are analysed. The different constellations are defined by the transmission direction and if sender and/or receiver are covered by parked cars.
Test A-1: 50cm above ground, 1cm above ground, ground
level. The first experiment was conducted with two sensors
placed 50cm above ground and moved apart in increments of 5 metres. At all times there were no obstacles between the two nodes and there was line of sight. It has also to be noted that the ground was a perfectly even surface. At each 5m increment, 500 packets were sent at a rate of 1 packet/sec. In the second experiment, both sensors were placed 1 cm above ground level with the antenna pointing vertically upwards at a height of 28mm from the transceiver. The transceiver was configured to send 2000 packets over a period of two minutes. The third experiment is similar to the second one except that the sensor is placed at ground level. The height of the transceiver above ground can greatly affect the effective range, therefore a comparison was made between transceivers resting at different levels. The results are shown in Fig. 4.
Test A-2: Surface test. The effects of the terrain on the
connectivity of the nodes was examined in the second test . An uneven car-park was chosen and measurements were taken to compare two different receivers 10cm apart but at the same range with respect to the transmitter. In each case 120 packets were sent over one minute and the results were recorded and the measurements were repeated. The results are shown in Fig. 5 and are discussed later in the paper.
Test B-1: Connectivity test with vehicles (front). Several
0 20 40 60 80 100 120
0 2 4 6 8 10 12 14
Packet Delivery Rate [%]
Distance d [m]
[image:6.612.348.525.54.182.2]Open-Open Open-Car Car-Open Car-Car
Fig. 6. Packet delivery rate in different parking constellations (front).
0 20 40 60 80 100 120
0 2 4 6 8 10 12 14
Packet Delivery Rate [%]
Distance d [m]
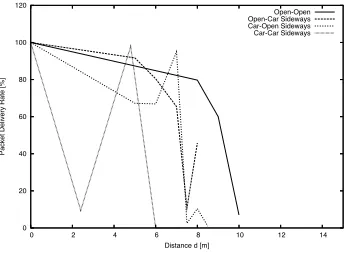
[image:6.612.350.524.218.345.2]Open-Open Open-Car Sideways Car-Open Sideways Car-Car Sideways
Fig. 7. Packet delivery rate in different parking constellations (front).
tests were carried out involving either the sender or receiver or both under vehicles. In this set of tests the transmission direction was along the long axis of the vehicle. Thus, the sender/receiver placed in the middle of the parking spot had to deal with half the length of the car as an obstacle. The vehicles used were randomly chosen from those currently in the car-park at the time of the test. In all cases 120 packets were sent over a single minute and the procedure was repeated a number of times. The result of the four experiments (Sender and receiver in the open, sender node under car and receiver in the open, sender in the open and receiver under car, sender and receiver under car) is shown in Fig. 6 and are discussed later in the paper.
Test B-2: Connectivity test with vehicles (side).In this set
of tests, the transmission direction is at a 90 degree angle to the long axis of the vehicle (sideways transmission). The sender/receiver placed in the middle of the parking spot has to deal with half the cars width and the wheels as an obstacle. In one particular experiment (labeled “Car-Car sideways” in Fig. 7) a row of parked cars was used to test the transmission range under successive cars. The remaining experiment setup is similar to the experiment B-1. The result of the four experiments are shown in Fig. 7 and are discussed later in the paper..
Evaluation: Test A highlights how seemingly small
[image:6.612.85.262.218.344.2]0 5 10 15 20
0 1 2 3 4 5 6 7 8 9 10 11 12 13 14 15 16 17 18 19 20
Number of Event
[image:7.612.347.524.56.186.2]Number of consecutive missed packets Open-Open at 8 meters
Fig. 8. Packet delivery rate in different parking constellations (front).
observations can be concluded from this experiment. First, small spatial movements can have a great effect on the communication properties. Although considered unsuitable for this particular application, the use of mobile sensors, even with very little mobility may be very useful in challenging radio environments. Second, since errors appear highly localised, reliability can be easily enhanced by bypassing these zones using adjacent nodes. Limited flooding or diffusion approaches are ideal for this task.
Test B shows that the sideways communication paths (with respect to the long axis of the vehicles) in the car-park have worse reliability compared to frontal communication paths. Test B also shows that very good reliability can be achieved up to a distance of approximately 5 meters (except the case where both sensor nodes are placed under cars). Thereafter, at a range of approximately 5 to 10 meters, high losses and unstable delivery probability are observed. After 10 meters, no communication is possible. Thus, half of the useful communication range is in the unstable area between 5 and 10 meters. Given the distances among sensors in a car-park scenario, this unstable region has to be utilised in a realistic deployment scenario. The question is how to best use this particular area for communication. As previously pointed out, the unstable area is considered for use and a precise definition of “unstable” is required. Unstable is defined by a spatial and a temporal component. First, if a sensor in the region between 5 and 10 meters is moved only a few centimeters, the delivery probability can change dramatically. Second, if the packet delivery rate in this region is analysed in more detail, it is revealed that packet losses have a high temporal correlation. Fig 8 shows a histogram of the packet losses for Test B-1 with sender and receiver in the open and a distance of 8 meters. Here, one packet in a row is lost only 17 times; 2 successive packets were lost on 5 occasions and finally 17 consecutive packets were lost once. Thus, in this particular point, more packets were lost in patches than in single events. As messages were sent every half a second, considerably long periods of connection loss exist. Similar observations can be made for the other measurement points. It can be concluded that:
• Communication reliability in the range of 0 to 5 meters is good.
• Communication reliability in the range of 5 to 10 meters
50 60 70 80 90 100 110
0 1 2 3 4 5 6
Percentage of Packets Received
Node No. Percentage of Packets Received
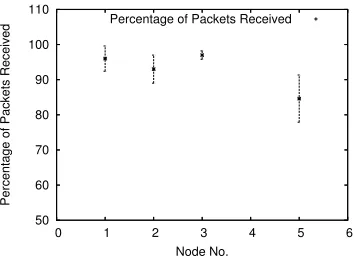
Fig. 9. Data transport reliability achieved by each node.
is spatially and temporally unstable.
• Communication beyond 10 meters is nearly impossible.
• If sender and receiver are covered by a parked car, no communication is possible.
C. Routing Test
A small working application was deployed in a car-park. Five nodes and a base station were deployed in a 3x2 grid of car-parking spaces with the base station (node 0) and node 1 and 2 on the right and nodes 3, 4 and 5 on the left. Nodes 3, 4, and 5 were covered by vehicles at all times. During the tests the nodes and the vehicles were not moved or otherwise interfered with. Of the five nodes deployed one suffered a hardware failure (node 4) and did not operate during the test. Thus data was gathered from four nodes and delivered to the application database for further analysis. Routing was a partial flooding protocol as previously described in Section III-D. When a command message was received each node generated a packet every 4 seconds until 100 packets were generated and then awaited the next command message.
Analysis: The reliability attained by each node is visible
from the data received and is shown in Fig. 9. The high reliability attained is further proof that our flooded approach is effective in this application scenario. Note that node 5, which was two hops away, had a lesser reliability than other nodes that were one hop away. This is due to the fact that any message traveling two hops is more likely to experience an error. Note also that the absence of node 4 removed a potential route for node 5’s messages therefore reducing the possible reliability obtained from the use of redundant paths.
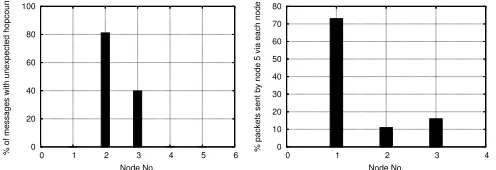
It can be seen from the data that the topology formation is flawed (Fig. 10). In a great number of cases the perceived hop-count generated at each node using the broadcast message was not the same as the number of hops taken to reach the base station. This indicates that despite using static conditions it is extremely difficult to correctly build a routing topology.
[image:7.612.85.263.57.187.2]0 20 40 60 80 100
0 1 2 3 4 5 6
% of messages with unexpected hopcount
Node No.
0 10 20 30 40 50 60 70 80
0 1 2 3 4
% packets sent by node 5 via each node
[image:8.612.50.298.55.140.2]Node No.
Fig. 10. Number of messages arriving with differing hop-counts that those generated during topology formation & the number of packets arriving from node 5 to route through each node.
D. Findings And Recommendations
The results of the connectivity tests & application tests can be summed up as follows:
• Connectivity in the test environment is not solely depen-dent on transceiver distance
• Uneven surfaces can be highly detrimental to connectivity
• Connectivity is often asymmetrical to some degree
• The presence of a vehicle at the transceiver has significant effects on connectivity
• Transceivers are prone to bursty communication black-outs
• These communication blackouts are local and do not
effect significant areas
With respect to the aforementioned points it is useful to discuss how they might impact on the choices of protocols and future designs. First, with regard to routing, it is abundantly clear that the use of a static routing tree is not applicable. Asymmetrical and unstable connectivity means that a reliable hop-count to the base station is difficult if not impossible to obtain for all nodes; Long periods of lost connectivity necessitate very frequent rebuilding of the routing tree; As does the movement of vehicles in and out of parking spaces. In short, dynamic & robust routing approachs must be used rather than a static approach.
The presence of bursty patches of interference has impli-cations for the transport reliability of sensor data. Clearly when no communication can be successfully completed for a significant period of time, often in the order of seconds, it is unwise to attempt to improve data transport reliability by the use of acknowledgements or retransmissions unless such systems include sufficient temporal displacement to avoid communication blackouts. In other words one should not try to retransmit before waiting for a reasonably long period of time. Naturally, the employment of such a reliability enhancing system would increase the perceived latency at the application leading to decreased responsiveness and performance from a user perspective and is therefore not desirable. A more reliable system can be envisaged by making use of the fact that the communication blackouts experienced seem to cover a very small area. Thus any system that increases redundancy using a spatial dispersement strategy should be more successful with minimum cost in terms of delay. In effect this amounts to limited flooding and diffusion approaches.
The choice of MAC layer is also influenced by the limits of connectivity and typical errors found. For example, it
would be very difficult to implement a correctly functioning collision avoidance algorithm since the transmissions of RTS and CTS packets used to avoid the hidden terminal problem assume bi-directional connectivity which is not present in this scenario. Complex clustering is also not appropriate since long bursty periods of non-communication have the same effect as nodes randomly and unexpectedly leaving or joining the network, leading to misconfigured clusters and excessively high cluster maintenance. MAC protocols relying on time synchronisation and cooperative multiplexing will suffer from the same problems and are obviously not an option. Clearly any MAC protocol used in such an environment must be fully self contained.
V. SUMMARY& CONCLUSIONS2
Our paper has described a complete system for car-park management using a wireless sensor network. Our architec-ture follows a tiered methodology and we found the most difficult practical challenges emerged at the lowest (sensing node) level. For example, issues surrounding the choice of sensor, its sensitivity and calibration, proved more difficult than anticipated. Further details were provided regarding the connectivity properties of our transceivers in their operational environment. In particular, we noted that the presence of the objects being sensed (vehicles) can cause significant interfer-ence and degradation in communication performance, and that the reliability patterns found had a high temporal correlation but a low spatial correlation. Furthermore we implemented practical methods to overcome these problems and analysed the resultant performance. In closing, we hope and believe that this report on our practical experiences will be useful to others working in this exciting area of research. Due to space restrictions we are unable to include many details of the project, but for further details see [9], [11].
REFERENCES
[1] Siemens AG. Intelligent Traffic Systems. http://www.siemens.com/traffic [2] ParkingCarma/Acme Innovation Inc. http://www.parkingcarma.com/ [3] Streetline Networks, Inc. http://www.streetlinenetworks.com/ [4] VehicleSense, Inc. http://www.vehiclesense.com/
[5] EzPARK. http://www.eecs.berkeley.edu/ ~ergan/EZPARK/index.htm [6] SmartPark. http://smartpark.epfl.ch/
[7] M. Piorkowski, M. Grossglauser. "Constrained Tracking on a Road Network," European Workshop on Wireless Sensor Networks (EWSN), Feb. 2006.
[8] S. Miura, Y. Zhan, and T. Kuroda, "Evaluation of Parking Search using Sensor Network," IEEE International Symposium on Wireless Pervasive Computing, Jan. 2006.
[9] B. O’Flynn, A. Barroso, S. Bellis, J. Benson, U. Roedig, K. Delaney, J. Barton, C. Sreenan, C. O’Mathuna. “The Development of a Novel Miniaturized Modular Platform for Wireless Sensor Networks. Proc. of the IPSN Track on Sensor Platform, Tools and Design Methods for Networked Embedded Systems” (IPSN2005/SPOTS2005), IEEE Computer Society Press, pp. 370-375, Apr. 2005.
[10] A. Barroso, U. Roedig, C.J. Sreenan. "Use of Framelets for Efficient Transmitter-Receiver Rendezvous in Wireless Sensor Networks," IEEE Conference on Local Computer Networks - Workshop on Wireless Local Networks, pp. 664-671, Nov. 2005.
[11] D-Systems. http://www.cs.ucc.ie/misl/dsystems/