Context Acquisition Based on Load Sensing
Albrecht Schmidt, Martin Strohbach, Kristof van Laerhoven, Adrian Friday, Hans-W. Gellersen
Computing Department Lancaster University Lancaster, LA1 4YR, UK
{albrecht, strohbach, kristof, adrian, hwg}@comp.lancs.ac.uk
http://ubicomp.lancs.ac.uk
Abstract. Load sensing is a mature and robust technology widely applied in process control. In this paper we consider the use of load sensing in everyday environments as an approach to acquisition of contextual information in ubiquitous computing applications. Since weight is an intrinsic property of all physical objects, load sensing is an intriguing concept on the physical-virtual boundary, enabling the inclusive use of arbitrary objects in ubiquitous applications. In this paper we aim to demonstrate that load sensing is a versatile source of contextual information. Using a series of illustrative experiments we show that using load sensing techniques we can obtain not just weight information, but object position and interaction events on a given surface. We describe the incorporation of load-sensing in the furniture and the floor of a living laboratory environment, and report on a number of applications that use context information derived from load sensing.
1 Introduction
Load sensing is widely applied in process control to measure the weight of goods, to monitor the strain on structures, and to gauge filling levels of containers. However, in ubiquitous computing applications, we find that despite the research community’s strong interest in context-awareness and sentient computing, load sensing has not received much attention as a potential technology for the capture of contextual information. In this paper we aim to redress this balance by demonstrating that load sensing can be a versatile source of context information for everyday environments; just as location technologies are a source for much more than absolute position, we show that load sensing technologies can provide rich contextual information, beyond mere load or weight.
Computer vision is a similarly generic approach, as visual scenes lend themselves to extract various kinds of context, for instance identity and location of people and detection of certain activity [6,11]. Other sensing techniques including load sensing have been used to obtain context in ubiquitous computing, but they are generally considered as too specific for wider application.
Load sensing though has some properties that appear to be well suited for context acquisition in ubiquitous computing. Firstly, gravitational force applies to all physical things, giving them weight and in principle rendering them detectable by load sensors. Secondly, changes in weight distribution in everyday settings can be assumed to be closely coupled with human interaction in a physical environment. Thirdly, load sensing lends itself to an event-based model in which applications respond to changes in observed load and do not have to monitor load continuously. Finally, load sensing is a mature and robust technology that lends itself to unobtrusive augmentation of practically any surface. Moreover, load sensing can be realized at very low cost; as evidenced by the use of strain gauges in kitchen and bathroom scales.
This paper investigates the utility of load sensing for context acquisition. As an initial contribution, we identify three context primitives that can be extracted from sensory observations on load-sensitive surfaces: weight, position, and type of interaction. Weight is an obvious contextual parameter that can and has been used for instance as key to identify objects. Load sensing for acquisition of object position and interaction events though has not been considered in context-aware computing before. We address this in our main contribution, a series of illustrative experiments that demonstrate high accuracy object positioning, and classification of interactions such as objects being placed, removed, or knocked over. The experiments explicitly consider conditions in everyday environments, such as pre-loading of surfaces with a multitude of objects. In the latter part of our paper we describe the implementation of load-sensing in the furniture and the floor of a small living laboratory environment. We also report briefly on a few applications facilitated in this environment, demonstrating various uses of load-sensing based context.
2 Related Work
Previous research has considered observation of the forces applied on surfaces to infer information on activity. More specifically, Addlesee et al. have built an Active Floor in an office environment, measuring ground reaction force to identify and track people [1]. In contrast to the load-sensitive surfaces considered in our work, they use a segmented surface, i.e. a floor composed of load-sensitive tiles. The same approach is used in the SmartFloor, implemented by Orr and Abowd in the Aware Home project [13]. Ground reaction forces are studied in more detail in bio-mechanics however based on special purpose equipment such as the Kistler force plate [9].
[14]. His work is based on a different sensing technology, using a grid of piezoelectric wires under the carpet instead of load cells.
Active Floor and Smart Floor are all focused on floor-level sensing of people’s identity, position or movement. In contrast, we are exploring more pervasive augmentation of surfaces in everyday environment including specifically tables as highly interactive spaces. More pervasive augmentation provides access to more fine-grained information on activity, for instance based on identification and tracking of objects.
An interesting example for object identification based on load sensing has been used in the i-Land project for implementation of the Passage mechanism [10]. Passage allows a user to temporarily link a virtual object to a physical item placed on a load-sensitive surface (called bridge) which has high precision scales embedded. In the system, the link is simply maintained by reference to the weight of the physical item, enabling seemingly physical transport to another bridge where the virtual object can be recalled. The Passage mechanism represents a very specific use of load sensing. In contrast we seek to establish load sensing as versatile source for context.
2.1 Context Primitives obtained from Load Sensors
Our approach is to augment many surfaces from floors to tables, shelves, and possibly even smaller surface units, with the intention of integrating these surfaces for developing a more versatile load sensing platform for context capture. This is not driven by a single application, but rather developed bottom-up by considering the context primitives that can be obtained from load sensing, and the construction of higher-level context capture techniques. We identify these primitives as:
• Weight: the load registered on a surface and attributed as weight to objects on the surface.
• Position: the spatial location at which the weight (i.e. gravitation force) occurs.
• Interaction: the shape of the load signal over time resulting from interaction. Weight is the most obvious contextual primitive that can be used for the identification of objects; we may identify single instances of objects or entire classes of similar objects from their intrinsic property of weight. Konomi’s passage mechanism is an example for how weight might be used to identify objects.
Position has been considered in the Active Floor and Smart Floor; by dividing the surface into a number of tiles some positional information is available by considering each tile’s sensor ID. We have observed that more fine-grained positional information can be obtained by utilising the distribution of forces on a single surface. We examine this issue further in section 4.
3 Determining 2-D Position of Objects on Surfaces
In this section we demonstrate how the 2-D position of an object can be detected on a surface using load sensing. We begin by describing the basic algorithms and demonstrate the feasibility of our technique. The configuration of our experiment is intended to recreate a typical surface that might be found in an everyday environment. For the experiment we placed a table-top on four industrial load cells each of which can detect forces of up to 500N. The load cells are placed at the corners of the table-top and each connected to a commercial signal conditioning unit. The conditioning units are in turn fed to a standard 16-bit Analog to Digital Converter (ADC) which links to the serial line of the PC. The load cells are driven with 10V, resulting in a output ranging from 0 to 40mV which is amplified by the conditioning unit to 0 to 2.5V and sampled by ADC. As these components are normally used for scales, the sampling frequency is necessarily rather low (each load cell can be read 4 times a second). The resolution of load sensing in this setup is approximately 16g. To minimize the influence of bit-errors in the ADC, our driver software only calculates the position of objects between 100g and 100Kg (objects less than 100g are ignored).
3.1 Algorithm to Determine the 2D Position of an Object on a Surface
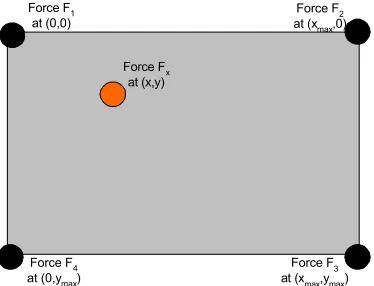
To detect the position of an object we calculate the centre of pressure on the surface based on the load measured at each corner of the table. The overall force on the surface introduced by an object placed on the surface at x,y is denoted by Fx. The
setup assumes static forces, so the sum of all 4 load cells F1, F2, F3, and F4 is equal to
Fx, see equation (1) and figure 1. If there is already an object on the table-top that is
represented by F0x that can be measured by the forces on each load cell F01, F02, F03,
and F04, see equation (2), then we need to incorporate these into our algorithm for
computing the position of a new object. The algorithm for identifying the position of a new object on a pre-loaded surface is described by equation (3) and (4) below.
4 3 2
1
F
F
F
F
F
x=
+
+
+
(1)4 3 2
1
0
0
0
0
0
F
F
F
F
F
x=
+
+
+
(2))
0
(
)
0
(
)
0
(
2 2 3 3max x x
F
F
F
F
F
F
x
x
−
−
+
−
=
(3))
0
(
)
0
(
)
0
(
3 3 4 4max x x
F
F
F
F
F
F
y
y
−
−
+
−
=
(4)from the ADC and average them over the last 4 values. The size of the surface is fixed in this experiment, xmax is 135cm and ymax is 75cm. The calculation for the position is
rounded to centimetres.
3.2 Proof of Concept: Position on the Surface
To carry out the experiments we developed a program in Visual Basic that reads periodically from the ADC, calculates the point of pressure, and visualizes the result. In the program the user can manually reset the preload by pressing a button, storing the currently measured forces into F01, F02, F03, and F04.
In the first experiment, the position of objects on the table-top is detected. Before each object was placed on the surface, we measured and stored the preload F01, F02,
F03, and F04 resulting from the table top itself. We then selected six well distributed
positions and marked them on the surface. We measured the x and y coordinates of each of the positions manually and recorded them for later comparison. Next we systematically placed one object at a time onto the selected points. After we put each the object down and the values stabilised, we measured the load F1, F2, F3, and F4, and
calculated its position. This sequence was repeated for all six objects.
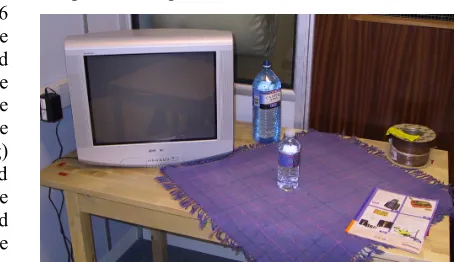
The objects we chose to measure were everyday items of varying weights, and included a 500ml water bottle (about 530g) and a two litre water jar (about 2kg). We regard the centre of the object as its position.
The results of the experiment show that it is possible to achieve an accuracy of about 2% of the surface length in each dimension. In our tests this corresponds to less than 4cm in the y axis 2cm in x axis. The difference between the positions obtained from the weight calculations during repetitions of the experiment with the same set of objects is even smaller: the maximum difference in both axis was 1cm, indicating that we can achieve higher resolution by calibrating the system – if desired by the application.
Force Fx
at (x,y) Force F1
at (0,0)
Force F3 at (xmax,ymax)
Force F4
at (0,ymax)
Force F2
[image:5.595.196.383.153.296.2]at (xmax,0)
3.3 Real Environment: Position on a Tablecloth covered Surface with Preload
To simulate a more realistic environment, we repeated the same experiment with a number of different objects already placed on the table. The table top was covered with a tablecloth. Five objects were randomly distributed on the surface before the preload values were acquired. These objects were: a TV-set, a book, a 2 litre water bottle, a magazine and a cable reel, totalling an overall weight of about 34kg. Figure 2 illustrates this setup.
The initial set of measurement tests were repeated, the objects now being added on top of the TV-set, on the magazine, and the other four on the tablecloth.
The results we obtained were similar to those obtained in the original experiment with the empty table. In most cases we achieve a slightly better resolution because the additional weight provides stability to the system.
This experiment shows that using load sensing we can determine the static position of an object on a surface irrespective of objects already on the surface or between the surface and the new object. Furthermore, our results indicate that it is possible to reliably obtain centimetre level accuracy. The success of such an experiment also lead us to postulate that our approach for object detection is deployable in non-lab environments and is especially well suited to ubiquitous computing settings.
4 Recognizing Interaction on a Load Sensing Surface
As the world is not static and we interact with objects, place them on surfaces and remove them again it is of interest to recognize events that relate to these actions. In the second series of experiments, we explore how interaction resulting from events on a load sensitive surface can be recognized with a simple algorithmic approach.
The setup used for the experiment is a wooden table-top, 80x80cm, resting on 4 industrial load cells. Each of the load cells can handle a maximum load of 20N. The weight of the table-top is about 1kg. For this setup we built a hardware which amplifies the output signal of the load cells by 220, resulting in an output voltage of between 0 and 4.4V. Each of the 4 signals is sampled at 250Hz with 10 bit resolution using a PIC16F876
[image:6.595.240.468.522.653.2]microcontroller. The microcontroller is connected to a PC via a serial line. The objects used to generate the events in this experiment are a 500ml water bottle (520g) and a book (~200g). Detailed information and the schematics, software, and datasets are available on the project web page [12].
4.1 Algorithm to Detect Interaction Events on a Surface
To detect the events we use an algorithm which considers the last 500ms using a sliding window and the sum of load (Fx). At the selected sampling frequency, this
equates to the last 125 sample values, denoted by Fx(t),…, Fx(t-124). At each sample
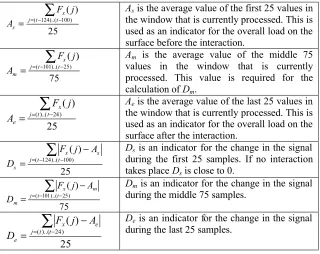
interval we run the analysis algorithm described by the formulae shown in table 1. The expressions have been selected to be as simple as possible to facilitate easy implementation on a microcontroller1 while at the same time yielding reliable event
detection and differentiation.
In the following experiment we investigate whether or not it is possible to recognize different events based on the features extracted from the data gathered. Here we concentrate on the most important primitives: putting objects down onto the surface and removing objects from the surface. We also included a further event: knocking an object over which is already on the surface. The following rules are used to decide which event has taken place.
1 In the later implementation the features were adjusted so that the division could be replaced
by a shift operation.
25 ) ( ) 100 )..( 124 (−
∑
− == j t t x
s
j F A
Asis the average value of the first 25 values in
the window that is currently processed. This is used as an indicator for the overall load on the surface before the interaction.
75 ) ( ) 25 )..( 101 (−
∑
− == j t t x
m
j F A
Am is the average value of the middle 75
values in the window that is currently processed. This value is required for the calculation of Dm.
25 ) ( ) 24 )..( (
∑
− == j t t
x
e
j F A
Aeis the average value of the last 25 values in
the window that is currently processed. This is used as an indicator for the overall load on the surface after the interaction.
25 ) ( ) 100 )..( 124 (−
∑
− = −= j t t
s x s A j F D
Dsis an indicator for the change in the signal
during the first 25 samples. If no interaction takes place Ds is close to 0.
75 ) ( ) 25 )..( 101 (−
∑
− = − = j t tm x m A j F D
Dmis an indicator for the change in the signal
during the middle 75 samples.
25 ) ( ) 24 )..( (
∑
− = − = j t te x e A j F D
De is an indicator for the change in the signal
[image:7.595.137.457.346.600.2]during the last 25 samples.
• Putting an object on the surface.
This is characterized by an increase in the overall load. In other words, before the event the overall load is smaller than after the event (As+δ< Ae). The threshold of
weights is denoted by δ. Assuming that once the object has been put down on a surface it remains stable, it can be seen that Ds is close to zero (Ds<ε). In the
middle of the interaction the change to the signal is greater (the moment the object hits the surface) than later (when the object is already on the surface), stated as (Dm> De).
• Removing an object from the surface.
This is inverse of placing an object on the surface, so the overall load is reducing (As>Ae+δ). To begin with the signal is stable (Ds<ε) and the change during the
interaction is greater than at the end (Dm> De).
• Knocking an object over.
When an object is knocked over, this results in a large change in the middle of the interaction, greater than at both the start and the end, and also greater than a set threshold φ, (Dm>φ∧Dm>Ds∧ Dm>De). As the overall weight on the surface stays
the same, As and Ae are similar (|As-Ae|<δ).
4.2 Proof of concept: Events on an Empty Surface
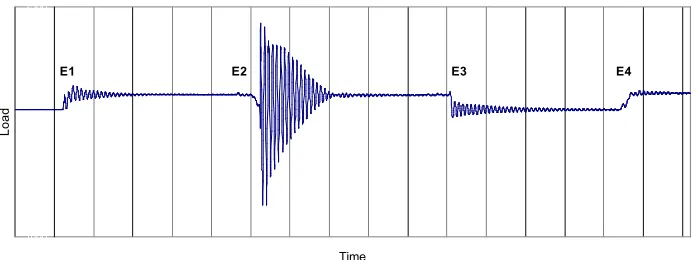
In this experiment the force over time is recorded while a number of different interactions are performed. First, we place the water bottle on the table and remove it after a few seconds. Next, the book is placed or dropped onto the table and lifted away a few seconds later. Lastly, the bottle is put down on the surface, left there for a few seconds, knocked over, and removed after a few seconds. The experiment is repeated with each object ten times. Overall, this experiment results in 70 recorded events for analysis. Using the simple algorithm described above 94% of the events were classified correctly, 6% were missed, and no events were misclassified. A visualization of the raw data stream is shown in figure 3.
1000 1500 2000 2500
Time
Load
[image:8.595.130.478.516.646.2]E1 E2 E3 E4
4.3 Real Environment: Events on Tablecloth covered Surface with Preload
The experiment was repeated on a table that was covered with a tablecloth. On the table were also 4 static objects, a notebook computer (about 2.2kg), a book (about 500g), a newspaper (about 200g) and a water bottle (about 520g). The same sets of interactions were performed. About half of the interactions were made on the tablecloth and the remaining half on top of static objects. Out of the 70 events recorded, the algorithm could classify 96% correctly, 4% were missed.
4.4 Discussion on Event Recognition
As seen from the results of our experiments, it is feasible to detect basic interaction events with a high degree of probability, even when using simple algorithms. We can also observe that covering the surface has a negligible effect on the data recorded. Furthermore, having other objects on the surface of the table, vibrations were deadened increasing the recognition performance.
We believe that it may be possible to use similar techniques to identify further events, such as moving an object on a surface, sliding an object over the surface and touching the surface. The datasets of the experiments reported here and also for other experiments are available on our project web page [11].
The observation that preload has little influence on detecting the events or identifying an object’s position, suggests that it is feasible to implement a system that can dynamically track objects that are added, moved, or removed from surfaces in everyday environments.
5 Incorporating a Weight Lab into a ‘Living Laboratory’
The results obtained by our experiments on using the intrinsic weight of objects to calculate position and detect events and activities on a given surface, suggest that a larger scale implementation would provide us with a rich source of contextual information. In order to prove this we have designed and implemented a “weight lab” as an integral part of our living lab area. In the weight lab, all surfaces are load sensitive and equipped with networked data acquisition units. Currently, the weight lab is comprised of four ‘load sensitive’ artefacts: the floor, two tables and a shelf. Other, non-load sensitive artefacts can be arranged on these surfaces. The arrangement of these artefacts is not fixed; all components can be moved to create new experimental configurations. We have designed the space to be used as a common room, as depicted in figure 8 and 9.
Dedicated hardware has been developed to drive the load cells and facilitate the data acquisition. The current prototype offers both wired RS-232 and wireless communication interfaces to our own custom data analysis software.
5.1 Weight Floor
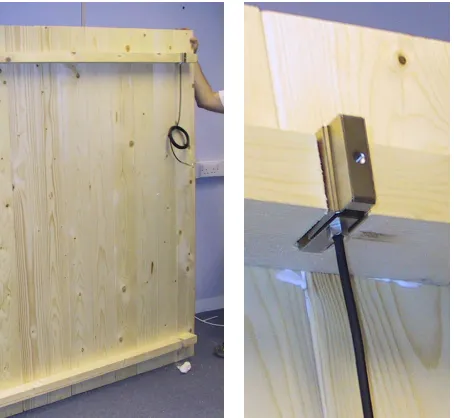
The floor is constructed from a wooden structure of 240cm by 180cm. The surface of the floor is mounted on three supporting timber beams resulting in an overall
height of approximately 9cm. At each corner of the floor a single load cell is mounted into the supporting timber, see figure 4. The whole floor rests entirely on the four load cells and the remaining structure is in contact with the conventional load bearing floor of the building.
An estimate of the typical load in our environment is: 2 people (70kg each), 2 armchairs (15kg each), a coffee table (10kg), a shelf (20kg), and the weight of the floor (80kg) resulting in 280kg.
Due to the structure and anticipated loading of the floor, we selected S-load cells each with a capacity of 1000N. In this range the measurements have a guaranteed accuracy and the cells continue to be overload safe to 2000N (in this range the load cells still give a reading and are not damaged, but their accuracy is reduced). As there are 4 load cells, the total weight that can be put on the floor (including the weight of the floor, itself about 80kg) is 800kg or 400kg with well defined accuracy. The anticipated load of 280kg - even if such a load is not evenly distributed – is still well within the specification.
The four load cells are connected to the data acquisition hardware described later in this section. The floor system incorporates an ‘auto-tare’ mechanism which allows us to discount the position of stationary objects and improve our estimation of the position of new objects introduced into the environment. More specifically, whenever the load is considered stable this preload is stored (F01, F02, F03, and F04) then
factored in to successive calculations to determine the point of pressure of further objects, e.g. the position of someone is walking on the floor. Using this mechanism, furniture can be added to the floor and automatically included in the position calculation once the floor is not occupied for several seconds. Stability is assumed if the values of Ds, Dm, De. are close to zero for more than 5 seconds and the preload
[image:10.595.243.470.150.359.2]
values are updated. The position algorithm, given in section 3 is used for calculating the point of pressure. Note that in case of a single person the position of the person is determined, whereas in case of more people, the point of pressure is the centre of mass of the group. Although not yielding their individual positions, such information may still help us determine the locus of activity.
The floor currently recognises three types of event: no interaction, people moving and stationary occupation (e.g. someone is sitting in an armchair or standing in front of the pin board). These events can be recognized with an accuracy of over 99%. The position of a single person moving in a space already populated with furniture and covered with a rug can be acquired with approximately 10cm accuracy.
5.2 Weight tables and shelves
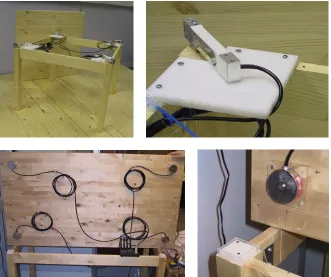
We embedded load sensing technology in several pieces of furniture: a small coffee table, a larger dining table, and a shelf/drawer unit. Both tables are constructed using load cells installed between the table top and the frame, such that the table top rests on a load cell at each corner (see figure 5).
The coffee table can measure a maximum load of 8kg (including the 1.5kg table top). Loads over 8kg are prevented by a mechanical overload protector which also suspends data acquisition. The low overall weight capacity is acceptable given the
[image:11.595.129.460.396.673.2]
normal use of the table (e.g. putting newspapers, magazines and cups on it) and that it permits us a far higher accuracy of measurement. For the larger ‘dining’ table we selected load cells with a capacity of 500N each, resulting in an overall capacity of 200kg (which is appropriate as people sometimes sit or lean on the edge of tables).
The tables and shelves use the same data acquisition hardware as the floor, but run different software on the microcontrollers. The main events we recognise are as explained in section 4. However, with the sensitive small coffee table we are able to track the pressure from a finger or an object over the
surface and convert it into a mouse-like track-pad, for details see [12,16].
The shelf unit was placed on 4 load cells of the same type as the ones used for the large table. The position of the interaction is assigned to a column of the shelf, as a single set of load cells can not detect where in the vertical axis the interaction took place. Additionally, some of the shelf boards within the unit are equipped with load sensing boards. These boards are built based on cheap consumer load cells.
5.3 Hardware for Data Acquisition, Event Recognition and Communication
All of the load cells used in the experiments presented in this paper are based on resistive technology. Put simply, each cell is a wheat stone bridge providing a maximum output signal of 20mV at a driving voltage of 5V. The AD-converter included in the microcontroller can measure voltages between 0 and 5V. To best utilise this range, we amplify the output signal of the load cells by a factor of 220 using an LM324, resulting in a output signal of 0 to 4.4V (the exact values vary slightly between the load cells). The amplified output voltage of each of the load cells is converted into a 10 bit sample; the best resolution offered by the MCU’s internal AD converter. Each of the four input channels is sampled at about 250Hz. The four input values correspond to the load that is measured on each of the load cells, setting the values for F1(t), F2(t), F3(t), and F4(t).
Events from the table and shelf unit are sent wirelessly using an RF transceiver module (Radiometrix BIM2) that offers data rates of up to 64kbit/s. We run the protocol at 19,200 bits/s. Events, such as putting an object down at a certain position, removing an object, tracking over the surface or pressing down, are sent in a single packet. Each packet comprises a preamble, followed by a start-byte, an object identifier to determine the origin (coffee table, large table, shelf), the event type, and the event dependent data. Finally, two bytes of 16-bit CRC are attached to ensure that the transmitted data will be received correctly. The data acquisition unit only
[image:12.595.308.463.149.305.2]transmits data (there are no acknowledgements), however, we have found the protocol to be very reliable at the low transmission speed.
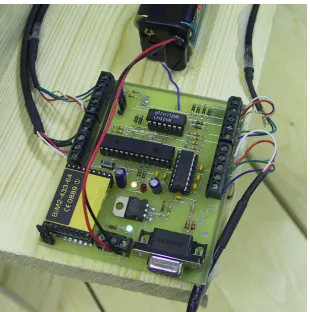
The hardware module used for data acquisition (as depicted in figure 6) also acts as a base station that receives the events and sends them to the host PC via RS-232. The floor is directly connected to the PC. The experiments reported in the next section are based on this hardware.
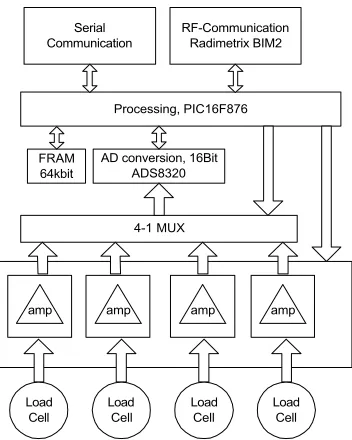
Learning from the experience gained by deploying our system we have designed and built a second hardware iteration that offers some improvements over our first design. The block diagram of the newer system is depicted in figure 7. In
particular the following improvements have been made:
• Increased AD resolution.
To avoid the influence of single bit errors in the position calculation and also to increase the weight range of the objects that can be detected, an ADC with higher resolution has been chosen (an external 16 bit ADS8320 analog to digital converter with a voltage reference of 3.3V). This chip offers only one input so a multiplexer was used.
• In order to improve the performance of the amplification we used instrumentation amplifier (INA118 from Analog Devices) instead of Op-Amps. The INA118 offers an amplification range of up to a factor of 10000.
• As the load on the surface changes and as it is also desirable to be able to detect very light objects or minimal interaction, the factor for the amplification can be selected at runtime from the microcontroller. Two amplification factors are implemented (factor 150 and 1000) using a solid state relay that switches resistors in the periphery of the instrumentation amplifier.
• Additional RAM.
In some of the more advanced scenarios we conceived, we realized that keeping a history on the artefact is useful to detect more complex events or patterns of events. Therefore we added a FRAM chip that is connected over I2C and offers
8KByte of non-volatile RAM (FM24C64 from Ramtron).
Further technical details, full schematics, and PCB layouts together with the software are available on our project page [11].
4-1 MUX
Load Cell
Load Cell
Load Cell
Load Cell
amp amp amp amp
AD conversion, 16Bit ADS8320 Processing, PIC16F876
RF-Communication Radimetrix BIM2 Serial
Communication
FRAM 64kbit
[image:13.595.281.457.148.368.2]5.4 Software
Several pieces of software have been developed to capture and analyse the data from the load sensors. The microcontroller runs a basic interactive system which allows the user to configure the board for a particular artefact via serial line. Parameters, such as the size of the surface, sampling speed and the object identifier can be specified using a serial terminal program. These parameters are permanently stored in the internal EEPROM of the microcontroller. After the board is configured all events recognized are broadcast using the RF module.
On the base station a program is running that receives all the broadcast events and passes them to the PC. The unit offers two modes: one where all the data coming in is streamed over the serial line, and the other, where the last 3 events are stored for each artefact and can be requested from the PC using the artefact identifier.
We have also developed a number of programs for the PC to allow the storage and visualisation of the data. One of these applications is depicted in the following section in figure 8. This application visually maps events happening on the tables and on the floor onto the plan of the lab.
6 Applying the Setup in a real-world Environment
The infrastructure described in section 5 is deployed in a part of our living lab area. The basic floor plan and photos are presented in figure 8 and 9. On one side of the floor there are two armchairs. In front of the armchairs there is the coffee table. On the wall behind the floor there are two pin boards. To one side of the floor is the larger table, next to the floor. On this table is a TV-set and people put things temporally down (e.g. orders arrived, books, food) on the remaining part of the table. The area is used to as a place where people come and chat, have a coffee or where people read.
In the remainder of this section we will report on some of the applications implemented on the load sensing infrastructure and also on the experience gained from deploying the system.
6.1 “Don’t leave your things behind” – Application
This application shows the potential of having interconnected surfaces that can sense weight. As the larger table is used by people to leave items (e.g. files, books, etc.) temporally, people sometimes forget whatever they have put down when they leave. This application reminds the user to take their objects with them when they leave the room. The basic idea of the application was inspired by ethnographic studies reported in [4].
surface while entering – the software running on the PC provides an audio cue to remind the user to take his items with him. As the weight of the object is known it is also possible to prompt the user when the disappearing weight is not matching those stored in the dataset.
6.2 Tracking the Position of a single Person and Estimating Activity
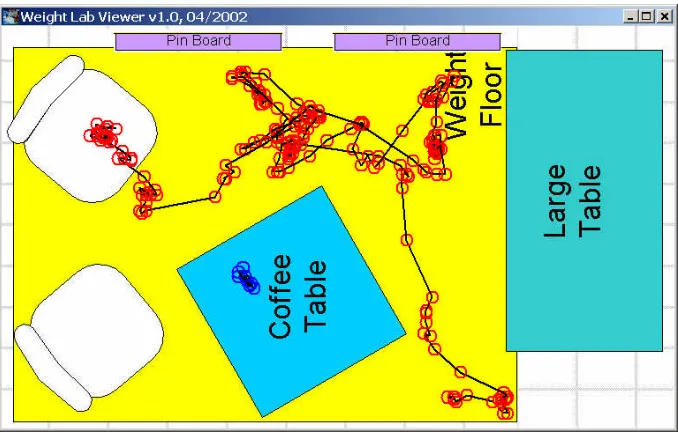
[image:15.595.129.468.269.486.2]Using the setup described we have built an application that can track the position of a person in the space. The position of the person is visualized, as shown in figure 8. The
Fig. 8. Weight lab viewer showing a trace on the floor layout of the lab and also some interaction with the table (object put down).
[image:15.595.133.464.525.658.2]
position of the person is available in the system as coordinates in centimetres (x,y). Given domain knowledge, e.g. the whereabouts of furniture, walls and devices, this makes it possible to provide the position information in a symbolic form, such as on chair 1, on chair 2, in front of the left pin board, in front of the right pin board, in front of the TV, entering the floor. As suggested in [3], geometric domain knowledge can also be used to create a higher level description of the position. The positional information is also available via HTTP to be included in other applications. As there is also a temporal element to the tracking data the direction and speed of movement can be determined and offered to applications for further use.
Accumulating the tracking data over time offers a way to estimate the overall activity in the space. A simple measure for this is to calculate the distance the person has covered in a certain time.
6.3 Recognizing Situations
In figure 8, the tracked activity over a period of approximately 50 seconds is illustrated. The corresponding situations are shown in figure 9. The person is entering the floor, going to the left pin board, turning around to the right pin board, and then walking to the upper arm chair. On his way he puts a chocolate bar on the table.
The context of sitting down on a particular chair, putting a cup down on the table, taking a magazine from the table can all be recognized in the above setting. On a longer time scale, it may be possible to determine patterns that relate to non-atomic longer term activities such as drinking coffee, having lunch, reading the newspaper given certain side conditions, such as domain specific knowledge about the location.
These situations can be described in terms of rules. For some of the situation these rules involve constants that are specific for the space which is occupied, e.g. the position of the pin board or where the table is. These constants are acquired either geometrically by measuring and calculation, or by supervised learning from example situations.
As more people enter the same space, the recognition of context is made more complex. However as people enter one after another (even if the time between them may be very short, e.g. less then a second) it is still possible to detect the number of subjects. When multiple people are on the weight sensitive floor the centre of pressure is usually between them (their aggregate centre of mass). For example when both chairs are occupied the centre of pressure is in the middle between the chairs. To recognize such contexts we find it useful to create the situation, log the data, and record the analysis as vectors; new situations are then matched against these samples to select the closest match. This can be realized using nearest neighbour matching or more complex supervised learning methods.
7 Conclusion
objects, we have shown that load sensing can also be used to obtain positional information and interaction events.
We have demonstrated that the position of objects on surfaces can be determined with high accuracy and reliability. It has to be stressed that the algorithms are simple, and geared toward implementation on low-cost micro-controller platforms. Further, interaction events such as object placement on and removal from a surface can be detected, likewise with high reliability and little computational cost.
The reported experiments also highlight the applicability in everyday settings which we have simulated by preloading surfaces with additional objects. In order to continue to study load sensing under living lab conditions we have augmented a number of surfaces, including a relatively large unsegmented floor area, various tables and shelves. The setup is an example for unobtrusive facilitation of everyday environments with context acquisition technology. This property is especially relevant in domains where preserving privacy is a central issue, e.g. care for elderly and assisted living.
In our future work we will build on our basic techniques for identification, positioning and event detection and develop algorithms that account for complex interactions with multiple objects on surfaces, and that support object tracking across multiple surfaces.
Acknowledgement
This research was partially funded by the Equator IRC, EPSRC GR/N15986/01
(http://www.equator.ac.uk).
References
1. Addlesee, M.D., Jones, A., Livesey, F., and Samaria, F.: ORL Active Floor. IEEE Personal Communications, Vol.4, No 5, October 1997, pp. 35-41. IEEE, Piscataway, NJ, USA. 2. Addlesee, M.D., Curwen, R., Hodges, S., Newman, J., Steggles, P., Ward, A., Hopper, A.:
Implementing a Sentient Computing System. IEEE Computer Magazine, Vol. 34, No. 8, August 2001, pp. 50-56.
3. Brumitt, B., Krumm, J., Meyers, B., and Shafer, S.: Ubiquitous Computing and the Role of Geometry. IEEE Personal Communications, August 2000.
4. Crabtree, A., Hemmings, T. and Rodden, T.: Pattern-based Support for Interactive Design in Domestic Settings. Technical Report Equator-01-016, University of Nottingham, The School of Computer Science and IT, December 2001.
http://www.equator.ac.uk/papers/Authors/crabtree.html
5. Dey, A.K.: Providing Architectural Support for Building Context-Aware Applications. Ph.D. thesis, December 2000, Dr. Gregory D. Abowd (advisor), College of Computing, Georgia Institute of Technology
6. Georgia Institut of Technology. The Aware Home Research Initiative.
http://www.cc.gatech.edu/fce/ahri/
8. Kidd, C., Orr, R., Abowd, G.D., Atkeson, C.G., Essa, I.A., MacIntyre, B., Mynatt, E., Starner, T.E., and Newstetter, W.: The Aware Home: A Living Laboratory for Ubiquitous Computing Research. Proceedings of the Second International Workshop on Cooperative Buildings - CoBuild'99. Position paper, October 1999.
9. Kistler force plate. http://www.kistler.com/
10.Konomi, S., Müller-Tomfelde, C., Streitz, N.: Passage: Physical Transportation of Digital Information in Cooperative Buildings. In: Streitz, N., Siegel, J., Hartkopf, V., Konomi, S. (Eds.), Cooperative Buildings - Integrating Information, Organizations, and Architecture. Proceedings of the Second International Workshop (CoBuild'99). LNCS 1670. Springer: Heidelberg. pp. 45 -54.
11.Krumm, J., Harris, S., Meyers, B., Brumitt, B., Hale, M., and Shafer S.: Multi-Camera Multi-Person Tracking for EasyLiving. IEEE Workshop on Visual Surveillance, July 2000. 12.Lancaster University, Embedded load sensing project,
http://www.comp.lancs.ac.uk/~albrecht/load/
13.Orr, R. J. and Abowd, G. D.: The Smart Floor: A Mechanism for Natural User Identification and Tracking. Proceedings of CHI 2000 Human Factors in Computing Systems (April 1–6, 2000, The Hague, Netherlands), ACM/SIGCHI.
14.Paradiso, J, Abler, C., Hsiao, K., Reynolds, M.: The Magic Carpet: Physical Sensing for Immersive Environments. In Late-Breaking/Short Demonstrations of CHI'97, pp.277-278. ACM, USA.
15.Schilit, B.N., Adams, N.I., Want, R.: Context-Aware Computing Applications. Proceedings of the Workshop on Mobile Computing Systems and Applications, Santa Cruz, CA, December 1994. Pages 85-90. IEEE Computer Society.
16.Schmidt A., Laerhoven, K., Strohbach, M., Gellersen, H.: Ubiquitous Interaction - Using Surfaces in Everyday Environments as Pointing Devices. Paper submitted to 7th ERCIM Workshop "User Interfaces For All", 2002.