Analysis of Traffic Patterns using Computer Vision and
Wireless Sensor Network
Param Trivedi
B. Tech in Computer Science Nirma University
ABSTRACT
Traffic patterns analysis and solutions for traffic is the emerging field. To determine the patterns of traffic flow and with the help of that data reports can be generated to build the sustainable infrastructure. So that the infrastructures like bridges and fly over will build such that they will be solving problems of the traffic in the current scenarios. To overcome the problem of traffic we propose a solution that with help of computer vision and wireless sensor networks.
General Terms
Computer Vision Algorithms, Wireless sensor network
Keywords
XBEE, WSN, OPENCV
1.
INTRODUCTION
We will be doing the simulation to analyze the traffic patterns and predict the accurate data. That data will be used by the infrastructure consultancies to build the highways and flyovers. As an example if one company wants to build the highway on a particular route it needs to know what type of vehicle in what amount, at what frequency goes from there. So that they can build the efficient infrastructure which will be able to sustain the infrastructure on the long period of the time. So that the problems like traffic congestion will be eliminated from the root.
For this we will be developing algorithms for the computer vision which will be able to get the traffic patterns when required by the government using the wireless sensors deployed across the city and some of them on the highways. For the communication we will be sending the data over the wireless protocols using the 802.15.4. To send the data we will be using the leach protocol of the wireless sensor network.
In wireless sensor networks (WSNs), due to the limitation of nodes’ energy, energy efficiency is an important factor should be considered when the protocols are designing. As a typical representative of hierarchical routing protocols, LEACH Protocol plays an important role. In response to the uneven energy distribution that is caused by the randomness of cluster head forming, this paper proposes a new improved algorithm of LEACH protocol (LEACH-TLCH) which is intended to balance the energy consumption of the entire network and extend the life of the network . The new algorithm is emulated by Matlab simulation platform, the simulation results indicate that both energy efficiency and the lifetime of the network are better than that of LEACH Protocol.
2.
PROPOSED SOLUTION TO
PROBLEM
2.1
What is the Problem?
Urban Population to reach 50 Crore by 2017 which is 30.1 Crore as of now.
(Planning Commission of India, 2012)
The problem is that because of rapid development, urbanization and an unprecedented growth rate the services or the infrastructure rendered are ill-equipped.
As a result of such a condition of India, we as planners see that either the services are not able to cope with the current scenario (as we see with the traffic issues and road infrastructure) or the new development is over-planned as it pretty much depends on a lot of assumptions.
Number of Urban Cities to rise from 475(2011) to 600 in 2011. (Projected).
(Census of India 2012)
Seven, Tier 1 cities face issues with transportation and mobility in their daily lives which leads problems like wastage of time and resources. Also with the trend of urbanization these cities along with 18 of the 42 tier 2 cities are projected to experience a pressure point on the city’s infrastructure. One of the most pressurized infrastructures of city that is being affected by urbanization is the transport and mobility channel.
The traffic problems in the country can be solved by constructing infrastructure such that it can survive the traffic and vehicles for a long time also. So the expense to reconstruct the structure will be solved.
2.2
Whom does the Problem Affect?
Whom does the problem affect? (Key stakeholders)Mass population
The total population of tier1 cities is 160 million people, which is projected to double by 2030. These 160 million people are indirectly affected with the pressure of a skewed demography. These people indirectly invest their resources in order to reap the economic advantage of a tier1 city but suffer because of the lag of unstructured resources.
Planning institutes
Government
The government or the statutory bodies who are responsible for catering the transportation and mobility needs are one of the major stake holders as because of unorganized, timed lagged data- they end up over engineering the solutions. These solutions can be optimized if there is accurate, fast, real time data in order to optimize and not over engineer traffic issues.
The effect of the problem can be seen on both classes. Those who are at the receiver’s end who end up using the services and those who are at giving the services, as they end up using unnecessary resources and time in planning.
86- Road transportation and highway projects were delayed which resulted into cost overruns of 52,445 Crore.
(MOSPI-2012, MAY)
3.
WIRELESS SENSOR NETWORK
COMPONENTS
[image:2.595.55.281.237.436.2]Figure 1: Heat Map by Sensors for the Traffic
We will be using the open source microcontrollers like raspberry pi to process the frames and send processed data to the base station using the communication modules. The raspberry pi works on the 400 MHz frequency so we will need to calibrate the frames such that computation power of the board can be used essentially. We will be using the operating system Raspbian Debian based Linux to process the opencv code and by this we will attach the camera to the microcontroller. We will be using the depth cameras with the board to process the data so that we can detect the vehicles even at the night. This will be the strongest point to replace the annual surveys.
The Raspberry Pi is a credit card-sized single-board computer developed in the UK by the Raspberry Pi Foundation with the intention of promoting the teaching of basic computer science in schools.
The Raspberry Pi is manufactured in three board configurations through licensed manufacturing agreements with Newark element14 (Premier Farrell), RS Components and Ego man. These companies sell the Raspberry Pi online. Ego man produces a version for distribution solely in China and Taiwan, which can be distinguished from other Pis by their red coloring and lack of FCC/CE marks. The hardware is the same across all manufacturers.
In 2014, the Raspberry Pi Foundation launched the Compute Module, which packages a Raspberry Pi Model B into module for use as a part of embedded systems, to encourage their use.
The Raspberry Pi is based on the Broadcom BCM2835 system on a chip (SoC), which includes an ARM1176JZF-S 700 MHz processor, Video Core IV GPU, and was originally shipped with 256 megabytes of RAM, later upgraded (Model B & Model B+) to 512 MB. The system has Secure Digital (SD) or Micro SD (Model B+) sockets for boot media and persistent storage.
The Foundation provides Debian and Arch Linux ARM distributions for download. Tools are available for Python as the main programming language, with support for BBC BASIC (via the RISC OS image or the Brandy Basic clone for Linux), C, C++, Java, Perl and Ruby.
As of October 2014, about 3.8 million boards had been sold.
4.
COMPUTER VISION ALGORITHMS
The heading of a section should be in Times New Roman 12point bold in all-capitals flush left with an additional 6-points of white space above the section head. Sections and subsequent sub- sections should be numbered and flush left. For a section head and a subsection head together (such as Section 3 and subsection 3.1), use no additional space above the subsection head.
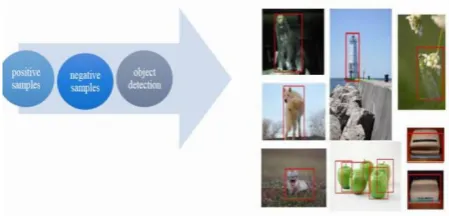
Figure 2: Object detection using haar cascades and background subtraction
4.1
Object Detection
Object detection is one of the fundamental tasks in computer vision. A common paradigm to address this problem is to train object detectors which operate on a sub-image and apply these detectors in an exhaustive manner across all location sand scales. This paradigm was successfully used within a discriminatively trained Deformable Part Model (DPM) to achieve state-of-art results on detection tasks. The exhaustive search through all possible locations and scales poses a computational challenge. This challenge becomes even harder as the number of classes grows, since most of the approaches train a separate detector per class. In order to address this issue a variety of methods were proposed, varying from detector cascades, to using segmentation to suggest a small number of object hypotheses. In this paper, we ascribe to the latter philosophy and propose to train a detector, called “Deep Multi Box”, which generates a small number of bounding boxes as object candidates. These boxes are generated by a single Deep Neural Network (DNN) in a class agnostic manner. Our model has several contributions. First, we define object detection as a regression problem to the coordinates of several bounding boxes. In addition, for each predicted box the net outputs a confidence score of how likely this box contains an object.
[image:2.595.314.539.320.428.2]For each training example, we solve an assignment problem between the current predictions and the ground truth boxes and update the matched box coordinates, their confidences and the underlying features through back propagation. In this way, we learn a deep net tailored towards our localization problem. We capitalize on the excellent representation learning abilities of DNNs, as exemplified recently in image classification [11] and object detection settings [15], and perform joint learning of representation and predictors. Finally, we train our object box predictor in a class agnostic manner. We consider this as a scalable way to enable efficient detection of large number of object classes. We show in our experiments that by only post-classifying less than ten boxes, obtained by a single network application, we can achieve competitive detection results. Further, we show that our box predictor generalizes over unseen classes and as such is flexible to be re-used within other detection problems.
The literature on object detection is vast, and in this section we will focus on approaches exploiting class-agnostic ideas and addressing scalability. Many of the proposed detection approaches are based on 1 part-based models which more recently have achieved impressive performance thanks to discriminative learning and carefully crafted features. These methods, however, rely on exhaustive application of part templates over multiple scales and as such are expensive. Moreover, they scale linearly in the number of classes, which becomes a challenge for modern datasets such as Image Net 1. To address the former issue, Lampert et al. use a branch-and bound strategy to avoid evaluating all potential object locations. To address the latter issue, Song et al. use a low dimensional part basis, shared across all object classes.
A hashing based approach for efficient part detection has shown good results as well as different line of work, closer to ours, is based on the idea that objects can be localized without having to know their class. Some of these approaches build on bottom-up classless segmentation The segments, obtained in this way, can be scored using top-down feedback Using the same motivation, Alexa et al. use an inexpensive classifier to score object hypotheses for being an object or not and in this way reduce the number of location for the subsequent detection steps. These approaches can be thought of as multilayered models, with segmentation as first layer and a segment classification as a subsequent layer. Despite the fact that they encode proven perceptual principles, we will show that having deeper models which are fully learned can lead to superior results. Finally, we capitalize on the recent advances in Deep Learning, most noticeably the work by Krizhevsky et al. We extend their bounding box regression approach for detection to the case of handling multiple objects in a scalable manner. DNN-based regression applied to object masks has been investigated by Szegedy et al. This last approach achieves state-of-art detection performance on VOC2007 but does not scale up to multiple classes due to the cost of a single mask regression: in that setup, one needs to execute 5 networks per class at inference time, which is not scalable for most real-world applications.
4.2
Proposed Approach
We aim at achieving a class-agnostic scalable object detection by predicting a set of bounding boxes, which represent potential objects. More precisely, we use a Deep Neural Network (DNN), which outputs a fixed number of bounding boxes. In addition, it outputs a score for each box expressing the network confidence of this box containing an object. Model To formalize the above idea, we encode the i-th object box and its associated confidence as node values of the last net
layer: Bounding box: we encode the upper-left and lower right coordinates of each box as four node values, which can be written as a vector li 2 R4. These coordinates are normalized w. r. t. image dimensions to achieve invariance to absolute image size. Each normalized coordinate is produced by a linear transformation of the last hidden layer. Confidence: the confidence score for the box containing an object is encoded as a single node value ci 2 [0; 1]. This value is produced through a linear transformation of the last hidden layer followed by a sigmoid. We can combine the bounding box locations, as one linear layer. Similarly, we can treat collection of all confidences as the output as one sigmoid layer. Both these output layers are connected to the last hidden layers. At inference time, our algorithm produces K bounding boxes. In our experiments, we use K = 100 and K = 200. If desired, we can use the confidence scores and no maximum suppression to obtain a smaller number of high confidence boxes at inference time. These boxes are supposed to represent objects. As such, they can be classified with a subsequent classifier to achieve object detection. Since the number of boxes is very small, we can afford powerful classifiers. In our experiments, we use second DNN for classification [11]. Training Objective We train a DNN to predict bounding boxes and their confidence scores for each training image such that the highest scoring boxes match well the ground truth object boxes for the image. Suppose that for a particular training example, M objects were labeled by bounding boxes gj , j 2 f1; : : : ;Mg. In practice, the number of predictions K is much larger than the number of ground truth boxes M. Therefore, we try to optimize only the subset of predicted boxes which match best the ground truth ones. We optimize their locations to improve their match and maximize their confidences. At the same time we minimize the confidences of the remaining predictions, which are deemed not to localize the true objects well. To achieve the above, we formulate an assignment problem for each training example. Let xij 2 f0; 1g denote the assignment: xij = 1 iff the i-th prediction is assigned to j-th true object. The objective of this assignment can be expressed where we use L2 distance between the normalized bounding box coordinates to quantify the dissimilarity between bounding boxes. Additionally, we want to optimize the confidences of the boxes according to the assignment x. Maximizing the confidences of assigned predictions can be expressed as:
In the above objective P j xij = 1 iff prediction i has been matched to a ground truth. In that case ci is being maximized, while in the opposite case it is being minimized. A different interpretation of the above term is achieved if we j xij view as a probability of prediction i containing an object of interest. Then, the above loss is the negative of the entropy and thus corresponds to a max entropy loss.
4.3
Neural Network Results
The network architecture for the localization and classification models that we use is the same as the one used by. We use Adagrad for controlling the learning rate decay, mini-batches of size 128, and parallel distributed training with multiple identical replicas of the network, which achieves faster convergence. As mentioned previously, we use priors in the localization loss – these are computed using k-means on the training set. We also use 0:3 to balance the localization and confidence losses. The localizer might output coordinates outside the crop area used for the inference. The coordinates are mapped and truncated to the final image area, at the end.
interest or “background”. To train our localizer networks, we generated approximately millions of images (10–30 million, depending on the dataset) from the training set by applying the following procedure to each image in the training set. For each image, we generate the same number of square samples such that the total number of samples is about ten million. For each image, the samples are bucketed such that for each of the ratios in the ranges of 05%; 515%; 1550%; 50100%, there is an equal number of samples in which the ratio covered by the bounding boxes is in the given range. For the experiments below we have not explored any non-standard data generation or regularization options. In all experiments, all hyper-parameters were selected by evaluating on a held out portion of the training set (10% random choice of examples). The Pascal Visual Object Classes (VOC) Challenge is the most common benchmark for object detection algorithms. It consists mainly of complex scene images in which bounding boxes of 20 diverse object classes were labelled. In our evaluation we focus on the 2007 edition of VOC, for which a test set was released. We present results by training on VOC 2012, which contains approx. 11000 images. We trained a 100 box localizer as well as a deep net based classifier [11].
We trained the classifier on a data set comprising of 10 million crops overlapping some object with at least 0:5 Jaccard overlap similarity. The crops are labeled with one of the 20 VOC object classes. 20 million negative crops that have at most 0:2 Jaccard similarity with any of the object boxes. These crops a re labeled with the special “background” class label. The architecture and the selection of hyper parameters followed that of [11].
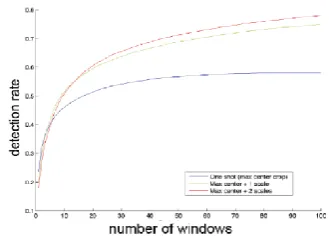
[image:4.595.317.541.461.558.2]In the first round, the localizer model is applied to the maximum center square crop in the image. The crop is resized to the network input size which is 220 _ 220. A single pass through this network gives us up to hundred candidate boxes. After a non-maximum-suppression with overlap threshold 0:5, the top 10 highest scoring detections are kept and were classified by the 21-way classifier model in a separate passes through the network. The final detection score is the product of the localizer score for the given box multiplied by the score of the classifier evaluated on the maximum square region around the crop. These scores are passed to the evaluation and were used for computing the precision recall curves.
Figure 3: Detection Rate with Number of windows
5.
DATA AQUIRING AND RESULTS
Data gathering will be done by the radio modules and mobile network modems to get the data on server. There will be four nodes on each cross road. Each of them will be transmitting data to the head node of that area. The head node will send the data to the base station every minute. The base station will push the data on the internet and each client will be able to view the reports via the information portal.802.15.4 is a standard for wireless communication issued by the IEEE (Institute for Electrical and Electronics Engineers).
[image:4.595.79.244.529.647.2]The IEEE is a technical professional association that has written numerous standards to promote growth and interoperability of existing and emerging technologies. IEEE has published the standards that define communication in areas such as the Internet, PC peripherals, industrial communication and wireless technology. As a few examples, the IEEE 802.11 standard defines communication for wireless LAN and 802.16 defines communication for broadband wireless Metropolitan Area Networks. While both of those wireless standards are concerned with higher bandwidth Internet access applications, 802.15.4 was developed with lower data rate, simple connectivity and battery application in mind. The 802.15.4 standard specifies that communication can occur in the 868-868.8 MHz, the 902-928 MHz or the 2.400-2.4835 GHz Industrial Scientific and Medical (ISM) bands. While any of these bands can technically be used by 802.15.4 devices, the 2.4 GHz band is more popular as it is open in most of the countries worldwide. The 868 MHz band is specified primarily for European use, whereas the 902-928 MHz band can only be used in the United States, Canada and a few other countries and territories that accept the FCC regulations. The 802.15.4 standard specifies that communication should occur in 5 MHz channels ranging from 2.405 to 2.480 GHz. In the 2.4 GHz band, a maximum overthe-air data rate of 250 kbps is specified, but due to the overhead of the protocol the actual theoretical maximum data rate is approximately half of that. While the standard specifies 5 MHz channels, only approximately 2 MHz of the channel is consumed with the occupied bandwidth. At 2.4 GHz, 802.15.4 specifies the use of Direct Sequence Spread Spectrum and uses an Offset Quadrature Phase Shift Keying (O-QPSK) with half-sine pulse shaping to modulate the RF carrier. The graph below shows the various channels at the spacing specified by 802.15.4.
Figure 4: Frequency Rate RF Carrier
Wireless sensor network routing topology- leach protocol is used here to save the cost of transmission. Here we can also use the open garden protocol to implement the mesh topology and p2p topology to establish the communication channel so that data can be transmitted to station without the special mobile data sources. Which will lead to the higher cost savings on the longer periods.
6.
CONCLUSION
Computer vision is still in the phase of under development when it comes to the application which require very robust solutions because of light and weather problems. In this paper the solution is given with the combination of the wireless sensor networks and computer vision to solve many problems.
7.
ACKNOWLEDGMENTS
8.
REFERENCES
[1] J.J.Blum,A.Eskandarian, and L. J. Huffman, “Challenges of intervehicle ad-hoc networks,” IEEE Transactions on Intelligent Transportation System, Vol.5, no.4, pp. 347-351, 2004.
[2] http://www.its.dot.gov/vii/index.htm.
[3] K. Bilstrup, E. Uhlemann, E. G. Storm, and U. Bilstrup, “Evalution of the IEEE 802.11p MAC method for vehicle-to-vehicle communication,” in Proceedings of the 68th IEEE Vehicular Technology Conference (VTC’08), pp.1-5, Calgary, Canada, September 2008.
[4] K. Bilstrup, E. Uhlemann, E. G. Storm, “Medium access control in vehicular networks based on the upcoming IEEE 802.11p standard,” in Proceedings of the 15th World Congress on Intelligent Transport Systems (ITS’08),pp.1-12, New York, USA, November 2008.
[5] http://standards.ieee.org/board/nes/projects/80211p.pdf
[6] K. Bilstrup, “A survey regarding wireless communication standards intended for a high-speed vehicle environment,” Technical Report IDE 0712, Halmstad University, Sweden, Feb. 2007.
[7] L. Stibor, Y. Zang and H-J. Reumermann, “Evaluation of communication distance of broadcast messages in a vehicular ad- hoc network using IEEE 802.11p,” in Proc. IEEE Wireless Communications and Networking Conf., Hong Kong, China, Mar. 2007, pp. 254-257.
[8] M. Wellen, B. Westphal and P. Mahonen, “Performance evaluation of IEEE 802.11-based WLANs in vehicular scenarios,” in Proc. IEEE Vehicular Technology Conf., Dublin, Ireland, Apr. 2007, pp. 1167-1171.
[9] W. Xiang, P. Richardson and J. Guo, “Introduction and preliminary experimental results of wireless access for vehicular environments (WAVE) systems,” in Proc. Int. Conf. Mobile and Ubiquitous Systems: Network and Services, San José, CA, US, Jul. 2007, pp. 1-8. International Journal of Network Security & Its Applications (IJNSA), Vol.5, No.2, March 2013 169
[10]IEEE P802.11p/D3.0, Part 11: Wireless LAN Medium Access Control (MAC) and Physical Layer (PHY) Specifications: Amendment: Wireless Access in Vehicular Environments (WAVE), Draft 3.0, Jul. 2007.
[11]D. Jiang and L. Delgrossi. Ieee 802.11: Towards an International Standard for Wireless Access in Vehicular Environments. 2007.
[12]A. Alonso, K. Sjöberg, E. Uhlemann, E. G. Ström, and C. F. Mecklenbräuker. Challenging Vehicular Scenarios for Self-Organizing Time Division Multiple Access. European Cooperation in the Field of Scienti_c andTechnical Research, 2011.
[13]P. Mackenzie, B. Miller, D. D. Coleman, and D. A. Westcott. CWAP Certified Wireless Analysis Professional Official Study Guide. 2011.
[14]V. Shivaldova. Implementation of IEEE 802.11p Physical Layer Model in SIMULINK. Master's thesis, Fakultät für Elektrotechnik und Informationstechnik, Technische Universität Wien, 2010.
[15]IEEE 802.11 Working Group. IEEE 802.11e Standard for Information technology - Telecommunications and information exchange between systems - Local and metropolitan area networks - Specific requirements Part 11: Wireless LAN Medium Access Control (MAC) and Physical Layer (PHY) specifications Amendment 8: Medium Access Control (MAC) Quality of Service Enhancements, 2005.
[16]H. Lans, Position Indicating System. Patent: US patent 5,506,587 (1996)
[17]R. Kjellberg, Capacity and Throughput Using a Self Organized Time Division Multiple Access VHF Data Link in Surveillance Applications,
[18]K. Sjöberg Bilstrup, E.Uhlemann, and E. G. Ström. Scalability issues for the MAC methods STDMA and CSMA/CA of IEEE 802.11p when used in VANETs. IEEE International Conference on Communications (ICC2010), 2010.
[19]Paper on the computer vision algorithm http://www.ijcsi.org/papers/IJCSI-10-1-1-354-359.pdf
[20]Paper on the wireless sensor networks http://arxiv.org/pdf/1312.2249.pdf
[21]Paper on the RF communications http://www.digi.com/pdf/wp_zigbee.pdf