Lancaster University Management School
Working Paper
2007/013
Performance pay, sorting and the dimensions
of job satisfaction
Colin Green and John S Heywood
The Department of Economics Lancaster University Management School
Lancaster LA1 4YX UK
© Colin Green and John S Heywood
All rights reserved. Short sections of text, not to exceed two paragraphs, may be quoted without explicit permission,
provided that full acknowledgement is given.
Performance Pay, Sorting and the Dimensions of Job Satisfaction
Colin Green
Centre for e-Science and Department of Economics, Lancaster University
John S. Heywood
Department of Economics, University of Wisconsin-Milwaukee and Department of Commerce, University of Birmingham
Abstract
This paper investigates the influence of performance related pay on several dimensions of job satisfaction. In cross-sectional estimates, performance related pay is associated with increased overall satisfaction, satisfaction with pay, satisfaction with job security and satisfaction with hours. It appears to be negatively associated with satisfaction with the work itself. Yet, after accounting for worker fixed-effects, the positive associations remain and the negative association vanishes. These results appear robust to a variety of alternative specifications and support the notion that performance pay allows increased opportunities for worker optimization and do not generally demotivate workers or crowd out intrinsic motivation.
Corresponding Author: Colin Green, Centre for e-Science and Department of Economics, Lancaster University, Lancaster, LA1 4YT, UK.
e-mail: [email protected]
INTRODUCTION
The use of performance pay schemes by employers has been shown to increase worker
productivity, effort and increase worker earnings (Lazear, 2000, Paarsch & Shearer 2000, Parent
1999). However, it remains unclear a priori what effect performance pay schemes have on
worker satisfaction with the job. While increased earnings will increase worker satisfaction, other
aspects of performance pay schemes may have less beneficial effects on job satisfaction. Pay
schemes based on performance may introduce large variations in periodic earnings reducing the
utility of risk averse workers. The performance monitoring associated with pay schemes may
result in increased effort that workers dislike. While some types of performance pay (such as
profit sharing) may increase job security, others will increase earnings dispersion within the firm
and may reduce perceptions of fairness or lower morale and motivation. In this way, performance
pay schemes may increase worker satisfaction with pay, while reducing their satisfaction with
other dimensions of the job such as effort, risk or perceived fairness.
This paper presents evidence on the impact of performance pay schemes on job
satisfaction in the United Kingdom. Specifically, we use the British Household Panel Survey
(BHPS) to investigate the impact of profit sharing, bonuses and performance pay on several
dimensions of job satisfaction, including overall satisfaction, satisfaction with pay, with hours,
with job security and with the work itself. The paper provides the first evidence of the influence
of performance pay schemes on many of these different aspects of job satisfaction. In traditional
cross-section estimates, we demonstrate that performance related pay schemes are positively
related to satisfaction with pay, to satisfaction with job security and to a lesser extent with
BHPS and demonstrate that controlling for individual fixed effects confirms the positive
influences of performance pay. Including the fixed effects, profit sharing and/or performance pay
remain associated with higher satisfaction overall, with pay, with job security and with hours.
The negative influence on satisfaction with the work itself vanishes in the fixed effect estimates.
A series of robustness checks confirm these general patterns but show that results vary by gender
and by union status.
The paper is structured as follows. The next section provides an overview of evidence on
the effect of payment schemes on worker outcomes with specific attention to job satisfaction.
Section II describes the data source and empirical methodology. Section IV presents the central
econometric results contrasting the cross section and fixed-effect estimates. Section V describes
robustness checks and presents results within several subsamples. The final section concludes.
I. PAST THEORY AND EVIDENCE
Payment schemes are seen as more closely aligning the interests of workers and firms.
The critical characteristic of linking effort and pay allows a more complete optimisation by
workers than is possible with time rates (Heywood and Wei 2006). In the extreme, workers paid
piece rates or commissions equate the marginal cost of effort with the marginal value added (See
Lazear, 1995). The infra-marginal effort brought forth by the piece rate generates worker
earnings above the cost of effort. While this generates the maximum surplus for workers, workers
paid time rates stop short of the optimal effort, failing to produce units that generate value added
greater than effort. Thus, many studies confirm that those on piece rates increase effort and earn
more than otherwise equivalent workers on time rates (Ewing, 1996; Lazear 2000; Oettinger,
Yet, all else may not be equal. Some factors may further increase the satisfaction
associated with performance pay. Brown and Sessions (2003) suggest that workers prefer
employment environments seen as rewarding their productivity and that such environments
increase worker optimism about future employment. In addition, some types of performance pay
may be part of a bundle of HRM innovations associated with high performance workplaces. Such
workplaces may create greater feelings of belonging, esteem and commitment. Goddard (2001)
and Baurer (2004) present evidence on the association between job satisfaction and high
performance workplaces.
There exist a number of reasons, however, why performance related pay may reduce job
satisfaction. First, performance pay may not be successful. Evaluations may be overly subjective
or objective measures of performance may be poorly tied to actual firm profit. In theses cases,
overall surplus may not be increased as workers try to maximize an objective such as the favour
of their supervisor or the number of pieces produced (Baker 1992). In this second case, workers
may increase productivity in response to piece rates but not increase profitability as, for instance,
quality falls, maintenance deteriorates, or injuries increase (Freeman and Kleiner 2005).
Similarly, schemes that rely on a supervisor's evaluation are known to suffer from a variety of
biases that may cause them to fail to increase surplus (Prendergast 1999). Some schemes have
also been shown to undermine valuable teamwork and cooperation (Drago and Garvey 1998).
Schemes with such malfunctioning characteristics might well be anticipated to lower worker
satisfaction.
Second, Gibbons (1987) formalized the traditional union fear that 'ratcheting' would lower
rewards and incentives after workers respond with additional effort. Certainly Green (2004) has
studies of call centres by Drago (1996) and Fernie and Metcalf (1999) present bleak pictures of
low wages and high stress made worse by computerized monitoring and piece rates. Thus,
performance pay may be merely a disciplinary tool that doesn't allow greater optimisation but
merely increases work effort and lowers satisfaction especially for the low skilled (For more on
the consequences for the low skilled see McCausland et al. 2005). Even group schemes and
profit sharing designed to change workplace norms may increase not only effort and earnings but
also peer-pressure. Kandel and Lazear (1992) emphasize that this peer-pressure can be so severe
as to actually lower worker utility (job satisfaction) even as earnings rise.
Third, workers may suffer reduced satisfaction from the increased earnings risk associated
with performance pay schemes that may not be fully built into compensating wage demands
(Milgrom and Roberts 1992). Moreover, typical job satisfaction estimates hold constant earnings
suggesting that the direct negative effect of the earnings risk may be reflected in lower
satisfaction. Yet, the role of sorting by risk can be critical. Sliwka and Grund (2006) have shown
that workers who have a greater tolerance for risk are significantly more likely to choose jobs
receiving performance pay. Thus, the fact that performance pay is associated with greater
earnings risk need not imply that the workers receiving performance pay are less satisfied with
their earnings risk. Moreover, a counterbalance to this increased risk occurs when the variation
in workers payments matches that of firm performance. Thus, profit sharing has been recognized
as increasing the job security of workers because worker payments fall during times of low
profitability, which reduces the chance of layoff (see Wetizman 1984 and Kruse 1993). Thus,
profit sharing may simultaneously increase earnings risk but reduce the likelihood of job loss.
Fourth, greater pay dispersion typically results from individual performance pay schemes
and reduce their effort (productivity). Indeed, his model shows that this effect can be sufficient
to overwhelm the effort increase among the most productive and actually lower average
productivity compared with using time rates. In studying the implementation of performance pay
Marsden et al. (2001) show statistical evidence of just such reductions in productivity among
those with low performance pay increments. This they say is combined with the "demotivating
effect arising from difficulties of measuring and evaluating performance fairly." Personnel
management texts routinely stress that avoiding excessively inequitable pay rates is important in
creating harmony and productivity (see the studies cited in Akerlof and Yellen, 1988). Brown
(2001) demonstrates that workers who believe their payment methods are 'fair' report higher
satisfaction with their pay. Thus, regardless of the influence on total surplus, it is possible that
some types of performance pay will be perceived as unfair reducing job satisfaction.
Finally, Frey and Jegen (2001) review the literature showing that extrinsic incentives such
as performance pay can crowd out intrinsic motivation to do a good job. Again, they claim this
crowding effect can actually dominate the traditional effect resulting in lower utility and
productivity. Even if it does not dominate the traditional effect, it may show up in reduced
satisfaction with intrinsic aspects of the job such as satisfaction with the job itself. Thus, the
influence of performance pay on job satisfaction cannot be determined by theory. To the extent
that it allows better optimisation and an increase in surplus it should increase satisfaction. Yet,
influences on risk, effort, morale and intrinsic satisfaction could reverse this suggestion.
Understanding the net influence of performance pay on job satisfaction remains important as job
satisfaction has been shown to be closely correlated with both worker effort and with the
Two papers directly estimate the impact of performance pay schemes on over all job
satisfaction. McCausland et al. (2005) use waves 8 – 11 of the BHPS to contrast the pay
satisfaction of those receiving performance pay compared to those not receiving performance
pay. They use an econometric framework that endogenizes wages and accounts for self-selection
into method of pay. They show that for more highly paid workers satisfaction with the job and
with pay both are higher under performance pay. On the other hand, for lower paid workers
satisfaction is lower under performance pay. They suggest that the difference between the two
groups of workers may result if lower paid workers are more likely to see performance pay as a
form of monitoring or control. While this certainly follows, it may also be the result of the
demotivation of lower ability workers modelled by Kennedy (1995) and observed by Marsden et
al (2001).
Two additional points deserve notice. First, that the definition of performance pay
adopted by McCausland et al. (2005) does not include profit sharing. Indeed, because profit
sharing is asked as a separate question on payment method in the BHPS, estimating the
determinants of performance related pay versus all other methods would include profit sharing
among the base group of other methods. If some of the influences of profit sharing and other
performance related pay are similar, they could be obscured as a consequence. Second, while the
BHPS examined fewer dimensions of job satisfaction by wave 8, it continues to examine several
beyond overall job satisfaction and satisfaction with pay.2 While not the focus of the study by
McCausland et al, using these dimensions might help examine some of the conflicting theories
described above. For instance, satisfaction with job security might be useful in unravelling the
Heywood and Wei (2006) use the National Longitudinal Study of Youth to examine the
influence of both profit sharing and individual performance pay in the United States. They show
that both profit sharing and individual performance pay are associated with greater job
satisfaction and greater satisfaction with pay. Profit sharing is also associated with greater
satisfaction with the worker's supervisor. Interestingly, within the measure of individual
performance pay there is a suggestion that piece rates may reduce overall satisfaction even as it
increases satisfaction with pay. Neither the broad measure of individual performance pay nor
profit sharing were correlated with satisfaction with co-workers although studies of German
workers (Heywood et al 2005a, 2005b) show that profit sharing tends to positively influence
satisfaction with both supervisors and with co-workers. While these studies control for earnings,
they do not try to correct for selection.
In what follows, we return to the BHPS to examine the determinants of job satisfaction.
We examine those determinants for all of the dimensions of job satisfaction available in the data
and simultaneously examine the influence of both performance pay and profit sharing.
II. DATA AND METHODOLOGY
The data used in this paper is drawn from the British Household Panel Survey (BHPS).
The BHPS is a nationally representative sample that each year interviews approximately 10,000
individuals from roughly 5,500 households (McCausland et al 2005). We use the waves of the
BHPS corresponding to 1998-2004, as earlier waves do not contain information on pay schemes.
We restrict our sample to those individuals aged 20 to 65 and who are employees. This yields an
The information on payment schemes in the BHPS is available for 1998 onwards and the
questions asked are, "have you received any bonuses such as a Christmas or quarterly bonus,
profit-related pay or profit sharing bonus, or an occasional commission?", this excludes overtime
payments; and "Does your pay include performance related pay" (Taylor et al, 2006). From these
two questions, we create three mutually exclusive variables, the individual received profit
shares/bonuses only, the individual received performance related pay only or the individual
received both profit shares/bonuses and performance pay. Our data does not identify the
proportion of earnings attributable to different pay schemes, a limitation shared with most
individual and establishment data sets (see Heywood et al, 1998).
INSERT TABLE 1
All job satisfaction questions in the BHPS are reported on a 7 value Likert scale, 1 being the least satisfied, 7 the most satisfied. At different times a variety of job satisfaction questions
have been included in the BHPS but for the period in which pay scheme information is available,
five job satisfaction questions are available. These include overall job satisfaction, satisfaction
with pay, satisfaction with hours worked, satisfaction with job security, and satisfaction with the
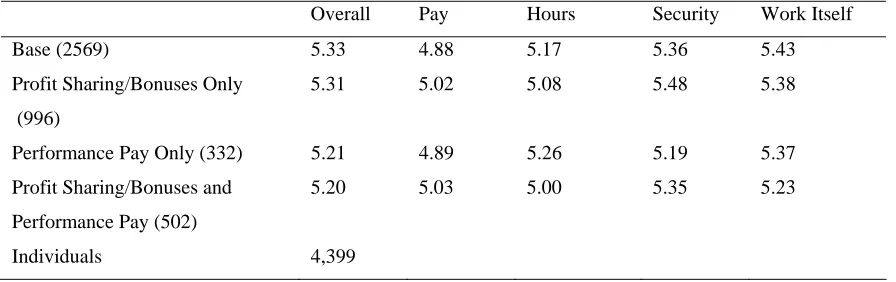
work itself. Table 1 provides mean job satisfaction levels for these five categories, disaggregated
by the type of pay scheme. For brevity and to avoid double counting individuals, we report these
for the 1998 sample only.3
Overall job satisfaction is highest for those who do not receive any form of performance pay or profit sharing/bonuses and next highest for those who receive profit sharing or bonuses
only. Satisfaction with pay is the highest and nearly identical for those both receiving profit
sharing/bonuses only and those receiving these in conjunction with performance pay.
general, the pattern of unconditional means reported in Table 1 does not appear to support a
strong link between job satisfaction and performance pay schemes.
INSERT TABLE 2
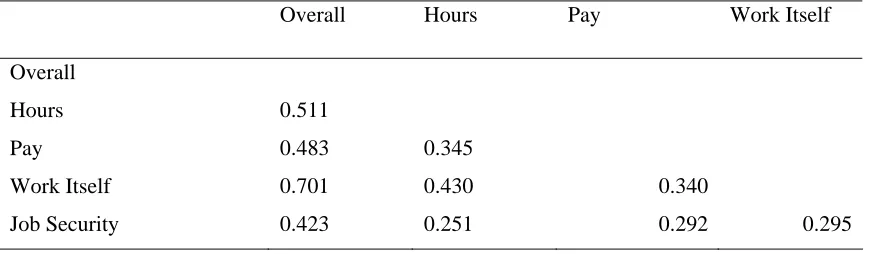
Table 2 presents the correlations between the five measures of job satisfaction. While the
correlations between overall job satisfaction and the other dimensions are reasonably large, the
correlations among those other dimensions are sufficiently small to indicate that they measure
different aspects of satisfaction. Thus it makes sense from a statistical, as well as a theoretical,
point of view to separately estimate the determinants of the individual dimensions.4
A number of variables are available in the BHPS that allow us to control for other sources
of variation in work conditions, many of which we would expect to influence job satisfaction.
Thus, we observe the workers pay rate (log pay), the number of hours worked and whether they
worked overtime. When estimating the impact of performance pay schemes on job satisfaction it
is important to control for these factors as, from the discussion in the previous section, we would
expect these to vary with pay scheme. Other included variables related to job characteristics are
whether the individual had a work pension, whether the employer provided health insurance,
whether the employer provided training, whether the individual was promoted in the last year, are
they on a temporary contract, do they have a management or supervisory role, and size of the
firm.
INSERT TABLE 3
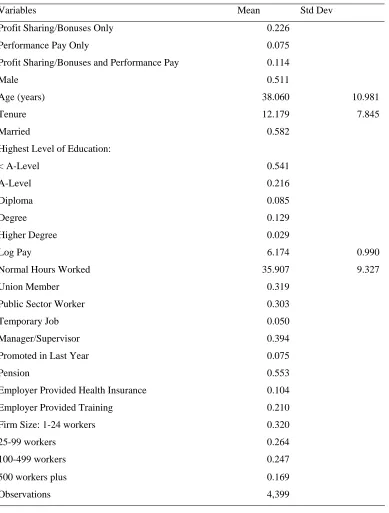
Table 3 presents sample means and standard deviations of the independent variables. The
variables included are largely standard in the literature on job satisfaction. Again for brevity,
sample means for the first wave used (1998) are presented, full pooled (i.e. multiple
the controls for work conditions listed above along with gender, whether the respondent is in a
union and whether the respondent has a disability. Also included, but not reported in the sample
means, are 10 controls for industry, 9 controls for occupation and 11 controls for region.
Following past research, the values of job satisfaction are fitted to the cumulative normal
distribution through ordered probit estimates (see Clark and Oswald, 1996 and Clark et al 1997
among others). The ordered probit estimation follows appropriately when the dependent variable
has a natural ordering, such as least to most satisfied (see McKelvey and Zavonia 1975).
III. CENTRAL RESULTS
INSERT TABLE 4
Table 4 presents estimates of job satisfaction using data pooled for 1998-2004, with
standard errors clustered at the individual level. Column 2 provides estimates for overall job
satisfaction. Estimates for controls are largely as demonstrated in previous research. Job
satisfaction declines with education level and firm size. Union members are less satisfied, while
public sector workers are more satisfied with their job. Females appear to have markedly higher
job satisfaction than males confirming past findings of the "paradox of the contented female
worker."
In terms of performance pay measures, only those receiving profit sharing or bonuses
only have a significantly higher level of overall job satisfaction. Columns 3 to 6, display
covariate estimates for the various dimensions of job satisfaction reported in the BHPS for 1998
to 2004. As might be expected performance pay measures are associated with increases in
worker’s satisfaction with their pay. As we control for the level of pay, this result goes beyond
an improved ability to more nearly optimize the trade-off of effort and earnings. There is also an
indication that profit sharing or bonuses are associated with higher levels of satisfaction with
work hours. Again, work hours are accounted for and as anticipated workers have lower
satisfaction with their hours of work when those hours are greater. The point is that holding the
hours of work constant those who receive profit shares or bonuses report greater satisfaction with
their hours. Taken together, these two results do suggest that profit sharing or bonus schemes
allow workers to choose effort and pay combinations more in line with their preferences and so
generate greater job satisfaction.
We suggested conflicting theoretical influences upon satisfaction with job security. Profit
sharing has been recognized to create greater job security by reducing marginal costs of
employment when profits are low. This seems born out by the highly significant and large
influence of profit sharing on greater job satisfaction with security. The influence of performance
pay is less clear. An emphasis on output-based measures might imply a greater chance of being
fired based on under-performance. On the other hand, the ability to avoid being fired may more
nearly be in the hands of workers who can influence their output. Importantly, we also know that
workers with less aversion to risk sort into jobs with performance related pay. Column 6 shows
that performance related pay is associated with greater satisfaction with job security, albeit only
statistically significant at the 10 percent level.
Finally, there appears to be a weakly significant negative effect of performance pay on
satisfaction with the job itself. As this estimate also holds constant pay, it may reflect the
tendency of performance pay schemes to crowd out intrinsic satisfaction. Alternatively, it may
reflect the tendency for jobs that are easily monitored and paid by performance to be simple and
pattern that performance pay and profit sharing tend to have positive influences across a variety
of dimensions of job satisfaction.
INSERT TABLE 5
Not only do the performance pay variables generate a series of statistically significant
coefficients but the magnitudes of the effects are also important. In Table 5 the marginal effects
on the probability of reporting the highest level of satisfaction are reported for each of
dimensions of job satisfaction.5 Thus, the first entry indicates that receiving only profit
sharing/bonuses increases the likelihood of being in the most satisfied category by one percentage
point. This is not a small effect as the mean level is around 11 percent. Thus, a one percentage
point increase represents an increase of 1/11th relative to the mean or a finding that those
receiving profit sharing/bonuses are 9 percent more likely to report being in the most satisfied
category. The magnitudes for the other payment schemes and dimensions vary but are largest for
pay and for job security.
The estimates presented so far have assumed that individuals are randomly assigned into
different pay schemes. There is evidence, however, that this is not the case (McCausland et al
2005). Lazear (2000) suggests that 56 percent of the increase in productivity associated with one
form of performance related pay, piece rates, is associated with the sorting of inherently more
productive workers into firms operating these type of pay schemes. In the context of this paper,
this is important insofar as any estimated effect of performance related pay on job satisfaction
may merely reflect the sorting of workers with preferences for performance related pay to these
type of jobs. In particular, if more productive workers are more satisfied under any pay setting
but are attracted to performance pay settings as Lazear suggests than the apparent influence of
The suggestion that fixed effects can be critical in estimating job satisfaction has been
confirmed by Heywood et al (2002) who showed that the dissatisfaction of union workers with
their pay in a cross-section is eliminated in fixed-effect estimates that concentrate on workers
changing union status. Such fixed effects may also influence the cross-sectional estimates for the
facets reported in Table 3. Thus, fixed effects will largely hold constant risk aversion allowing
the actual role of performance pay on satisfaction with security to emerge. Similarly, the
unmeasured skills of workers limited to routine and easily monitored jobs can be held constant to
focus on the actual role of performance pay on satisfaction with the job itself. In essence, the
panel estimates remove the role of sorting by unmeasured worker fixed effects.
To control for unobserved worker specific effects on job satisfaction we estimate
fixed-effects ordered probits using the within worker variation across the 7 waves.6 The specification
used in Table 4 is again used but obviously time invariant worker characteristics (such as gender)
will necessarily be omitted from the estimation.
INSERT TABLE 6
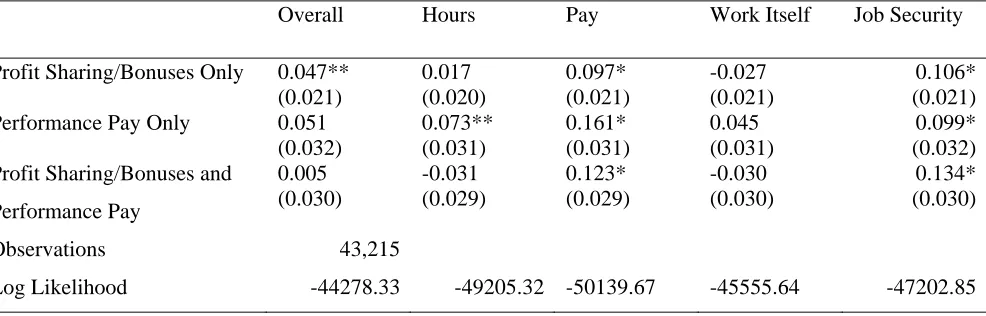
Table 6 provides the fixed effects estimates of job satisfaction. They generally support the
earlier estimates and for brevity only the coefficients for the pay scheme type are reported.
Column 2 confirms the earlier reported significant positive effect of profit sharing/bonuses on
overall job satisfaction. Moreover, all three of the indicators of payment schemes remain positive
and significant indicators of satisfaction with pay and satisfaction with job security as they did in
the cross-section. Thus, risk sorting does not appear to be driving the job security results in the
cross-section. In the cross-sectional estimates both performance pay and profit sharing/bonuses
positively influenced satisfaction with hours. Controlling for individual fixed effects, they remain
significance. The previously negative influence of performance pay on satisfaction with the work
itself is not apparent in the fixed effects estimate. Such a pattern is consistent with the conjecture
that workers who are subject to certain types of performance pay (such as piece rates) may be
limited to jobs that tend to be more repetitive and simple and that once these fixed effects are
held constant, the nature of the payment schemes does not play an independent role.
In total, these results suggest two specific points. First, performance related pay schemes
are significant determinants of several different aspects of job satisfaction. Second, estimates of
the influence of pay schemes on job satisfaction which fail to control for individual specific
effects may misrepresent the influence on a number of these aspects.
More generally, the results provide no evidence that performance pay schemes demotivate
workers, lower morale or crowd out intrinsic motivation. While these things may happen in
specific cases, they are certainly not sufficiently general to lower any of the dimensions of job
satisfaction. Instead, the bulk of the evidence would be consistent with performance pay
improving opportunities to optimise effort and reward trade-offs, improving senses of fairness in
rewards or the efficacy of effort and improving job security. In this sense, the results provide
important corroboration of those of Heywood and Wei (2006) and of McCausland et al. (2005)
who found important positive effects of performance pay on satisfaction but found them for more
general measures of satisfaction (fewer dimensions) and for more limited samples (only the more
highly paid).
IV. ROBUSTNESS CHECKS AND SUBSAMPLE RESULTS
Before moving on to specific checks and subsamples, we emphasize a general result. All
satisfaction are robust to the exclusion of controls for hours worked (and overtime) and pay.
While hours itself often matters for satisfaction, it does not interact with performance related pay
in a fashion that alters the results reported in the previous section. This invariance goes, in part,
to the issue of whether longer hours are associated with payment schemes and so might lower
satisfaction. We found no evidence of such a suggestion. Performance related pay is known to
increase earnings and one might argue that this influence should not be held constant in
examining the influence of performance related pay on satisfaction. Indeed, the size and
significance of the coefficients remain at least as large excluding earnings as a determinant of
satisfaction.
McCausland et al (2005) claim that for lower paid workers performance pay schemes
merely act as a discipline and monitoring device, and as a result performance pay reduces job
satisfaction for this group. We examine this contention by splitting the sample according to wage.
Specifically, we stratify the sample by whether the worker was above or below the median wage
in the sample for each year. We then estimate fixed effects models of all dimensions of job
satisfaction for the lower income panel. These estimates (available upon request) indicate that
pay schemes have no significant impact on overall job satisfaction for these workers. Despite the
reduced sample size, all three categories of pay schemes remain associated with increased job
satisfaction with pay (even holding pay constant in the estimates). Moreover, profit sharing
remains associated with significantly increased satisfaction with job security. Interestingly, profit
sharing is associated with significantly reduced satisfaction with the job itself. This is surprising
as one might anticipate this to come from the higher-powered performance pay schemes and may
results are not suggestive of overall negative effects on morale or motivation of performance
related pay schemes for low paid workers.
A further factor to consider when examining the role of performance related pay schemes
on satisfaction with hours worked is that this may vary markedly by worker’s skill level. For
instance, Drago (1996) and Fernie and Metcalf (1999) illustrate the negative effect of piece rates
on worker morale in call centres. We examine such claims by estimating the model for
satisfaction with hours worked separately for low skill workers. There are two main ways one
might think of identifying low skill workers in our data. First, we could focus on workers with
low education levels. Estimates based on samples of workers without a-levels (n=22,047), or
workers without post-school qualifications (n=31,451) reveal no systematic effect of performance
pay schemes on satisfaction with hours worked. Second, we look at workers in low-skill
occupations by identifying workers in the three lowest skilled occupational groups (sales and
customer service occupations; process, plant and machine operatives; and elementary
occupations). Again estimates based on this sample (n=8864) show no statistically significant
relationship between satisfaction with hours and performance related pay schemes.
INSERT TABLE 7
In light of the large variations in job satisfaction by both gender and union status
displayed in Table 4, it is worth considering whether there are variations in the impact of
performance related pay on job satisfaction across both these groups. Table 7 provides estimates
of the impact of performance related pay on job satisfaction split by gender and union
membership, respectively. In both cases all controls are as Table 4 and in addition controls for
The results stratified by gender reveal a few differences. First, profit sharing increases job
satisfaction for men, but not women. Performance pay has a positive effect on job satisfaction
with hours, pay and job security for men, but only the pay effect is apparent for women. Profit
sharing increases satisfaction with pay and job security for men, but only job security for women.
Together these results suggest that performance related pay schemes are more beneficial for men.
To the extent that such schemes create increased competition and rivalry within the workplace,
this might be anticipated based on several experiments showing that competition improves the
performance of males but not of females (Gneezy and Rustichini 2004).
The results in the second panel demonstrate that there are marked differences between
union and non-union workers in terms of the effect of performance related pay schemes on job
satisfaction. For instance, profit sharing increases the latent measure of overall job satisfaction by
almost 0.13 for union workers, while receiving both profit shares and performance pay increases
the latent measure of job satisfaction by 0.12. For non-union workers no such effects are
noticeable, while only performance pay increases their overall job satisfaction. Performance
related pay schemes increase satisfaction with pay for both groups, but the magnitude of the
effect is much larger for union workers who receive only performance pay or in conjunction with
profit sharing. Performance pay increases satisfaction with hours for unionized workers, while
profit shares increase satisfaction with security for non-union workers.
The remarkably strong role for performance pay among unionized workers may at first
blush seem surprising. Unions are presumed to oppose individual performance pay because it
hurts the solidarity wage and increases earnings dispersion among workers doing the same job
(Issac 2001). At the same time, unions are presumed to oppose explicit profit sharing as it
1995). Yet, the international evidence on the association between unions and performance pay is
best described as inconclusive. Moreover, US and Canadian evidence suggests that when unions
are involved in the creation and implementation of performance pay schemes, the schemes are
associated with better firm performance and greater longevity (Kim and Voos 1997; Kim 1999).
German evidence makes clear that active involvement by organized labor (in the form of works
councils) actually increases the chance of a firm adopting performance pay (Heywood et al.
1998). Thus, the finding that performance pay is associated with increased job satisfaction for
union members may not be paradoxical if the schemes in the union sector are more likely to be
both accepted by workers and successful because of their role in its creation.
V. CONCLUSION
This paper aimed to estimate the impact of performance pay schemes on a number of
dimensions of job satisfaction. We have provided evidence that profit sharing/bonuses tend to
increase overall job satisfaction. Overall, performance related pay increases satisfaction with both
pay and job security. The latter finding is not necessarily intuitive. Performance related pay may
decrease job security insofar as it is indicative of a culture of monitoring of work effort.
Conversely, linking pay to productivity may increase job security as wages fluctuate positively
with the output of the firm (Weitzman 1984, Kruse 1993), reducing the need for firms to lay-off
workers in periods of weak product demand. It may also attract workers who are willing to
tolerate risk and so are no less likely to be satisfied with their degree of security. Our findings
suggest that the latter two suggestions dominate.
A concern with performance related pay is that it can lead to work intensification (Green
evidence of performance related pay adversely affecting satisfaction with hours worked, even for
low skilled workers whom it has been suggested are adversely affected by performance pay
schemes. Indeed, in the fixed effect estimates we found evidence of greater satisfaction with
hours among those receiving performance pay.
A related concern is that the explicit incentives of performance related pay may crowd out
intrinsic motivations. In the cross section estimates there was, indeed, a suggestion that
performance related pay was associated with reduced satisfaction with the job itself. Yet, the
fixed effects estimates revealed this was the result of sorting as the association did not persist.
Thus, we remain unable to confirm any negative influences of performance pay on job
satisfaction and unable to dislodge a series of positive influences.
Several caveats also remain. First, these general tendencies do not mean that the job
satisfaction of all workers will increase should their firm adopt performance pay. By its nature
performance pay is suited for some types of production technologies and not suited for others.
Thus, we emphasized in our early discussion that performance pay can, in some circumstances,
be counter-productive and decrease surplus (Freeman and Kleiner 2005). It makes sense that
workers in such cases may not have increased satisfaction. Second, other dimensions of job
satisfaction may still present negative correlations. Satisfaction with management, coworkers or
stress may all be lowered by performance pay. We simply don't have access to those dimensions
in our data. Finally, we recognize that our measures of performance pay may aggregate
individual practices that have off setting influences. Thus, piece rates may lower satisfaction
even as earnings based on a broader formal appraisal increase satisfaction. We cannot identify
whether or not such differences exist. Despite these caveats, the many suggestions that worker
ACKNOWLEDGEMENTS
The authors thank the Lancaster University Management School for the support of its Visiting
TABLE 1 Summary Statistics, Pay Scheme and Job Satisfaction, Employees Age 20-65,
1998
Overall Pay Hours Security Work Itself
Base (2569) 5.33 4.88 5.17 5.36 5.43
Profit Sharing/Bonuses Only (996)
5.31 5.02 5.08 5.48 5.38
Performance Pay Only (332) 5.21 4.89 5.26 5.19 5.37 Profit Sharing/Bonuses and
Performance Pay (502)
5.20 5.03 5.00 5.35 5.23
Individuals 4,399
TABLE 2 Correlations Between Different Dimensions of Job Satisfaction, 1998-2004.
Overall Hours Pay Work Itself
Overall
Hours 0.511
Pay 0.483 0.345
Work Itself 0.701 0.430 0.340
Job Security 0.423 0.251 0.292 0.295
TABLE 3 Summary Statistics, Employees Aged 20-65, 1998.
Variables Mean Std Dev
Profit Sharing/Bonuses Only 0.226
Performance Pay Only 0.075
Profit Sharing/Bonuses and Performance Pay 0.114
Male 0.511
Age (years) 38.060 10.981
Tenure 12.179 7.845
Married 0.582 Highest Level of Education:
< A-Level 0.541
A-Level 0.216 Diploma 0.085 Degree 0.129
Higher Degree 0.029
Log Pay 6.174 0.990
Normal Hours Worked 35.907 9.327
Union Member 0.319
Public Sector Worker 0.303
Temporary Job 0.050
Manager/Supervisor 0.394
Promoted in Last Year 0.075
Pension 0.553 Employer Provided Health Insurance 0.104
Employer Provided Training 0.210
Firm Size: 1-24 workers 0.320
25-99 workers 0.264
100-499 workers 0.247
500 workers plus 0.169
Observations 4,399
TABLE 4 Dimensions of Job Satisfaction, Covariate Estimates 1998-2004.
Overall Hours Pay Work Itself Job Security
Profit Sharing/Bonuses Only 0.053* (0.017) 0.030*** (0.016) 0.095* (0.017) -0.011 (0.016) 0.115* (0.017) Performance Pay Only -0.0003
(0.023) 0.021 (0.024) 0.071* (0.025) -0.043*** (0.024) 0.042*** (0.025) Profit Sharing/Bonuses and
Performance Pay -0.0002 (0.023) -0.017 (0.023) 0.098* (0.022) -0.024 (0.024) 0.042*** (0.024)
Male -0.133*
(0.020) 0.050** (0.020) -0.094* (0.020) -0.092* (0.020) -0.123* (0.020)
Age -0.020*
(0.006) -0.028* (0.005) 0.007 (0.006) -0.013** (0.006) -0.050* (0.006)
Age Sqr 0.0003*
(0.00007) 0.0003* (0.00007) -0.00004 (0.00007) 0.0002* (0.00007) 0.001* (0.00007)
Tenure -0.001
(0.0007) -0.001 (0.001) 0.002* (0.001) -0.001*** (0.0007) 0.0001 (0.001)
Married 0.097*
(0.017) 0.003 (0.017) 0.099* (0.018) 0.088* (0.018) 0.060* (0.017)
A-Level -0.093*
(0.025) -0.055** (0.025) -0.006 (0.025) -0.082* (0.025) -0.058** (0.025)
Diploma -0.100*
(0.039) -0.113* (0.037) 0.035 (0.038) -0.098* (0.036) -0.053 (0.036)
Degree -0.123*
(0.039) -0.147* (0.040) 0.095** (0.040) -0.161* (0.038) 0.033 (0.040) Higher Degree -0.125*
(0.054) -0.168* (0.054) 0.129** (0.058) -0.161* (0.055) 0.042 (0.057)
Log Pay 0.041*
(0.010) 0.046* (0.010) 0.154* (0.011) 0.033* (0.011) 0.011 (0.010) Normal Hours Worked -0.005**
(0.002) -0.026* (0.002) -0.003 (0.002) -0.002 (0.002) 0.003 (0.002) Overtime Hours 0.0003
(0.001) -0.033* (0.001) 0.0001 (0.001) 0.007* (0.001) 0.006* (0.001) Union Member -0.123*
(0.021) -0.073* (0.021) -0.044** (0.021) -0.146* (0.021) -0.071* (0.021) Public Sector Worker 0.126*
(0.022) 0.085* (0.022) 0.045*** (0.025) 0.087* (0.022) 0.266* (0.022) Temporary Job -0.231*
(0.038) -0.054 (0.034) -0.004 (0.040) -0.042 (0.038) -1.288* (0.041) Manager/Supervisor 0.055*
(0.022) -0.046** (0.022) 0.108* (0.022) 0.051** (0.021) 0.148* (0.022) Promoted in Last Year 0.167*
(0.021) 0.105* (0.021) 0.102* (0.021) 0.148* (0.021) 0.131* (0.022)
Pension -0.001
Insurance
Employer Provided Training 0.070* (0.015) 0.046* (0.014) -0.015 (0.015) 0.083* (0.015) 0.028*** (0.015) 25-99 workers -0.073*
(0.020) -0.051* (0.020) -0.051* (0.020) -0.114* (0.020) -0.038** (0.020) 100-499 workers -0.123*
(0.023) -0.034 (0.024) -0.042*** (0.025) -0.182* (0.025) -0.048** (0.023) 500 workers plus -0.108*
(0.028) -0.038 (0.029) -0.022 (0.027) -0.196* (0.028) -0.038 (0.028) Comparison Wage -0.143**
(0.064) -0.025 (0.068) -0.307* (0.068) -0.041 (0.062) -0.189* (0.061)
Pseudo r2 0.02 0.04 0.01 0.02 0.03
Observations 43,215
TABLE 5 Marginal Effects on the Probability of Being in the Most Satisfied Category, 1998-2004.
Overall Hours Pay Work Itself Job Security
Profit Sharing/Bonuses Only
0.010* (0.003)
0.006*** (0.003)
0.015* (0.003)
-0.003 (0.004)
0.035* (0.005)
Performance Pay Only -0.00006 (0.004)
0.004 (0.005)
0.011* (0.004)
-0.010*** (0.006)
0.013*** (0.008)
Profit Sharing/Bonuses and Performance Pay
-0.00004 (0.004)
-0.004 (0.005)
0.015* (0.004)
-0.006 (0.005)
0.013*** (0.007)
Proportion of Sample in
Most Satisfied Category 0.114 0.140 0.085 0.159 0.231
TABLE 6 Performance Related Pay and Job Satisfaction, Fixed Effects Estimates 1998-2004.
Overall Hours Pay Work Itself Job Security
Profit Sharing/Bonuses Only 0.047** (0.021)
0.017 (0.020)
0.097* (0.021)
-0.027 (0.021)
0.106* (0.021) Performance Pay Only 0.051
(0.032)
0.073** (0.031)
0.161* (0.031)
0.045 (0.031)
0.099* (0.032) Profit Sharing/Bonuses and
Performance Pay
0.005 (0.030)
-0.031 (0.029)
0.123* (0.029)
-0.030 (0.030)
0.134* (0.030)
Observations 43,215
Log Likelihood -44278.33 -49205.32 -50139.67 -45555.64 -47202.85
*, **, *** indicate statistical significance at 1%, 5% and 10%, respectively.
Table 7 Performance Related Pay, Job Satisfaction by Gender and Union Status 1998-2004, Fixed Effect Estimates
Overall Hours Pay Work Itself Job Security
Male Female Male Female Male Female Male Female Male Female
Profit Sharing/Bonuses Only 0.050*** (0.028) 0.050 (0.033) 0.031 (0.027) 0.016 (0.032) 0.116* (0.027) 0.071** (0.031) -0.020 (0.028) -0.041 (0.033) 0.119* (0.027) 0.112* (0.033)
Performance Pay Only 0.061
(0.043) 0.048 (0.048) 0.139* (0.042) -0.003 (0.046)
0.190* .
(0.042) 0.129* (0.046) 0.022 (0.042) 0.068 (0.046) 0.149* (0.043) 0.056 (0.047) Profit Sharing/Bonuses
and Performance Pay
0.018 (0.039) -0.008 (0.047) -0.039 .(0.037) 0.017 (0.046) 0.124* (0.038) 0.133* (0.047) -0.048 (0.039) -0.001 (0.047) 0.166* (0.038) 0.123* (0.048)
Observations 21,286 21,928
Union Non-Union Union
Non-Union
Union
Non-Union
Union Non-Union Union Non-Union
Profit Sharing/Bonuses Only 0.128* (0.047) 0.030 (0.025) 0.022 (0.036) 0.025 (0.041) 0.118* (0.046) 0.087* (0.024) 0.050 (0.047) -0.033 (0.025) 0.021 (0.046) 0.141* (0.025)
Performance Pay Only 0.050
(0.052) 0.117* (0.044) 0.158* (0.051) 0.052 (0.041) 0.283* (0.052) 0.128* (0.042) 0.078 (0.052) 0.069 (0.043) 0.149* (0.052) 0.093** (0.040) Profit Sharing/Bonuses
and Performance Pay
0.120** (0.060) -0.012 (0.037) 0.073 (0.059) -0.053 (0.035) 0.295** (0.059) 0.049 (0.035) 0.045 (0.059) -0.022 (0.037) 0.218* (0.059) 0.145* (0.037)
Observations 14,478 25,737
APPENDICES:
Appendix A1 – Summary Statistics, Pay Scheme and Job Satisfaction, Employees Age 20-65
1998-2004
Overall Pay Hours Security Work Itself
Base (27100) 5.35 4.86 5.23 5.43 5.45
Profit Sharing/Bonuses Only (9318)
5.35 5.02 5.16 5.54 5.39
Performance Pay Only (2865) 5.30 4.98 5.15 5.53 5.34 Profit Sharing/Bonuses and
Performance Pay (3539)
5.25 5.08 5.04 5.43 5.32
Sample Size 43,215
Appendix A2 – Sample Statistics, Employees Aged 20-65, 1998-2004.
Variables Mean Std Dev
Profit Sharing/Bonuses Only 0.216
Performance Pay Only 0.066
Profit Sharing/Bonuses and Performance Pay 0.089
Male 0.493
Age (years) 38.864 11.056
Tenure 11.694 7.458
Married 0.579 Highest Level of Education:
< A-Level 0.510
A-Level 0.218 Diploma 0.089 Degree 0.146
Higher Degree 0.037
Log Pay 6.047 0.953
Normal Hours Worked 35.221 9.561
Union Member 0.335
Public Sector Worker 0.341
Temporary Job 0.042
Manager/Supervisor 0.382
Promoted in Last Year 0.065
Pension 0.565 Employer Provided Health Insurance 0.090
Employer Provided Training 0.198
Firm Size: 1-24 workers 0.327
25-99 workers 0.267
100-499 workers 0.230
500 workers plus 0.176
Observations 43,215
REFERENCES:
Akerlof, G. and Yellen, J. (1988). Fairness and Unemployment. American Economic Review, 78,44-49.
Baker, G. (1992). Incentive Contracts and Performance Measurement. Journal of Political Economy, 100, 598-614.
Baurer, T.K. (2004). High Performance Workplaces and Job Satisfaction: Evidence from Europe. IZA
Discussion Paper no. 1265.
Brown, M. (2001). Unequal pay, unequal responses? Pay referents and their implications for pay level
satisfaction. Journal of Management Studies, 38, 879 – 96.
Brown, S. and Sessions, J.G. (2003). Attitudes, expectations and sharing. Labour, 17, 543 – 69.
Clark, A. and Oswald, A. (1996) Satisfaction and comparison income. Journal of Public Economics, 61, 359 – 81.
Clark, A., Oswald, A. and Warr, P. (1997). Is job satisfaction U-shaped in age? Journal of Occupational
and Organization Psychology, 69, 57 – 81.
Clark, A. (2001). What really matters in a job? Hedonic measurement using quit data. Labour Economics,
8, 22 - 42.
Drago, R. (1996). Workplace transformation and the disposable workplace: Employee involvement in
Australia," Industrial Relations, 35, 526 – 43.
Drago, R. and Garvey, G. (1998). Incentives for helping on the job: Theory and evidence. Journal of
Labor Economics, 16, 1 – 25.
Drago, R. and Heywood J.S. (1995). Choice of Payment Schemes: Australian Establishment Data.
Industrial Relations, 34, 507 – 31.
Ewing, B.T. (1996). Wages and Performance Base Pay: Evidence from the NLSY. Economics Letters, 51, 241 - 46.
Freeman, R.B. and M.M. Kleiner. (2005). The Last American Shoe Manufactures: Decreasing
Productivity and Increasing Profits in the Shift to Continuous Flow Production. Industrial Relations,
44, 307 –330.
Frey, B.S. and Jegen, R. (2001). Motivational crowding theory. Journal of Economic Surveys, 15, 589 – 611.
Gibbons, R. (1987). Piece-rate incentive schemes. Journal of Labor Economics, 5, 413 – 29.
Gneezy, U. and Rustichini, A. (2004). Gender and Competition at a Young Age. American Economic
Review, 94, 377 – 81.
Goddard, J. (2001). High performance and the transformation of work? The implications of alternative
work practices for the experience and outcomes of work. Industrial and Labor Relations Review, 54, 776 – 805.
Green, F. (2004). Why Has Work Effort Become More Intense? Industrial Relations, 43, 709-741.
Heywood, J.S., Huebler, O. and Jirjahn, U. (1998). Variable Payment Schemes and Industrial Relations:
Evidence from Germany. Kyklos, 51, 327 – 57.
Heywood J.S., Jirjahn. U. and Tsertvadze. G. (2005a) Does profit sharing reduce conflict with the boss?
Evidence from Germany. International Economic Journal, 19, 235 – 50.
Heywood J.S., Jirjan. U. and Tsertrvadze, G. (2005b) Getting along with colleagues: Does profit sharing
help or hurt? Kyklos, 58, 557 - 74.
Heywood J.S., Siebert W.S. and Wei, X. (2002). Worker Sorting and Job Satisfaction: The Case of Union
and government Jobs, Industrial and Labor Relations Review, 55, 595 – 609.
Heywood, J.S. and Wei, X. (2006). Performance Pay and Job Satisfaction. Journal of Industrial Relations,
48, 523 – 40.
Issac, J.E. (2001). Performance Related Pay: The Importance of Fairness. Journal of Industrial Relations,
43, 111- 23.
Kennedy P.W. (1995). Performance pay, productivity and morale. Economic Record, 71, 240 – 47. Kim, D.O. (1999). Determinants of the Survival of Gainsharing Programs. Industrial and Labor Relations
Review, 53, 21-42.
Kim, D.O. and Voos, P.B. (1997). Unionization, Union Involvement, and the Performance of Gainsharing
Programs. Relations Industrielles-Industrial Relations, 52, 204 –32.
Kruse, D. L. (1993). Profit Sharing: Does it Make a Difference? Kalamazoo Michigan: W.E. Upjohn
Institute for Employment Research.
Lazear, E.P.(1995). Personnel Economics, MIT Press, Cambridge.
Lazear, E.P. (2000). Performance pay and productivity. American Economic Review,90, 1346 – 61. MacLeod, W.B. and Parent, D. (1999). Job Characteristics and the Form of Compensation, in Research in
Labor Economics, 18, pp. 177-242, ed. S Polacheck. Samford, CT: JAI Press.
Marsden, D., French, S. and Kubo, K. (2001). Does performance pay de-motivate, and does it matter?
Discussion Paper: 503, London School of Economics, Centre for Economic Performance.
McCausland, W., Pouliakas, K. and Theodossiou, I. (2005). Some are punished and some are rewarded: A
study of the impact of performance pay on job satisfaction. International Journal of Manpower, 26, 636-659.
McKelvey, R. and Zavonia, W. (1975). A statistical model for the analysis of ordinal level dependent
variables. Journal of Mathematical Sociology, 4, 103 – 20.
Milgrom, P. and Roberts, J. (1992). Economics, Organization and Management. New York: Prentice Hall.
Oettinger G.S. (2001). Do piece rates influence effort choices? Evidence from stadium vendors.
Economics Letters, 73, 117 - 23.
Paarsch, H. and Shearer, B. (2000) Piece rates, fixed wages, and incentive effects: Statistical evidence
from payroll records. International Economic Review, 41, 59 - 92.
Parent, D. (1999). Methods of pay and earnings: A longitudinal analysis. Industrial and Labor Relations
Slwika, D. and Grund, C. (2006). Performance Pay and Risk Aversion. IZA Discussion Paper No. 2012
(March).
Taylor, M.F., Brice, J., Buck, N. and Prentice-Lane, E. (2006). British Household Panel Survey User
Manual Volume B: Codebook. Colchester: University of Essex.
Weitzman, M. L. (1984). The Share Economy, Cambridge, MA: Harvard University Press.
ENDNOTES
1
This is not to say that in all circumstances piece rates automatically have this influence. Inability to measure performance or incompatible managerial policies can, for instance, make piece rates unprofitable (Freeman and Kleiner 2005).
2
Earlier waves also included questions on worker satisfaction with promotion prospects, relations with the boss and their use of initiative.
3
Means for the full pooled sample covering 1998-2003 are reported in the appendix as Table A1. 4
Indeed, one can use the Cronbach's alpha to show that the individual dimensions should not be aggregated to a single measure (Heywood et al. 2002).
5
As there are seven satisfaction categories, three payment scheme variables and 5 dimensions of job satisfaction, we have not presented a full set of marginal effects but they are available from upon request.
6