RESEARCH ON IDENTIFICATION METHOD OF WIDEBAND
JAMMING IN DSSS SYSTEM
NAIQI WEI, ZILI CHEN, ANSI ZHU,JUNWEI LV
Unmanned Aerial Vehicle Engineering Department, Mechanical Engineering College
E-mail: [email protected]
ABSTRACT
Wideband suppressing jamming is one of the main threats faced by Direct Sequence Spread Spectrum (DSSS) system. The identification of wideband jamming modes and estimation of its parameters provide beneficial reference for applying effective anti-jamming measures. Aiming at familiar wideband jamming modes faced by DSSS, five characteristic parameters are extracted. An automatic identification method of wideband jamming modes based on fractional Fourier transforms (FRFT) and layered decision-making algorithm is proposed. Through the simulation results and analysis, it can be found that the method can effectively identify non-jamming, narrow-band jamming, wideband noise jamming, wideband comb jamming and wideband sweep jamming. It has the advantages of high identification rate, simplicity, short sample time, fine stability and robustness, etc.
Keywords: Jamming Identification; Direct Sequence Spread Spectrum; Layered Decision-making
1.
INTRODUCTIONCommunication reconnaissance is one of the important research content of communications fields. In the traditional methods, the communication reconnaissance services are for electronic war, communication purpose is to provide electronic support the implementation of effective interference by getting the information of characteristics of the communication signal for electronic attack. In fact, defense of communication electronic also needs the support of communication reconnaissance. Through the analysis of the interference signal, the interference pattern identification and estimation of the interference parameters, the receiver can choose the best anti-jamming measures according to different interference signals. So through the method we can change the application of anti-interference means with definite purpose, and improve the ability of anti-jamming communications equipment effectively.
Direct Sequence Spread Spectrum system (referred to as "DS" or DSSS) has strong the anti-jamming capability and characteristic of low probability of intercept, and it has been getting the applications of a wide range in the civilian and military purpose [1-3]. The broadband interference is one of the common effective interference of the
DS system, when the strong interference is beyond the DS system the interference tolerance limit, the system performance will seriously be deteriorated. Identification and parameter estimation methods of DS system will provide a useful reference in the adopting of appropriate anti-jamming measures according to common broadband interference. The paper [2-5] adopts the hierarchical decision classification algorithm based on the spectrum and the radon transform in the automatic identification of the broadband interference, but there are also exists the disadvantages, e.g., the complexity of computation and long time of signal sampling. In the paper, according to the model of the common broadband interference of spread spectrum systems, we propose a wideband interference identification method based on fractional Fourier transform, and simulation results and related analysis are also presented.
2.
INTERFERENCE MODELThe broadband interference can be divided into the broadband noise interference; broadband lines sweep interference and broadband comb spectrum interference [6,7].
Broadband noise is a random noise signal in certain frequency bands with certain bandwidth, namely that it is equal to add a Gaussian noise with the power spectral density of Nj =J ωss at the
receiving end, where Jis the average noise power,
ss
ω is the spread spectrum bandwidth. In the actual project application, we can produce the certain bandwidth of noise, and then modulate it onto the required frequency band. Its characteristics are the signal energy can be distributed uniformly among the entire frequency band; when observed either from time domain or frequency domain, there are no energy aggregations.
2.2 Broadband comb spectrum interference The broadband comb spectrum interference is a kind of narrow-band interference on a certain range of frequencies which modulated in some way. The comb spectrum interference is similar to broadband noise interference when frequency bandwidth is greater than or equal to the frequency interval. Narrowband interfering signal generation method in each frequency point can adopt the modulation interference or key interference method.
2.3 Broadband lines sweep interference
Broadband lines sweep interference is an effective interference way against DS communication, the relationship between the instantaneous frequency and time is a linear transformation, just as shown in Fig.1.
Time
Frequency
Fig. 1 Instantaneous Frequency Of The Line Sweep Interference Signal
According to changes of the frequency in the speed, the line sweep interference can be further divided into the fast line sweep interference and slow line sweep interference, and the sweep bandwidth of interfere can cover the entire bandwidth of the spread spectrum communication system, or only cover part of it, the mathematical expression is as Eq.(1).
0
( ) 2 cos( t ( ) )
j t = J
∫
ω τ τ θd +(1)
Where J represents the average power of the interference signal; ( )ω τ represents the instantaneous frequency with linear variation. From Fig.1, it can be found that if the description of the line sweep interference within a certain period of time, the sweep frequency (i.e., the slope of the line), and the initial phase should be known.
3.
FRACTIONAL FOURIER TRANSFORMFractional Fourier transform (FRFT) is a generalized form of the Fourier transform, in recent years it has developed into a powerful tool in the analysis and processing of non-stationary signals and time-varying system. The fractional Fourier transform is defined as follows [8].
( ) [ ]( ) ( ) ( , )
p p p
X u F s u +∞s t K t u dt
−∞
= =
∫
(2)
Where
2 ( 2 cot 2 csc cot )
(1- cot ) n
( , ) ( ) n
( ) (2n+1)
p
j t ut u
j e
K t u t u
t u
π α α α
α α π
δ α π
δ α π
− +
≠
= − =
+ =
(3)
Wherea= pπ/ 2, p represents the fractional Fourier transform order; Fprepresents the fractional
Fourier transform operator. It can be found that the cycle of order p in the fractional Fourier transform is 4, and when p=4n+1, the fractional Fourier transform becomes the traditional Fourier transform.
The definition of the fractional Fourier transform from the intuitive view it can be looked as the chirp-based decomposition, but essentially the fractional Fourier transform provides a comprehensive description of the signal from the time domain to the frequency domain in the whole process, with the continuous growth of order from 0 to 1, fractional Fourier transform show the gradual variation in the signal from the time domain to the frequency domain. Thus, the fractional Fourier transform actually reflects a unified time-frequency concept between the time domain and frequency domain in the signal frequency analysis method, and it provides more choices in time-frequency analysis.
[image:2.612.108.295.451.563.2]to as discrete sampling algorithm, the algorithm is the direct discretization of the continuous fractional Fourier transform formula; another class of discrete fractional Fourier transform is an algorithm make the definition of DFRFT based on the discrete Fourier transform matrix Eigenvalue decomposition method. Expression of discrete sampling algorithm is based on the continuous fractional Fourier transform, the FRFT decomposition for signal convolution adopts the FFT method to calculate the fractional Fourier transform, so its speed is almost the same as FFT, and it is computationally faster kind of FRFT numerical calculation method, and it is very suitable for real-time signal FRFT numerical calculation, so we apply this algorithm in actually engineering implementation [9-11].
4.
CHARACTERISTIC PARAMETEREXTRACTIONS
In order to effectively distinguish non-interference, narrowband interference and broadband noise the comb spectrum interference and line sweeping interference parameters, in the paper, we extract the following five characteristics.
4.1 Normalize The 3db Bandwidth Of The Spectrum Of Bω
The first step is to calculate the normalized spectrum of the base band signal
( ) ( ) / max( ( )) ( 0,1, 1)
u
S n =S n s n n= N−
(4)
( ) ( ( ) u
S n = FFT x n represents the spectrum modulus
value of the digital baseband signal , Nrepresents
the data length ,Bω can be expressed as (5):
1
R L
m m B
N
ω
− +
=
(5)
Among them, the ( ) min ( ) u t
R S n S
m n
> =
( ) max ( ) u t
R S n S
m n
>
= ,St
is the threshold value set. Through Bω, we can
Distinguish between the narrowband interference
and broadband interference .
It can be seen that Bωcan be calculated through
FFT, it reflects the frequency domain characteristic of the received signal. Through theBω , we can
distinguish narrowband interference and broadband interference, the calculation work of Bω has
smaller amount of operations, so we can distinguish strong narrowband interference firstly; while the spectrum without interference and broadband
interference are hard to distinguish only from the frequency domain, it should use the PN code in the time-frequency domain and the priori knowledge in the judgment.
4.2 Coefficient
R
c Of The Sliding Revolving PNCode
The broadband noise interference in the interference bandwidth range is uniformly distributed, its energy is also uniformly distributed in the whole time-frequency plane, so whether it is from the frequency domain or time-frequency domain to distinguish between the broadband noise interference and the DSSS communication signal are relatively difficult. We can take advantage of the characteristics of the DSSS signal to detect whether the presence of broadband noise interference.
The received baseband signal and the known PN code for the sliding correlator, through the DSSS signal generation mode and the auto-correlation characteristics of the PN code, through the sliding correlator ,it can obtain a sequence of time intervals and there will be a correlation peak, if we adopt the absolute value of this sequence , i.e., in order to eliminate the impact of the DSSS signal message code, then in every one PN code cycle, there will be an impulse, then we make the FFT operation after obtain the absolute value, then the result will appear uniformly spaced discrete spectral lines, the spectral line number is equal to the length of the PN code, shown as Fig.2.
Fig.2 Spectrum Of Absolute Value Of Sliding Pn Code
c
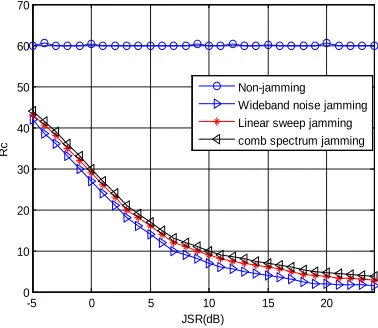
R is equal to the discrete spectrum when zero-frequency lines are got rid of , the mean and the spectrum remaining part of the ratio of the mean,
c
R reflects the energy ratio between the digital baseband signal, the DSSS signal energy ,the background noise and interference. In the case of
reduced with the increase of the dry signal ratio as shown in Fig.3. From the Fig.3, the Rc can be
adopted to determine whether the presence of interference. It should be noted that the value Rcis
related to the selection of the PN code, and when we adopt the different PN code, the corresponding values will also be different in size. Obviously,
c
R reflects the information of received signal in time domain.
-5 0 5 10 15 20
0 10 20 30 40 50 60 70
JSR(dB)
Rc
Non-jamming Wideband noise jamming Linear sweep jamming
[image:4.612.318.514.143.299.2]comb spectrum jamming
Fig. 3 Relationship Between RcAnd JSR
4.3 Normalize The Power Spectral Similarity
CoefficientQss
Calculate the power spectrum of the received signalP nω( ), and the normalization of the mean
value is just a
s
(6).( )
( ) /
u p
P
ωn
=
P n
ωm
(6)
Where mpis the mean value ofP nω( ). Qsscan
be calculated through (7). 1
0
1 1
2
0 0 0
0 2
( ) ( )
( ) ( )
M
u n
ss
M M
u
n u n
u
P n P n Q
P n P n
ω
ω
ω ω
−
=
− −
= =
=
∑
∑
∑
(7)
Among them, Pu oω ( )n represents the normalized spectrum of the DS baseband signal power according to the PN code obtained in advance without interference noise. Through the equation (7), it can be found that Qss≤1, the larger value indicates the spectral of spectrum envelope of the received baseband signal is more similar to the DSSS signal, so it can be used to identify the presence or absence of interference. In the Fig.4, the relationship between theQssand
Jamming-to-Signal power Ratio (JSR) when the received signal simulation without interference, and with all kinds of interference are presented, respectively (each point is 500 times in the average).
-5 0 5 10 15 20 25
0 0.2 0.4 0.6 0.8 1
JSR(dB)
Qs
s
[image:4.612.102.291.221.385.2]Non-jamming Wideband noise jamming Linear sweep jamming comb spectrum jamming Narrow band jamming
Fig.4 Relationship Between The Q And JSR ss
4.4 Normalize The Standard Deviation
σ
pnsOf The Impulse Power Spectrum1
2
0 1
( ( ) ( ))
M
pu pu n
pns P n P n
M
σ
−=
−
=
∑
(8) 1
( ) ( ) ( )
2 1
L
pu u u
i L
P n P n P n i L
ω ω
=−
= − +
+
∑
(9)-5 0 5 10 15 20 25
0 0.1 0.2 0.3 0.4 0.5
JSR(dB)
6pns
Non-jamming
Wideband noise jamming Linear sweep jamming Comb spectrum jamming
Fig.5 Relationship Between Theσpns JSR And SNR
[image:4.612.320.524.317.611.2]values of σpns according to the different value of
the JSR are give out. It can be seen from Fig.5, that the obvious difference between the broadband comb-like spectrum interference and a variety of other broadband interference are obtained.
4.5 Crest factor
R
m m2 on FRFT transform domainF
irst we make the fractional Fourier transform of the digital baseband signal, the transformed matrixX u( k, )p is obtained. Wherep represents the different transform order, the value is changed from 0 to 2, and ukrepresents the discrete values of thetransform domain in different order of fractions; its length is the same as the analysis of the sequence length. And then calculate kurtosis of the each order of FRFT, and then kurtosis sequence of FRFT can be obtained.
{
}
{
}
{
}
4 2 2
( , ) ( )
( , )
k
k
E X u p K p
E X u p
=
(10)
2
m m
R can be obtained through the following
formula (11).
2 __________ max( ( ))
( )
m m
K p R
K p
=
(11)
Where ________
) (
K p represents the average value of the kurtosis sequence in transform domain, and the maximum value of K p( ) corresponds the order peak of the pmax.
-5 0 5 10 15 20 25
0 5 10 15 20 25
JSR(dB)
Rm
2
m
Non-jamming
Wideband noise jamming Linear sweep jamming Comb spectrum jamming
Fig.6 Diagram Of The Relationship Between Rm m2
JSR, And SNR
Generally speaking, when the presence of narrowband interference or comb spectrum
interference, the X u( k, )p will reach the kurtosis
maximum value at p≠1, and the value of Rm m2 is also smaller; while with the presence of line sweep interference , X u( k, )p will reach the kurtosis
maximum value at p≠1, and value of Rm m2 is
large. In the Fig.6, the relationship between the
2
m m
R and the value change of the JSR, and SNR are given out. As can be seen from Fig.6, from the
2
m m
R , we can distinguish the existence of the broadband line sweep interference and other broadband interference.
5. IDENTIFICATION ALGORITHM AND SIMULATION
The interference pattern recognition is a pattern recognition problem. The analysis of the signal pattern recognition in the field of signal processing, generally includes a signal preprocessing, feature extraction and features comprehensive, as shown in Fig. 7.
Pretreatment Feature
Extraction
Features Comprehensive
Recognition Results
Fig.7 Block Diagram Of The Signal Pattern Recognition System
T
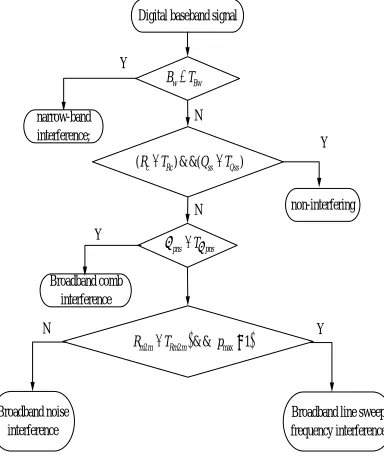
he task of the signal preprocessing turn the received signal into a suitable form, includes the frequency down-conversion, filtering, amplification, A / D conversion, etc, The main purpose of the feature extraction is using the small number of features and the classification error probability characteristics to describe the significant class differences in information mode. Obtaining the group of "fewer but better" classification feature, namely that obtaining the vector data set as small as possible in order to improve the efficiency of recognition and reduce the amount of calculation. The third step of the signal pattern recognition is the feature consolidation (classification identification), which are classified according to the rules of a classification judgment given by the eigenvectors represented an input mode to an appropriate mode categories, and then make the conversion from the feature space to the decision-making space, and ultimately make the realization of the classification and identification of the mode.from the feature space to decision-making space mapping. And the classification and identification of the final completion of the model are realized. Therefore choosing the appropriate judgment rule, structure classification and identification are the important research content. A hierarchical decision classification algorithm based on statistical decision theory is very mature now, the main features of this classifier are a simple structure, most convenient, and therefore also are widely used in pattern recognition of engineering. So if we choose the better stability of feature vectors to determine the appropriate discrimination threshold and classification structure, good recognition performance can be obtained. Based on the analysis of the characteristic parameters above, in the paper, we adopt a hierarchical decision classification algorithm [5], and the automatic identification algorithm on parameters broadband interference mode is as shown in Fig.8.
Digital baseband signal
w Bw
B <T
Broadband comb interference
Broadband line sweep frequency interference Broadband noise
interference
non-interfering Y
N
(Rc>TRc) & &(Qss>TQss)
pns Tσpns
σ >
(Rm m2 >TRm m2 ) (& & pmax≠1)
Y
Y N
narrow-band interference;
N
[image:6.612.316.524.217.740.2] [image:6.612.100.292.331.559.2]Y
Fig.8 Recognition Of The Wideband Interference Pattern According to the identification process showed in Fig.8, we make the following simulations. The direct sequence spread spectrum signal is generated through using the random sequence as a modulated signal source, modulation method is BPSK, the PN code is generated by the m-sequence and the length is 31, the information symbol rate is about 1Kbits/s, the IF frequency is 128KHz and the sampling frequency is1024KHz. Signal-to-noise ratio (SNR) is from -2dB to 15dB and is chosen arbitrarily. Jam-to-signal ratio (JSR) steps from-5dB to 25dB. Interference center frequency signal is based on the IF of the communication, and the deviation is within 6KHz. When the system generates the
various kinds of interference and its parameters are selected from the list of parameters as shown in Table 1. Simulation length is 128 information symbols. The thresholds of TBω,TQss,TRc,Tσpnsand
2
m m R
T are 0.06, 0.95, 26, 0.16 and 2.6 ,respectively,
which are obtained through 500 times independent simulations. The Fig.9 is probability of correct identification with various broadband interferences and the different values of JSR.
-5 0 5 10 15 20 0.2
0.3 0.4 0.5 0.6 0.7 0.8 0.9 1
JSR(dB)
Non-jamming
Wideband noise jamming Linear sweep jamming comb spectrum jamming Narrow band jamming
Fig.9 Recognition Rate With Different Jsr Under Broadband Interference
Table.1 Parameter In The Various Interference Simulations
types of interference Interference parameters
Wide Band
Noise
Cove
r
bandwidth
Signal bandwidth
± 17 KHZ
Broadband
line sweep
Cove
r
bandwidth
Same broadband noise interference
Swee
p frequency
(2,4,8,16,32,64) x bandwidth
Broadband
comb
Cove
r
bandwidth
Same broadband noise interference
Com
b number (4,5,6,8,10)
Mod
ulation
mode
[image:6.612.316.528.432.726.2]
Narrow-band
interference
Audi
o
interference
Mod
ulation
interference
Keying interference
Tone (CW) (AM, FM)
2FSK,BPSK,QPSK, 2ASK,4FSK,4ASK
As it can be seen from the simulation results, when the JSR is greater than 0dB, the overall recognition rate is over 90%, and with good stability and robustness. When the JSR is less than 0dB, the main decision error occurs with the presence of broadband noise. As the DSSS signal spectrum has the same characteristics as white noise, so when the low power Gaussian noise is added, the effect on the spectral characteristics will be small, so when the JSR is very low, the broadband noise can be easily judged as non-interference situation. In practical applications, due to the anti-jamming ability of the spread spectrum system itself, so it actually requires high power of the interference in order to reach the expected effect, therefore the above algorithm has practical application value. The high recognition rate of the algorithm, the characteristic parameters of the algorithm are small, the process of identification is simple, and the using of fractional Fourier transforms to detect lines sweep interference, so the signal sampling requirements are greatly reduced.
6. CONCLUSIONS
Broadband oppressive interference is one of the serious threats of the direct-sequence spread-spectrum system. The identification and parameter estimation of broadband interference style targeted anti-jamming measures will provide a useful reference for the DS system. In the paper, through extracting the parameter values of the five characteristics of a fractional Fourier transform, we propose the hierarchical decision classification algorithm based broadband interference identification method, and give out the simulation results and related analysis. The simulation results show that this method has many advantages such as the high recognition rate, simplicity, short sampling length, good stability and robustness etc,. Through the method, we can effectively identify non-interference, narrowband non-interference, broadband noise, broadband comb spectrum interference and broadband lines sweeping Interference. And the narrowband interference can be made the further
identification and classification through applying the modulation scheme of communication signal.
ACKNOWLEDGMENTS
This project is supported by the National Defense Research Fund of China (Grant No. 9140A25030XXxxx).
REFERENCE
[1] Richard Poisel. Modern Communications Jamming Principles and Techniques[M]. London: Artech House Press, 2nd edition, 2011. [2] Jooh C, Jeong Y K, Lehnert J S., Average
bit-error-rate performance of band-limited DS/SSMA communications[J]. IEEE Transactions on Communications, 2002,50(7), PP. 1150-1159.
[3] Yeon K J, Joon H C, Lehnert J S., Performance bounds on chipmatched-filter receivers for band-limited DS/SSMA communications[J].
IEEE Transactions on Communications, 2005, 53(1), PP.131-141.
[4] GU X,OLSFSSON S,On the accuracy of the gaussioan approximation for performance analysis of spread-spectrum channels[A].PIMRC 2003[C]. Beijing, China, 2003, PP.2037-2041.
[5] LI Z Q, ZHANG B J, LI G X.Analysis of anti-jamming performances of periodic PN sequences under CW interference[J].Journal of University of Electronic Science and technology of China,2004, 33(2),PP.121-124.
[6] WEI An-quan, SHEN Lian-feng, Performance analysis of DSSS system with periodic sequence against CW interference[J]. Journal on Communications, 2007, 28 (5),PP.1-6. [7] Moeness G. Amin, “Interference Mitigation in
Spread Spectrum Communication Systems Using Time-frequency Distribution,” IEEE Transactions on Signal Processing. Jan. 1997,vol. 45, No.1, pp. 90–101.
[8] Moeness G. Amin, Chenshu Wang, Alan R. Lindsey, “Optimum Interference Excision in Spread Spectrum Communicaton Using Open-Loop Adaptinve Filters,” IEEE Transactions on Signal Processing, 1999,Vol.47, No.7, pp.1965–1976.
Transactions on Signal Processing, 2001,vol. 49, No. 4, pp. 851–863.
[10] Moeness G. Amin, Govind R. Mandapati, “Non stationary Interference Excision in Spread Spectrum Communications Using Projection Filtering Methods,” IEEE Transactions on Signal Processing, 1998, pp.827–831.