September 15, 2000
SRC
Research
Report
164
Key Instructions: Solving the Code Location
Problem for Optimized Code
Caroline Tice
and
Prof. Susan L. Graham
Systems Research Center
130 Lytton Avenue
Palo Alto, California 94301
Compaq Systems Research Center
SRC’s charter is to advance the state of the art in computer systems by doing basic and applied research in support of our company’s business objectives. Our interests and projects span scalable systems (including hardware, networking, distributed systems, and programming-language technology), the Internet (including the Web, e-commerce, and information retrieval), and human/computer interaction (includ-ing user-interface technology, computer-based appliances, and mobile comput(includ-ing). SRC was established in 1984 by Digital Equipment Corporation.
We test the value of our ideas by building hardware and software prototypes and assessing their utility in realistic settings. Interesting systems are too complex to be evaluated solely in the abstract; practical use enables us to investigate their properties in depth. This experience is useful in the short term in refining our designs and invaluable in the long term in advancing our knowledge. Most of the major advances in information systems have come through this approach, including personal computing, distributed systems, and the Internet.
We also perform complementary work of a more mathematical character. Some of that lies in established fields of theoretical computer science, such as the analysis of algorithms, computer-aided geometric design, security and cryptography, and formal specification and verification. Other work explores new ground motivated by problems that arise in our systems research.
Key Instructions: Solving the Code Location
Problem for Optimized Code
Caroline Tice and Prof. Susan L. Graham
Prof. Susan L. Graham works in the Electrical Engineering and Computer Science Department at the University of California, Berkeley. She can be reached by email at [email protected].
c
Compaq Computer Corporation 2000
Abstract
There are many difficulties to be overcome in the process of designing and im-plementing a debugger for optimized code. One of the first problems facing the designer of such a debugger is determining how to accurately map between loca-tions in the source program and localoca-tions in the corresponding optimized binary. The solution to this problem is critical for many aspects of debugger design, from setting breakpoints, to implementing single-stepping, to reporting error locations. Previous approaches to debugging optimized code have presented many different techniques for solving this location mapping problem (commonly known as the code location problem). These techniques are often very complex and sometimes incomplete.
Contents
1 Introduction 2
2 Syntactic Versus Semantic Breakpoints 3
3 Atoms and Key Instructions 6
3.1 Source program locations and atoms . . . 7 3.2 Identifying key instructions . . . 9 3.3 Concerns about atoms and semantic breakpoints . . . 12
4 Other Uses of Key Instructions 13
4.1 Setting syntactic breakpoints . . . 13 4.2 Implementing debugger functions . . . 14 4.3 Solving the data location problem . . . 15 4.4 Non-Transparent debugging: Rewriting and reordering code . . . 16 4.5 Transparent debugging: Detecting currency . . . 16
5 Description of an Implementation 16
5.1 Implementation details . . . 17 5.2 Key instructions and delay slots . . . 18 5.3 Effort involved . . . 19
6 Previous Work 19
7 Conclusion 21
A Instruction Order Algorithm for selecting key instructions 22
1
Introduction
There are two well-known sets of problems in debugging optimized code: data value problems and code location problems [9, 25].
Data value problems are the difficulties involved in finding and returning the value of a variable in response to a user’s query. These problems include the res-idency problem, the data location problem, and the currency problem. The resi-dency problem arises when the variable’s current value is deemed temporarily dead by the compiler, and allowed to be overwritten without first being saved elsewhere. When the value is overwritten, it becomes lost (non-resident), and therefore it is impossible to find the value and return it to the user. The data location problem is determining where to look for the variable’s value. Assuming the value is available, it might be in any of several registers or addresses in memory, depending on the current PC. The currency problem arises because, even assuming one can find the current actual value of a variable, this value may be different from the value the user expects, based on an examination of the original source program. This difference between the actual and expected values of a variable can occur because optimiza-tions can change the order in which independent assignments are executed, or can delay or prematurely execute an assignment (with respect to the source program). How one presents the value to the user without causing undue confusion is a topic that has concerned many researchers over the years [2, 6, 8, 9, 11, 21, 22, 25].
Code location problems arise in mapping between locations in the source pro-gram and locations in the optimized target propro-gram. As compiler optimizations be-come more common and increasingly complex, the gap between a source program and its optimized target program becomes ever greater. As instructions generated from various source statements are duplicated, combined, moved, deleted and in-terleaved with instructions from other source statements, it becomes very difficult to decide where in the target program any given source statement begins or ends. Yet it is critical for debuggers of optimized code to be able to map precisely be-tween locations in the source program and the corresponding locations in the target program. Debuggers need this mapping to implement all debugger functions that require suspending execution at particular locations in the source program. These functions include setting control breakpoints, single-stepping between statements, and stepping into and returning from subroutines. The mapping information is also necessary for reporting the location of execution errors.
for more details).
In this paper we present a simple and complete solution to the code location problem, based on the concept of key instructions. In Section 2 we give a more detailed problem description, using syntactic and semantic breakpoints to illustrate the difficulties. We both define key instructions formally and present algorithms for identifying them in Section 3, where we discuss key instructions as they relate to setting breakpoints. In Section 4 we discuss the usefulness of key instructions for implementing other debugger functions, and we elaborate on the various ways key instructions can be used to solve many problems in debugging optimized code. We discuss our implementation experiences with key instructions in Section 5. In Section 6 we review previous work in this area, and in Section 7 we present our conclusions.
2
Syntactic Versus Semantic Breakpoints
The code location problem can be most clearly illustrated by considering which instruction in the optimized program should be used as the breakpoint for a given statement. There are two basic schemes for setting breakpoints in optimized code: syntactic breakpoints and semantic breakpoints [8, 9, 25]. The difference between these two schemes is which instruction in the binary is used for the breakpoint location. As the name implies, syntactic breakpoint locations are based on the syntax of the original source program, while semantic breakpoint locations are based on the instructions generated from the source statements (their semantics).
Using a syntactic breakpoint scheme, the basic idea is to ensure that the break-points for statements are reached in the same order as the statements occur in the original source program. In other words, if one single-stepped through the opti-mized binary, stopping at each syntactic breakpoint as it is reached, it would super-ficially appear that the statements were executing exactly in the order indicated by the source program. We say “superfically” because, since the syntactic breakpoint for any given statement S has nothing to do with the location of the code for S, the state of the program at any given breakpoint may wildly differ from what one would expect based on examining the source.
Using a semantic breakpoint scheme, the breakpoint for any given statement S will be set at one of the instructions generated from S. Thus, while single-stepping from semantic breakpoint to semantic breakpoint, the statements may appear to be executing out of order with respect to the original program. However if one pays attention to which statements have executed up to the breakpoint (based on the single-stepping), the program state should be approximately what one expects.
se-Source Code Instructions
S1: i = init; I0: ADD $r9 $r7 $r6 /* S3: c + x */ S2: while (i < n) { I1: MOV $r10 $r8 /* S1 */
S3: m = c + x + y + n; I2: ADD $r12 $r13 $r11 /* S3,S4: y + n */ S4: s = s + (m * (y + n)); I3: ADD $r16 $r9 $r12 /* S3 */
S5: i++; I4: MUL $r14 $r16 $r12 /* S4: m * $r12 */ S6: } TOP: I5: BGEQ $r10 $r11 BOT /* S2 */
I6: ADDI $r10 $r10 1 /* S5 */
I7: ADD $r15 $r15 $r14 /* S4: s + $r14 */ I8: B TOP /* S6 */
BOT: I9: ...
[image:9.612.218.395.470.586.2](a) (b)
Figure 1: An example of optimized code.
Source Syntactic Semantic Statement Breakpoint Breakpoint
S1 I1 I1
S2 I5 I5
S3 I5 I3
S4 (I6 or I7) I7
S5 (I6 or I7) I6
S6 I8 I8
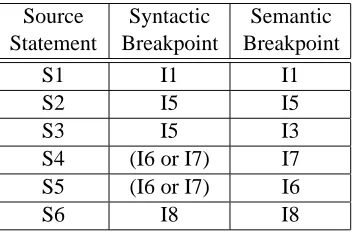
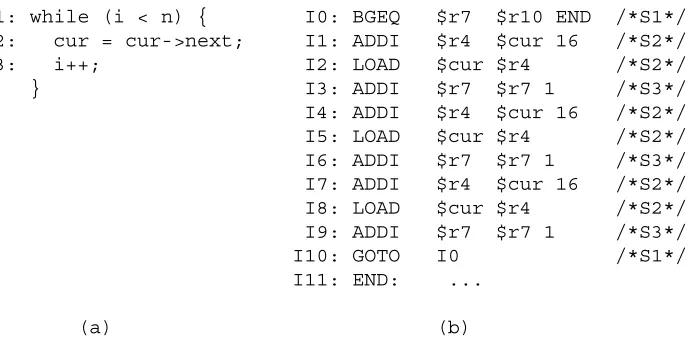
mantic breakpoints. Figure 1(a) shows a small piece of C source code. Figure 1(b) shows the instructions generated from the source code after optimizations have moved statement S3 and loop-invariant portions of S4 out of thewhileloop. We are assuming, for the sake of this illustration, that the variablemis not used after the loop shown, so moving statement S3 out of the loop without setting a guard on it does not alter the semantics of the program. Table 1 shows the instructions at which to set the syntactic and semantic breakpoints for the statements in Figure 1. For statements S1, S2, and S6, the syntactic and semantic breakpoints happen to be the same. The interesting cases are statements S3, S4, and S5. The instructions that implement statement S3 are instructions I0, I2, and I3. Since I3 calculates the final value formand leaves it in register $r16, I3 is the logical place to put the semantic breakpoint for statement S3. The syntactic breakpoint for S3, however, cannot come before the syntactic breakpoint for statement S2, namely I5. Thus the first location at which the syntactic breakpoint for S3 can occur is at instruction I5. The semantic breakpoints for statements S4 and S5 would be at instructions I7 and I6, respectively. The syntactic breakpoints for these two statements are more diffi-cult to place. Table 1 shows the syntactic breakpoints for each of these statements being at either instruction I6 or instruction I7. An important point that is not clear from the table is that, whichever instruction is used as the syntactic breakpoint for one statement, the other statement must use the same instruction. This is because, although the optimizer switched the order in which the instructions for these two statements gets executed, the syntactic breakpoints must still occur in the same or-der as the original source statements. One can either choose to set the breakpoint for statement S4 at instruction I7, in which case the syntactic breakpoint for S5 must also be at instruction I7; or, one can set the syntactic breakpoint for statement S5 at instruction I6, in which case the syntactic breakpoint for statement S4 must also be at instruction I6.
Each breakpoint scheme has advantages and disadvantages. Using syntactic breakpoints, the breakpoints for different statements always occur in the order one would expect. For example, the syntactic breakpoint for statement S3 occurs after the syntactic breakpoint for S2. If a syntactic breakpoint is set on statement S3, then execution will be suspended each time the loop is executed. However, the first time the breakpoint for statement S3 is reached, the code for the statement will have already executed. This may defeat the purpose for which the breakpoint was set.
breakpoints, execution would only be suspended once, before the loop was ever entered.
Syntactic breakpoints are most appropriate for transparent approaches to de-bugging optimized code, where one attempts to make the effects of optimizations as transparent to the user as possible, because they allow the statements to appear to execute in the order specified by the original source program. Semantic break-points are most appropriate for non-transparent approaches, where one attempts to show users some of the effects of optimizations. The concepts presented in this paper are useful for either approach, for different reasons. When introducing the concept of key instructions, it is most helpful to focus on semantic breakpoints, as they allow the most clear illustration of key instructions. Section 4.1 describes how key instructions may be used to help implement syntactic breakpoints.
Given that one has decided to use semantic breakpoints, there is still the prob-lem of determining where exactly to set the breakpoint. In particular, it may be difficult to decide which instruction, precisely, is “where a statement occurs in the binary”. Consider Figure 1 and Table 1 again. Statements S1, S2, S5, and S6 each have only one corresponding instruction, so selecting the semantic break-points for those statements is trivial. But statements S3 and S4 each have multiple corresponding instructions. For statement S3 we could have selected any of the instructions I0, I2 or I3. We chose I3 because that is where the final calculation is performed. However we could as easily have chosen I0, which is the first instruc-tion generated from S3. Similar arguments could be made for choosing either of I2 or I7 for statement S4. For more complicated statements the choice may be even more difficult. To address this problem we present the idea of key instructions.
3
Atoms and Key Instructions
3.1 Source program locations and atoms
Before one can reasonably discuss mapping between locations in the source pro-gram and locations in the target propro-gram, one needs to define what precisely is meant by “location” in each type of program. For the purposes of this paper, a location in the target program is the start of any instruction. But a “location” in the source program is more difficult to define.
A commonly used definition for setting breakpoints is “the beginning of any executable statement in the source”. At first glance this definition appears to work fairly well. However, because we are dealing with optimized target programs, there are a few problems with it. Ideally source locations for setting breakpoints would correspond to all places in the source where interesting events take place, for some definition of “interesting” (we give our definition in the next paragraph). Many high-level programming languages allow statements that may contain multi-ple such events. In unoptimized programs one can still use the source statement as a reasonable location for setting breakpoints, because all the interesting events for any given source statement execute in a cluster, with no intervening events from any other statement. This is not true once a program has been optimized. Opti-mizations may cause the code for events that occur in the same source statement to be widely scattered in the target program. To deal with this problem we introduce the concept of an atom.
Before we can formally define an atom, we need to introduce some other termi-nology. Many high-level programming languages contain both simple and complex statements, where a simple statement is one that contains at most one piece of key functionality, and a complex statement is one that contains more than one piece of key functionality. Key functionality is any functionality that changes the state of the program (at the source level), i.e. either the value of a source variable or the control flow of the program. In the context of the preceding paragraph, “interesting events” are those that correspond to pieces of key functionality.
Examples of source-level events that cause a program’s state to change (and which therefore represent pieces of key functionality) include:
• assigning a value to a source variable, field, array element, etc. • branching statements (conditionals, loops)
• function calls and returns
• general control flow statements (goto, continue, try, break, etc.)
cache behavior, for example, are not relevant to this work. For the rest of this paper, whenever we talk about a state change, we mean a source-level-visible state change.
For each piece of source code that can cause state to change, a key instruction needs to be defined. Because complex source statements may have multiple pieces each of which causes a state change in the program, the source statement is the wrong level at which to discuss source program locations. Instead we introduce the term “atom”, where an atom is a source statement, or a piece of a source state-ment, that causes a single state change in the program. In other words, an atom is the largest piece of contiguous source text that contains only one piece of key functionality. Every atom will have its own key instruction in the target program.
If two atoms happen to occur on the same source line, they both need key instructions, each with a source location tag that distinguishes it from the other1.
In order to select the key instruction for each atom, we first need a way to iden-tify all the instructions for each atom. The most logical method for doing this is by the source position the compiler associates with each target instruction. The front end of the compiler will generate a new “source position”, containing file, line, and column position information, for each atom. As the internal representation is generated, each piece is assigned the source position corresponding to the atom from which it came. Assuming the compiler propagates source position informa-tion correctly through its various phases, the target instrucinforma-tions will each have a source position indicating the location of the atom from which it was generated.2 Depending on the source and optimizations, some instructions may have multiple corresponding source positions.
Figure 2 illustrates the concept of atoms further. In Figure 2(a), the assignment statement, the increment statement and the function calls are all “atomic” state-ments (i.e. they contain only one atom). Figure 2(b) shows a set of “non-atomic” statements. The carets underneath the statements mark each atom within these complex statements. These are the positions where breakpoints would be set. In the forstatement shown, there are three separate atoms: the initial assignment toi, the increment of i, and the test-and-branch. The assignment statement in the body of theforloop contains two atoms, one that updates elements of the ar-rayaand one that incrementsk. Theifstatement shown contains four atoms: the
fopenfunction call, the assignment tofptr, the test-and-branch, and theerror
function call in the then-clause. If theifstatement had an else-clause, all of the atoms in the else-clause would also be considered atoms within theifstatement.
1Therefore it is critical to record the column position, as well as the line and file, for each source
position recorded by the compiler.
2The requirement that the compiler accurately propagate source location information is not
a[i] = j; for (i = 0; i < n; i++) {
i++; ˆ ˆ ˆ
foo(i); a[k++] = b[i-j];
bar(j); ˆ ˆ
... }
if (NULL == (fptr = fopen(filename)))
ˆ ˆ ˆ
error(); ˆ
...
[image:14.612.125.520.130.299.2](a) Atomic stmts (b) Non-atomic stmts
Figure 2: Examples of atomic and non-atomic statements in C
3.2 Identifying key instructions
Given the set of instructions generated from an atom, there are several options for selecting the key instruction. We have chosen the key instruction to be defined as follows:
Definition 1 Let A be an atom in the source program. Let I be the list of
instruc-tions in the optimized target program that the compiler generated from a single instance of A (no code duplication). The key instruction for A is the single instruc-tion in I that may cause a user-visible state change to the program.
As mentioned, this definition assumes no code duplication. To cover the case where optimizations perform code duplication, the instructions for each instance of the duplicated atom must be considered independently, and a separate key in-struction identified for each instance. We go into this topic in more detail later.
According to Definition 1, the key instruction for an atom is the unique in-struction that causes a (source-level visible) state change — in other words the instruction that updates a source variable or causes a change in the control flow. By definition all atoms must have such an instruction. The remaining problem, therefore, is to figure out which of the instructions in I may cause source-visible state changes.
branching instruction. Since one can tell by direct examination whether or not an instruction is a conditional branching instruction, identifying key instructions of this type is trivial.
The difficulty arises in attempting to identify instructions that update the value of source-level variables. We are assuming here that this identification process is to be done after the final optimized code has been generated, so the only information available is the target instructions and the target-atom associations. The assignment key instructions have no particular characteristics that set them apart from any other instructions. In unoptimized code, one might look for the instructions that write to memory locations, assuming that the instructions that update source variables must be some subset of those instructions. However, a common optimization is to eliminate the final write of a variable’s value to memory, especially if the variable is a local variable.
If we make a set of simplifying assumptions, which are true in many circum-stances for many compilers, then we can rely on the execution order of the in-structions to help us find the key inin-structions for assignment statements. The key instruction for an assignment to a source variable is the instruction that writes the final right-hand side value of the assignment to the variable’s location in memory; or, if the write to memory has been optimized away, then it is the instruction that calculates the final right-hand side of the assignment and leaves the value in a reg-ister. Because of this property, all instructions for calculating the right-hand side of the assignment, for calculating the variables’ addresses, and for branching to any exception code, must come before the key instruction. Therefore if all of the following assumptions are true, then the key instruction for an assignment atom will be the last non-nop instruction in the set of instructions generated from the assignment atom:3
• All duplicate copies of code for any given assignment atom occur in distinct basic blocks (i.e. at most one key instruction for the atom is in any basic block).
• Once the right-hand side has been calculated, the actual assigning of the value to a location never requires more than one instruction.
• There is no “clean up” code for the assignment, as might be the case with speculative execution.
If we make these assumptions, then we can identify the key instructions as fol-lows: For each atom, we go through the list of instructions generated from that
3By “last”, we mean the last one encountered by going through the instructions in the order in
atom, in execution order. The first conditional branching instruction encountered becomes the key instruction for the atom. If no such branching instruction is en-countered, then the key instruction is the last non-nop instruction encountered. The full algorithm for this approach is shown in Appendix A. We call this algorithm the Instruction Order Algorithm.
S1: while (i < n) { I0: BGEQ $r7 $r10 END /*S1*/ S2: cur = cur->next; I1: ADDI $r4 $cur 16 /*S2*/ S3: i++; I2: LOAD $cur $r4 /*S2*/ } I3: ADDI $r7 $r7 1 /*S3*/ I4: ADDI $r4 $cur 16 /*S2*/ I5: LOAD $cur $r4 /*S2*/ I6: ADDI $r7 $r7 1 /*S3*/ I7: ADDI $r4 $cur 16 /*S2*/ I8: LOAD $cur $r4 /*S2*/ I9: ADDI $r7 $r7 1 /*S3*/ I10: GOTO I0 /*S1*/ I11: END: ...
[image:16.612.135.480.222.398.2](a) (b)
Figure 3: An example of an unrolled loop.
The main problem with this algorithm is that it relies on the property that the key instruction for an assignment atom will always be the last non-nop instruction for that atom, which in turn relies on assumptions that are not always true. For ex-ample, if an optimization causes an assignment atom to be duplicated in the target program, one needs to identify a key instruction for each copy of the assignment atom, in order to be able to set breakpoints at all copies when the user requests a breakpoint at the assignment atom. This is not a problem if the different copies end up in different basic blocks, since in that case one only needs to modify the algo-rithm to examine each basic block separately. If duplicate copies of an assignment atom end up in the same basic block however, as can happen with loop unrolling, then one has a serious problem: in addition to the last non-nop instruction for the atom, other instructions in the basic block will also be key instructions for the as-signment atom, and we have no easy way of identifying which instructions these are.
instruction that writes the value to the variable’s location in memory. Thus the key instruction will be the instruction that calculates the final value for the right-hand side of the assignment atom. It could be any one of a number of operator instructions, any of which could occur multiple times in the calculation. The upshot is that one cannot rely on the type of the instruction for identifying key instructions for assignment atoms. Second, one cannot use variable names to sort out the key instruction, because there are no variable names in the instructions. Third, because of duplication, one cannot rely on the position of the instructions to identify the key instruction for an assignment atom. Figure 3 illustrates this problem. Each of the statements shown in Figure 3(a) is atomic. Figure 3(b) shows the instructions for this loop in a single basic block, where the loop has been unrolled three times. Statement S2 is responsible for the instructions I1, I2, I4, I5, I7, and I8. Statement S3 is responsible for instructions I3, I6, and I9. In both cases the last instructions, I8 and I9, are indeed key instructions for the statements. However some of the other instructions are also key instructions. The difficult question is, which ones?
The combination of circumstances described above makes it impossible to se-lect the key instruction for assignment statements purely by examining the instruc-tions. The only way to select the key instruction for an assignment statement in the presence of code duplication is to carefully examine the semantics of the source assignment statement and of each of the instructions. Doing so would require a complicated analysis. However the compiler itself does perform the required anal-yses earlier in the compilation process, when it first parses the source and generates the internal representation of the program. Therefore it makes sense to take advan-tage of the compiler.
As before, we assume the compiler has correctly assigned source position in-formation to the instructions. In addition, when the front end of the compiler gener-ates the internal representation, it now must tag the pieces of the internal represen-tation that will eventually become the key instructions for the assignment atoms. These tags get propagated through the compiler, and are used later to identify all the key instructions for assignment atoms. Key instructions for other atoms can still be identified using the method given in the previous algorithm. The complete, general algorithm for selecting key instructions is presented in Appendix B.
3.3 Concerns about atoms and semantic breakpoints
atoms, having the debugger identify and set breakpoints for each atom. Thus a single breakpoint request could result in breakpoints for multiple source locations. Another concern at this point is what to do for source locations that correspond to syntactic sugar, and hence never actually generate instructions. Some examples of this are begin-end keywords, opening and closing curly braces (in C, Java, and C++), and theelsekeyword inifstatements. Such a syntactic construct appears to programmers to be a statement in the programming language, and therefore ap-pears to be fair game as a location for requesting a breakpoint. But it is not an atom; one cannot use its key instruction for setting the breakpoint because there are no instructions for the construct. The most logical solution is to disallow breakpoints at such constructs. When the user attempts to set a breakpoint at such a location, one can automatically set the breakpoint at the next atom in the source program. This is similar to what is done by many current debuggers for unoptimized code.
4
Other Uses of Key Instructions
In this section we demonstrate the usefulness and versatility of key instructions by showing how they can solve or simplify many problems in the area of debugging optimized code. We also show the generality of key instructions by explaining how different and opposing approaches to solving other problems in the area of debugging optimized code can all benefit from using key instructions.
4.1 Setting syntactic breakpoints
The usefulness of key instructions for setting semantic breakpoints should be ob-vious. Surprisingly, they are also useful for setting syntactic breakpoints. Recall that the location for a syntactic breakpoint has very little to do with where the ac-tual instructions for a source statement ended up in the target program, while it has everything to do with the order of the statements in the original source. How-ever when setting syntactic breakpoints for a set of statements whose order has shifted around, one needs to decide which statements are the “anchor” statements and which statements have moved, and key instructions can help.
To illustrate this point, consider a source program consisting of the two state-ments, S1 and S2, in that order. Suppose that the optimizer puts the instructions for S1 after the instructions for S2 in the target program. Given that we want to use syntactic breakpoints, the breakpoint for S1 must come before the breakpoint for S2. (This situation arose back in Figure 1 and Table 1, for statements S2 and S3 and their corresponding instructions, I5 and I3.)
was stationary (the “anchor” statement), while the other statement moved past the anchor statement. One would then set the syntactic breakpoint for the anchor state-ment at the instructions corresponding to that statestate-ment, and place the breakpoint for the other statement appropriately, relative to the breakpoint for the anchor ment. The only remaining questions then become how to identify the anchor state-ments, and at which of their (possibly) multiple corresponding instructions do we set the breakpoint?
One reasonable scheme for identifying anchor points states that control flow statements (i.e. branches and joins on the control flow graph) are anchored, and other statements may or may not have moved. Once the anchor points are identi-fied, it is simplest if the syntactic and semantic breakpoints for them are the same (the key instruction for the statement). This then sets up a frame of reference for selecting the other breakpoints, between the anchor points. Again, it would be nice if as many as possible of the syntactic breakpoints coincided with the semantic breakpoints, as this would have the behavior closest to that expected by the user. Therefore it helps to know where the semantic breakpoints are. This is exactly the information one obtains from key instructions.
4.2 Implementing debugger functions
There are four basic debugger functions that critically depend on having a good solution to the code location problem: setting control breakpoints, single-stepping between source statements, stepping into a called subroutine, and returning from a subroutine to the next statement after the subroutine call. Actually, the last three are special cases of the first (setting control breakpoints). In particular single-stepping consists of removing the breakpoint from the current statement and setting a break-point on the next statement, for some definition of “next”; stepping into a subrou-tine is equivalent to setting a breakpoint on the first statement of the subrousubrou-tine; and returning is equivalent to setting a breakpoint on the first statement after the subroutine call in the caller.
instructions without changing or violating the DWARF specification.
Modifying the debugger functions described above to use key instructions is quite simple and straightforward. Without key instructions or some other well-defined mapping scheme, implementing these functions to work properly on opti-mized programs would be difficult and complex.
4.3 Solving the data location problem
Recall that the data location problem, one of the three main data value problems, is determining where to look for the value of any particular variable, at any given breakpoint in the program, in response to a user’s request. Because variables’ “home” locations may vary during the execution of an optimized program, one must construct a variable range table [9], which contains precise information about where to look for a variable at any given time during program execution.
Prior to the introduction of key instructions, this information had to be col-lected separately for each variable for each pass of each optimization that the com-piler performed. The code for collecting this information had to be distributed throughout the code for performing the optimizations themselves. In these imple-mentations it is very easy for the code that collects the variable location information to be broken by the optimizer writer any time an optimization is added, removed, reordered or changed. Furthermore because the code for collecting this informa-tion is not all in one place but is distributed throughout the optimizainforma-tion code, bugs in the variable location collection code are hard to find and fix.
By taking advantage of key instructions, we have been able to design and im-plement a simpler, more robust scheme for collecting this variable location infor-mation. The basic idea is to perform a dataflow analysis [3] on the final represen-tation of the program, after all the optimizations have been performed. Thus the data only needs to be collected once; the collection is completely independent of which particular optimizations were performed and how they were implemented; the code for collecting the information is all in one place, making the code easier to maintain; and all memory accesses, register copies, register spills and recoveries, etc. are explicit.
4.4 Non-Transparent debugging: Rewriting and reordering code
Non-transparent debugging of optimized code is an approach where the debugger allows the user to see some of the effects of the optimizations performed by the compiler [5, 17, 19, 25]. Key instructions are useful for such approaches, as they allow the debugger to determine where each atom in the source program actually executes. Two ways in which key instructions are useful in this context are: to indicate which complex source statements need to be rewritten as simpler, atomic statements (because the key instructions corresponding to the atoms have been widely separated in the optimized target program); and to allow the debugger to reorder the source statements and atoms to reflect the actual order in which they are executed. The order of execution can be determined, in turn, by the order of the key instructions in the target program.
4.5 Transparent debugging: Detecting currency
There are two basic parts to the currency problem: detecting when a variable is (or may be) non-current; and recovering from the non-currency. Although a use of key instructions for recovering from non-currency has not yet been discovered, they can certainly aid in detecting it. A variable is non-current at a particular breakpoint if either: the source program shows an assignment should have already occured, but the optimizer delayed the assignment to some point past the breakpoint; or the source program shows an assignment should occur sometime later, and the optimizer moved the assignment so that it has already occurred. In other words, non-currency is caused by out-of-order assignments to variables, relative to the source program.
By examining the key instructions corresponding to assignments to source vari-ables, one can determine the order in which assignments actually occur and com-pare it to the order in which their corresponding source statements occur to tell which assignments are out of order. This in turn should make it not too difficult to tell which variables are likely to be non-current where. Once this has been deter-mined, any of several proposed schemes for recovering from non-currency may be implemented [6, 11, 21].
5
Description of an Implementation
Optview and Optdbx are prototype tools we implemented which use key in-structions to demonstrate the practicality of a particular non-transparent approach for debugging optimized code. In this approach, a new version of the source pro-gram is generated. This new source propro-gram reflects many of the optimizations actually performed on the original program by the compiler during the compilation process. The user and the debugger then use the new, optimized source program for communicating about the state of the executing program. The original source program is available to the user merely for reference. In order to show that these ideas are workable on real systems, we implemented Optview to work in con-junction with the Silicon Graphics (SGI) Mips-Pro 7.2 C compiler, a commercial, aggressively optimizing compiler. We implemented Optdbx on top of the SGI dbx debugger, another commercial tool.
5.1 Implementation details
Optview [20] is a tool that collects information from the compiler about the opti-mizations performed during the compilation. Optview then generates an optimized version of the source program, which the user examines and uses when debugging with Optdbx.
Optdbx is a modified version of the dbx debugger. It uses a graphical inter-face to show users the optimized source generated by Optview and to help users navigate through it. We modified the underlying dbx debugger so that the debug-ging functions described in Section 4.2 use the key instruction information from the symbol table. We also modified the variable lookup function to use the variable range table information, and we implemented a partial solution to the residency problem (described in the Introduction).
When the user requests a breakpoint on a particular source line, Optdbx finds the corresponding key instruction(s) and sets the breakpoint(s) there. A single breakpoint request may result in multiple breakpoints being set in the binary, be-cause some optimizations be-cause code to be duplicated.
In the preceding paragraph, note that we described users as setting breakpoints on source lines, rather than on atoms. Dbx was originally designed to allow users to set breakpoints only at the beginning of source lines, and in particular only those lines that corresponded to the beginning of an executable statement. To avoid making massive changes to dbx, Optdbx continues this policy of allowing at most one breakpoint per source line. A result of this choice is that source locations in Optdbx system do not necessarily correspond to single atoms. Optview, our tool that generates optimized source, alleviates this problem to some extent. In the process of generating the optimized source program, Optview also splits apart non-atomic statements wherever it can, rewriting them as non-atomic statements. It does this in order to be able to move the various atoms around more freely in the optimized source, allowing the optimized source to more accurately reflect the order in which the atoms are executed in the binary.
There are many difficult issues particular to our non-transparent approach to de-bugging optimized code, but they are not relevant to this paper; they are addressed elsewhere [19, 20]. While Optview and Optdbx use key instructions to implement a non-transparent approach to debugging optimized code, the concept and use of key instructions is completely orthogonal to the transparency/non-transparency is-sue. Indeed key instructions provide the basic groundwork on which it is possible to build many different solutions to other problems in the area of debugging opti-mized code.
5.2 Key instructions and delay slots
While implementing the stepping and breaking functions in Optdbx, we came across an interesting problem related to key instructions in delay slots. In optimized code it sometimes happens that a key instruction for one source statement will be scheduled in the delay slot for another source statement. Such occurrences cause problems when attempting to set a breakpoint on the statement whose key instruc-tion is in the delay slot. In the MIPS processor, delay slot instrucinstruc-tions can never be executed separately from their branch instruction, thus execution can never halt on a delay slot instruction. Since key instructions indicate where breakpoints for source statements are supposed to be set, the result in our initial implementation was that breakpoints for statements with delay slot key instructions were never reached. They appeared to be skipped over.
instruction for the delay slot statement. In those situations where the branch in-struction is also a key inin-struction for a different source statement, the inin-struction is annotated with both optimized source locations. Whenever execution halts on the branch statement, the current source position is indicated as being both source statements.
5.3 Effort involved
The SGI Mips-Pro 7.2 C compiler consists of roughly 500,000 lines of C and C++ source code. Modifying the compiler to track and identify key instructions took roughly 5 months and required writing or changing 1,500-2,000 lines of code. The 5 months includes the time it took to become familiar with the compiler source. Making all the changes to the debugger functions (to use key instructions) took about 1 month, and required changing about 200 lines of code. It can be seen from these numbers that adapting existing compilers and debuggers to identify and use key instructions is not too difficult a task.
It is difficult to compare these costs with the costs of implementing other ap-proaches, as such data is unavailable for the most part. The only numbers we have found are for Zellweger’s Navigator debugger, which involved modifying 1,500 lines of the compiler (out of 50,000 lines) and adding 1,000 lines to the debugger; and Wism¨uller’s modifying the compiler to build his graphs, which involved 2,200 lines of code (out of 94,000 lines). Looking at the absolute number of lines of code added or modified in each of these approaches, our approach perhaps required a bit less but is roughly comparable. If one considers the number of lines added or mod-ified as a percentage of the size of the overall compiler, then our approach required the smallest amount of change (0.44%, as opposed to 5% for Zellweger and 2.34% for Wism¨uller).
6
Previous Work
are no code hoisting or sinking optimizations, and no instruction scheduling. Coutant, Meloy and Ruscetta [9] use syntactic breakpoints to solve the code location problem. In their DOC debugger, statement boundaries are tracked by attaching a label to the first instruction for a statement, when the internal repre-sentation is first generated. If that instruction gets moved or deleted, the label is moved to the next instruction. If there is no next instruction, it is moved to the preceding instruction. Thus as optimizations are performed, the statement labels are constantly being updated.
The CXdb debugger [17] builds very fine-grained mappings between a source program and its optimized binary. For every “source unit” (an expression, a state-ment, a block, a loop, or a routine) in the source program it records the source program starting and ending positions of the unit in a table. It then builds a sec-ond table, the source range table, which describes the object code ranges for each source unit. Stepping and setting breakpoints can be done at the granularity of any source unit. Semantic breakpoints are implemented by setting the breakpoint at the first instruction in each range of instructions for the specified source unit, based on the source range table. This approach is very accurate but requires a huge amount of data and bookkeeping.
Copperman [7] and Wism¨uller [22] both present indirect solutions to the code location problem. Both of them focus on solving the currency problem. In the process of doing so they construct flow graphs representing the source program, the object program, and the relationships between then. As solutions to the code location problem, these approaches are incomplete.
source program. The finish point is the last instruction after the anchor point that was generated by any statement that comes before S in the source program. When a breakpoint is set on S in the source program, the debugger suspends execution at the intercept point for S. Once the intercept point is reached, an interpreter takes over. The interpreter traverses the code from the intercept point to the finish point, interpreting only those instructions generated from statements that come before S in the source program. When the interpreter reaches the finish point, the debugger informs the user the breakpoint has been reached and services the user’s requests. If an escape point for S is reached before a finish point, the interpreter gives up and normal execution resumes (after some cleanup).
In addition to the work described above, there is a large body of work on de-bugging optimized code that does not present any solution to the code location problem [6, 10, 11, 12, 13, 14, 15, 21].
7
Conclusion
In this paper we have presented a simple, complete solution to the code location problem for debugging optimized code. We have introduced and described the concepts of atoms and key instructions. We have given a formal definition of key instructions and presented algorithms for identifying them. We have also shown the usefulness of key instructions for several different aspects of debugging optimized code. In addition to solving the code location problem, key instructions allow a much simpler solution to the data location problem than was previously possible. They are also of use for identifying anchor points for setting syntactic breakpoints, and can help with both transparent and non-transparent solutions to the currency problem.
Our implementations of Optview and Optdbx demonstrate the practicality of these concepts and prove that the ideas presented in this paper can be incorporated into existing compilers and debuggers without too much work.
A
Instruction Order Algorithm for selecting key
instruc-tions
For each atom, A, in the source program do I <- target instructions generated from A key <- null
k <- 0
while (k < |I|) do
if (I[k] is not a nop instruction) key <- I[k]
fi
if (I[k] is a branching instruction) break;
fi
k <- k + 1 od
A.key_instruction <- key od
B
General algorithm for selecting key instructions
PHASE 1 (Front-end of the compiler): For every statement S in program do
parse statement S
perform semantic analyses and checks for S generate internal representation, IR(S), for S if (S contains assignment A to source variable V)
find the piece of IR(S) that writes value to V set "key" flag on that piece of IR(S) to true fi
od
PHASE 2 (After final instructions have been generated): For each atom, A, in the source program do
if (A is an assignment to a variable)
find all instructions for A with "key" flag set mark those instructions as key instructions skip to next atom
else
k <- 0
while (k < |I|) do
if (I[k] is not a nop instruction) key <- I[k]
fi
if (I[k] is a branching instruction) break;
fi
k <- k + 1 od
fi
A.key_instruction <- key od
References
[1] A. Adl-Tabatabai and T. Gross, “Evicted Variables and the Interaction of Global Reg-ister Allocation and Symbolic Debugging”, Conference Record of the Twentieth
An-nual ACM Symposium on Principles of Programming Languages, January 1993, pp.
371-383
[2] Adl-Tabatabai, A., “Source-Level Debugging of Globally Optimized Code”, Ph.D. Dissertation, Carnegie-Mellon University, CMU-CS-96-133, May 1996
[3] A. Aho, R. Sethi, and J. Ullman, “Compilers Principles, Techniques, and Tools”, Addison-Wesley Publishing Company, 1986
[4] G. Brooks, G. Hansen and S. Simmons, “A New Approach to Debugging Optimized Code”, Proceedings of the ACM SIGPLAN ’92 Conference on Programming
Lan-guage Design and Implementation, San Francisco, CA USA, ACM SIGPLAN
No-tices 27(7), July 1992, pp. 1-11
[5] L. Cool, “Debugging VLIW Code After Instruction Scheduling”, M.S. Thesis, Ore-gon Graduate Institute of Science and Technology, July 1992
[6] M. Copperman and C. McDowell, “Technical Correspondence: A Further Note on Hennessy’s “Symbolic Debugging of Optimized Code” ”, Transactions on
Program-ming Languages and Systems 15(2), April 1993, pp. 357-365
[7] M. Copperman, “Debugging Optimized Code Without Being Misled”, ACM
Trans-actionson Programming Languages and Systems, Vol. 16, No. 3, May 1994, pp.
387-427
[9] D. Coutant, S. Meloy, and M. Ruscetta, “DOC: A Practical Approach to Source-Level Debugging of Globally Optimized Code”, In Proceedings of the 1988 PLDI
Conference, 1988
[10] D. Dhamdere and K. Sankaranarayanan, “Dynamic Currency Determination in Opti-mized Programs”, ACM Transactions on Programming Languages and Systems, Vol. 20, No. 6, November 1988, pp. 1111-1130
[11] J. Hennessy, “Symbolic Debugging of Optimized Code”, Transactions on
Program-ming Languages and Systems 4(3), July 1982, pp. 323-344
[12] U. H¨olzle, C. Chambers and D. Ungar, “Debugging Optimized Code with Dynamic Deoptimization”, Proceedings of the ACM SIGPLAN ’92 Conference on
Program-ming Language Design and Implementation, San Francisco, CA USA, ACM
SIG-PLAN Notices 27(7), July 1992, pp. 32-43
[13] L. Pollock, M. Bivens and M. Soffa, “Debugging Optimized Code via Tailoring”,
Proceedings of the 1994 International Symposium on Software Testing and Analysis,
August 1994
[14] L. Pollock and M. Soffa, “Incremental Global Reoptimization of Programs”,
Trans-actions on Programming Languages and Systems, 14(2), April 1992, pp. 173-200
[15] W. Shu, “Adapting a debugger for optimised programs”, ACM SIGPLAN Notices 28(4), April 1993, pp. 39-44
[16] J. Silverstein, ed., “DWARF Debugging Information Format”, Proposed Standard, UNIX International Programming Languages Special Interest Group, July 1993
[17] L. Streepy, G. Brooks, R. Buyse, M. Chiarelli, M. Garzone, G. Hansen, D. Lingle, S. Simmons and J. Woods, “CXdb A New View on Optimization”, Proceedings of
Supercomputer Debugging Workshop, November 1991, pp. 1-22
[18] C. Tice and S. Graham, “A Practical, Robust Method for Generating Variable Range Tables”, Tech. Report 165, Compaq Systems Research Center, Palo Alto, CA, September 2000.
[19] C. Tice, “Non-Transparent Debugging of Optimized Code”, Ph.D. Dissertation, Tech. Report UCB//CSD-99-1077, University of California, Berkeley, Oct. 1999.
[20] C. Tice and S. Graham, “OPTVIEW: A New Approach to Examining Optimized Code”, Proceedings of the ACM SIGPLAN Workshop on Program Analysis for
Soft-ware Tools and Engineering, ACM SIGPLAN Notices 33(7), July 1998, pp. 19-26
[21] D. Wall, A. Srivastava, and F. Templin, “Technical Correspondence: A Note on Hen-nessy’s “Symbolic Debugging of Optimized Code” ”, Transactions on Programming
Languages and Systems 7(1), January 1985, pp. 176-181
[22] R. Wism¨uller, “Debugging of Globally Optimized Programs Using Data Flow Analy-sis”, Proceedings of the ACM SIGPLAN ’94 Conference on Programming Language
[23] L. Wu, R. Mirani, H. Patil, B. Olsen and W. Hwu, “A New Framework for Debug-ging Globally Optimized Code”, in Proceedings of the ACM SIPLAN ’99 Conference
on Programming Language Design and Implementation, ACM SIGPLAN Notices
34(5), May 1999, pp. 181-191
[24] P. Zellweger, “An Interactive High-Level Debugger for Control Flow Optimized Pro-grams”, Proceedings of the ACM SIGSOFT/SIGPLAN Software Engineering
Sympo-sium on High Level Debugging, ACM SIGPLAN Notices 18(8), August 1983, pp.
159–171