Journal of Chemical and Pharmaceutical Research, 2014, 6(10):794-799
Research Article
CODEN(USA) : JCPRC5
ISSN : 0975-7384
Synthesis, characterization and thermal decomposition of bismuth(III)
ternary complexes of phthalate
Qing Zang, Guo-Qing Zhong
*and Yan Zhang
School of Material Science and Engineering, Southwest University of Science and Technology, Mianyang, China
_____________________________________________________________________________________________
ABSTRACT
Two new complexes of bismuth nitrate with phthalic acid (H2phth) were synthesized by liquid state reaction. The complexes were characterized by chemical and elemental analyses, Fourier transformed infrared spectra, X-ray powder diffraction and thermgravimetry analysis. Their compositions are Bi(phth)(NO3)·4H2O and Bi(phth)(L-cys)0.5·H2O (L-H2cys = L-cystine), respectively. The crystal structure of the complexes belongs to monoclinic system with lattice parameters of a = 1.0792 nm, b = 2.2169 nm, c = 1.0306 nm and β = 95.68° for Bi(phth)(NO3)·4H2O; and a = 1.4183 nm, b = 2.2633 nm, c = 1.3753 nm and β = 96.49° for Bi(phth)(L-cys)0.5·H2O, respectively. IR spectra indicate that the bismuth(III) ion in the two complexes is six-coordinated by the carboxyl oxygen atoms from the ligands and oxygen atoms from nitrate ion, respectively. The thermal decomposition processes of the complexes under nitrogen include dehydration and pyrolysis of the ligands, and the final residue at about 480 °C is bismuthous oxide.
Key words: bismuth(III); ternary complex; phthalic acid; synthesis; crystal structure; thermal decomposition
_____________________________________________________________________________________________
INTRODUCTION
As we know, the main group elements do not easily form complexes with organic ligands because of the special properties. But the complexes of the main group metal ions, such as bismuth ion, can possess a certain biologic function. The coordination chemistry of bismuth is currently causing particular interest as a result of its myriad applications in medicine and biochemistry catalysis, ferroelectrics, superconductors, and many other oxide based materials [1-5]. The fifth main group metal compounds including inorganic and metal organic complexes have been studied for decades thanks to the interesting medical, physical properties and material functions [6-8]. In contrast to the comprehensive database of other stable elements in the periodic table, bismuth has possibly the least well established data bank, although bismuth has long been used in medicine. The complexes of bismuth have biological functions, such as sterilization, antibacterial activity, anticancer, and so forth [9-14].
Chemical scholars are concentrating much attention on the synthesis and identification of new bismuth complexes that are suitable for these applications [15]. Bismuth compounds have been widely used in the clinic because of their higher effectiveness and lower toxicity in the treatment of a kind of microbial infections, including syphilis, diarrhea, gastritis and colitis [16-18]. The research of bismuth interactions with potential targeting biomolecules, including peptides, proteins and enzymes, will bring about an understanding of the mechanism of action of bismuth-containing complexes and in turn to the further application of bismuth in medicine [19, 20].
EXPERIMENTAL SECTION
Materials and physical measurements
In addition to L-cystine (L-H2cys) was biochemical reagent, other chemicals used in the experiments were analytical
reagents as received from commercial sources and without further purification. L-cystine and manna sugar were purchased from Sinopharm Chemical Reagent Co., Ltd., while phthalic acid (H2phth), lithium hydroxide
(LiOH·H2O) and bismuth nitrate [Bi(NO3)3·5H2O] were received from Chengdu Kelong Chemical Reagent
Company.
The contents of carbon, hydrogen, nitrogen, sulfur and oxygen in the complexes were determined by Vario EL CUBE elemental analyzer for Germany Elemental Analysis System Company. The content of bismuth in the complexes was determined by EDTA complexometric titration. The X-ray powder diffraction patterns of the complexes were recorded by a D/max-II X-ray diffractometer in the diffraction angle range of 3°–80° from Japan Science Corporation, Cu Kα1 radiation (λ = 0.154056 nm), Ni filter, scanning rate was 8°(2θ) min−1 at room
temperature. The Infrared spectra of the complexes and phthalic acid were measured by a Nicolet 5700 Fourier transform infrared spectrometer from America using potassium bromide pellets in the region of 4000–400 cm−1. The thermogravimetric analyses for the complexes were performed by a TA Q500 thermal analyzer in dry nitrogen at a heating rate of 10 °C min−1.
Synthesis of phthalate lithium
Phthalic acid (10 mmol, 1.66 g) and lithium hydroxide (20 mmol, 0.84 g) were weighed and mixed in aqueous solution. The mixture was stirred for 4 h at room temperature. The solvent was evaporated by the rotary evaporator, and the resultant was filtrated and dried about 24 h in the vacuum drying oven at 40 °C. Lastly, the white powder of phthalate lithium (Li2phth) was obtained.
Synthesis of complex Bi(phth)(NO3)·4H2O
2 mmol (0.97 g) bismuth nitrate [Bi(NO3)3·5H2O] and 2 mmol (0.36 g) manna sugar were placed in an agate mortar
and pestle to a pasty. Then the mixture was dissolved in 40 mL deionized water, and the colorless and transparent solution was obtained. Afterwards 20 mL aqueous solution of Li2phth (2.0 mmol, 0.36 g) was added to the above
solution, the mixed solution was continuously stirred at room temperature for 5 h. Finally, the resultant was filtered by vacuum and dried in a vacuum drying oven at 40 °C for 24 h. The resultant of white powder was obtained, and the yield was about 85%.
Synthesis of complex Bi(phth)(L-cys)0.5·H2O
2 mmol (0.97 g) bismuth nitrate and 2 mmol (0.36 g) manna sugar were placed in an agate mortar and pestle to a pasty, then the mixture was dissolved in 40 mL deionized water, and became the colorless and transparent solution. Afterwards the 20 mL aqueous solution of phthalic acid (2 mmol, 0.33 g), L-cystine (1 mmol, 0.24 g) and lithium hydroxide (6 mmol, 0.25 g) was added to the above solution, the mixed solution was continuously stirred at room temperature for 5 h. Finally, the resultant was filtered by vacuum and dried in a vacuum drying oven at 40 °C for 24 h. The resultant of white powder was obtained, and the yield was about 78%.
RESULTS AND DISCUSSION
The composition of the complexes
The elemental analyses results of the complexes are listed in Table 1. The composition formulae of the complexes are BiC8H12O11N (Mr = 507.16) and BiC11H11O7NS (Mr = 510.24), respectively. The calculated results of mass
[image:2.595.81.529.663.694.2]fraction of each element in the complexes are very close to the experimental ones. Therefore, combined with the results of the infrared spectra and the thermal analysis, the molecular formulae of the complexes is Bi(phth)(NO3)·4H2O and Bi(phth)(L-cys)0.5·H2O, respectively.
Table 1 Elemental analyses results of the complexes (Calculated values are in brackets)
Complex Formula w(Bi)(%) w(C)(%) w(H)(%) w(N)(%) w(S)(%) w(O)(%)
Bi(phth)(NO3)·4H2O BiC8H12O11N 41.55 (41.21) 19.11 (18.95) 2.31 (2.38) 2.49 (2.76) ‒ 34.22 (34.70) Bi(phth)(L-cys)0.5·H2O BiC11H11O7NS 40.56 (40.96) 26.01 (25.89) 2.23 (2.17) 2.84 (2.74) 6.39 (6.28) 21.97 (21.95)
X-ray powder diffraction analysis
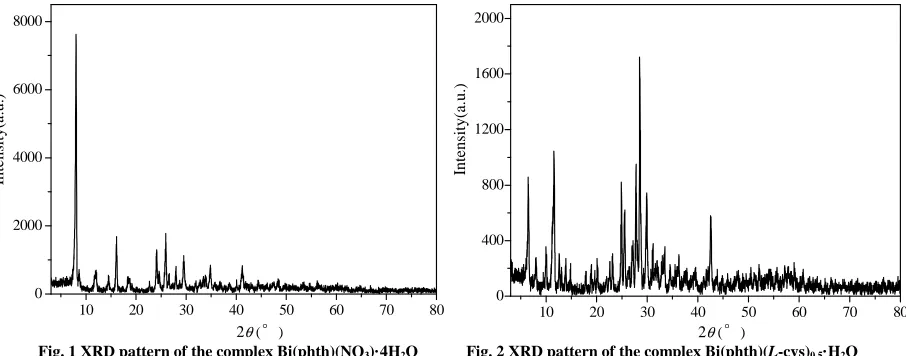
Figs. 1 and 2 depict the XRD patterns of the complexes Bi(phth)(NO3)·4H2O and Bi(phth)(L-cys)0.5·H2O. It is seen
that the complexes of Bi(phth)(NO3)·4H2O at 2θ = 8.02°, 25.92° and 16.03°, and Bi(phth)(L-cys)0.5·H2O at 2θ =
13-0823) at 2θ = 15.45°, 27.08° and 22.32°, and L-H2cys (JCPDS card no. 23-1663) at 2θ = 28.50°, 18.84° and
28.00° disappear in the complexes. The diffraction angle (2θ), spacing (d) and diffractive intensity of the products are different from the reactive materials, which may explain that the above two products are not simple mixing of the reactants, but the formation of new compounds.
10 20 30 40 50 60 70 80
0 2000 4000 6000 8000
In
te
n
si
ty
(a
.u
.)
2θ(°)
10 20 30 40 50 60 70 80
0 400 800 1200 1600 2000
In
te
n
sity
(a
.u
.)
2θ(°)
[image:3.595.82.535.129.307.2]Fig. 1 XRD pattern of the complex Bi(phth)(NO3)·4H2O Fig. 2 XRD pattern of the complex Bi(phth)(L-cys)0.5·H2O
Table 2 Experimental data and calculated results for powder X-ray diffraction pattern of the complex of Bi(phth)(NO3)·4H2O
(monoclinic: a = 1.0792 nm, b = 2.2169 nm, c = 1.0306 nm and β = 95.68°)
2θ(°) h k l dexp(nm) dcal(nm) I/I0 2θ(°) h k l dexp(nm) dcal(nm) I/I0 8.02 1 0 0 1.0737 1.0739 100.0 25.92 3 1 −1 0.3434 0.3446 21.9
8.62 0 0 1 1.0252 1.0255 7.4 26.63 1 6 −1 0.3345 0.3340 4.2
11.74 0 2 1 0.7530 0.7528 5.6 27.96 2 3 2 0.3189 0.3191 8.3
12.00 1 1 −1 0.7368 0.7369 7.5 29.54 2 0 −3 0.3021 0.3022 13.1
14.50 1 3 0 0.6103 0.6088 6.1 33.48 1 5 −3 0.2674 0.2675 3.8
16.03 0 4 0 0.5526 0.5542 21.3 33.82 1 7 −2 0.2648 0.2646 4.6
18.40 1 0 −2 0.4817 0.4816 5.7 34.56 4 2 −1 0.2593 0.2589 2.2
22.68 2 0 −2 0.3917 0.3907 1.7 34.84 3 6 0 0.2573 0.2571 9.0
24.12 2 2 −2 0.3687 0.3684 15.3 35.02 0 0 4 0.2560 0.2564 3.6
24.53 1 4 −2 0.3627 0.3635 6.9 40.93 4 5 1 0.2203 0.2202 3.6
[image:3.595.125.486.346.489.2]25.63 1 4 2 0.3474 0.3474 6.4 41.08 1 9 −2 0.2195 0.2193 5.9
Table 3 Experimental data and calculated results for powder X-ray diffraction pattern of the complex of Bi(phth)(L-cys)0.5·H2O
(monoclinic: a = 1.4183 nm, b = 2.2633 nm, c = 1.3753 nm and β = 96.49°)
2θ(°) h k l dexp(nm) dcal(nm) I/I0 2θ(°) h k l dexp(nm) dcal(nm) I/I0 6.23 1 0 0 1.4105 1.4092 17.5 27.79 1 1 4 0.3207 0.3205 48.9 6.56 0 1 0 1.3665 1.3665 46.6 28.51 3 5 1 0.3128 0.3116 100.0 9.85 1 2 0 0.8848 0.8824 17.5 28.81 3 0 3 0.3102 0.3100 31.1 11.68 1 2 −1 0.7657 0.7664 59.5 30.81 0 6 3 0.2907 0.2905 5.6 12.53 2 0 0 0.7028 0.7046 14.3 31.17 3 3 3 0.2870 0.2867 16.5
14.83 2 2 0 0.5961 0.5981 11.2 31.69 0 8 0 0.2828 0.2829 8.8
17.80 1 4 −1 0.4978 0.4972 6.7 32.06 5 1 0 0.2793 0.2797 9.4
18.90 2 3 1 0.4680 0.4692 10.9 32.78 5 2 −1 0.2738 0.2740 11.5 19.68 0 5 0 0.4522 0.4527 7.1 33.16 0 1 −5 0.2714 0.2713 14.3 20.37 1 1 −3 0.4397 0.4400 3.0 33.43 4 5 1 0.2676 0.2678 18.7 23.06 2 4 −2 0.3837 0.3832 16.0 34.46 3 4 −4 0.2597 0.2598 11.0 24.86 3 4 −1 0.3575 0.3572 46.6 42.38 5 7 −1 0.2126 0.2127 30.9 25.20 4 0 −1 0.3509 0.3509 14.7 50.41 5 6 4 0.1811 0.1812 8.4
25.52 1 6 1 0.3493 0.3496 32.0 52.10 1 5 7 0.1755 0.1754 8.6
26.93 3 4 −2 0.3314 0.3316 16.8 55.61 6 8 −4 0.1657 0.1658 8.4 27.21 2 3 3 0.3278 0.3280 27.2 59.06 5 8 −6 0.1564 0.1565 9.9
Bi(phth)(NO3)·4H2O, and a = 1.4183 nm, b = 2.2633 nm, c = 1.3753 nm and β = 96.49° for Bi(phth)(L-cys)0.5·H2O,
respectively.
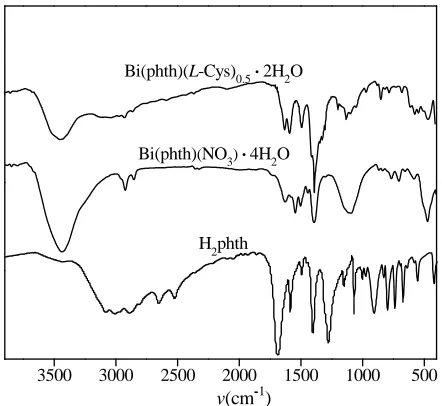
Infrared spectra
The IR spectra of the complexes are compared with those of free ligand in order to determine the coordination sites that may involved in chelation. The IR spectra of the ligand and the complexes are shown in Fig. 3. The IR spectra of Bi(phth)(NO3)·4H2O and Bi(phth)(L-cys)0.5·H2O show that the broad strong absorption band at 3439 cm−1 or
3442 cm−1 is due to the ν(O–H) of water molecules, absorption band at 3059 cm−1 is due to ν(N–H)of L-cystine, respectively. The absorption peak at 1628 cm–1 or 1624 cm–1 is assigned to the deformation vibration of water molecules [15]. The stretching vibration peaks of νas(COO–) and νs(COO–) are observed at 1688 cm−1 and 1406 cm−1
for free phthalic acid ligand. The strong absorption band at 1546 cm–1 is assigned to the asymmetric stretching vibration of carboxylic groups while the absorption band at 1394 cm–1 corresponds to the symmetric stretching vibration of carboxylic groups for IR spectra of Bi(phth)(NO3)·4H2O. Usually, the difference value (∆ν) between
νas(COO–) and νa(COO–) in the IR spectra can be used to derive information regarding the bonding modes of
carboxylic anions. Namely, the ∆ν of 152 cm–1 indicates that the carboxylic groups in the complex Bi(phth)(NO3)·4H2O exhibit bidentate bridge type coordination mode [21]. The free nitrate radical belongs to D3h
symmetry group. Many vibration modes in the molecule with D3h symmetry are infrared active. When the oxygen
atoms of nitrate radical are coordinated to the metal ions, its symmetry group is changed from D3h to C2v. The
vibration bands at 1504, 1094, 767 and 706 cm−1 are attributed to the characteristic absorption peaks of the coordinated NO3−. The characteristic vibration band at ca. 700 cm−1 is split into two absorption peaks of 767 and
706 cm−1, and the difference value is 61 cm−1, the difference range of 66–25 cm−1 shows bidentate coordinated nitrate. The new bands at 585 and 473 cm−1 are found in the infrared spectrum of the complexes, which are assigned to the stretching vibration peaks of the Bi–O bonds which are formed with the nitrate-O and carboxylate-O atoms, respectively. Therefore, it is concluded that phthalate behaves as bidentate mode and binds to the bismuth ions through the nitrate oxygen atoms and carboxylate oxygen atoms in the deprotonated carboxyl groups [27]. The infrared spectrum of the complex Bi(phth)(L-cys)0.5·H2O exhibits salient features at 1582 and 1384 cm−1, which are
assigned to the νas(COO –
) and νs(COO –
) stretching vibration peaks of the coordinated carboxyl groups (∆v[νas(COO–)–νs(COO–)] = 198 cm−1), it indicates that the oxygen atoms of the carboxyl in the compound is
directly linked with the bismuth ion and the presence of carboxylate groups coordinate to bismuth ion in bidentate bridge type coordination mode [28-30]. The medium strong bands at 569 and 462 cm−1 are attributed to the Bi–O bond stretching vibration peaks.
3500 3000 2500 2000 1500 1000 500
v(cm-1)
Bi(phth)(NO3) ●4H
2O
H
2phth
Bi(phth)(L-Cys)0.5●2H
[image:4.595.195.416.438.641.2]2O
Fig. 3 Infrared spectra of the ligand and the complexes
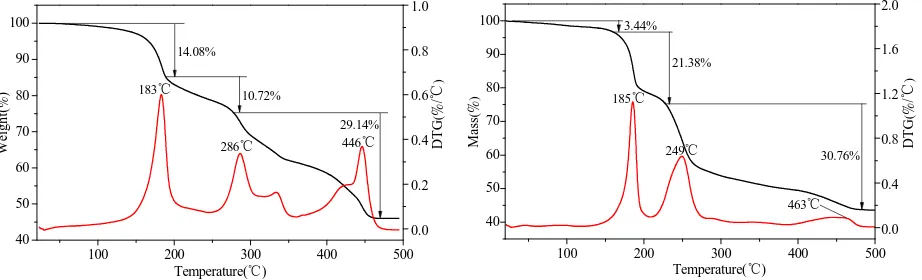
Thermal decomposition process
The TG-DTG curves are made in order to verify the bonds and composition of complexes [31]. The thermal stability of the complexes were examined representatively by thermaogravemetric analysis (TG) in nitrogen atmosphere from room temperature to 500 °C at a heating rate of 10 °C min−1. The results are shown in Figs. 4 and 5, the data of possible thermal decomposition processes are listed in Table 4. The TG curve of the two complexes display three main steps of mass loss. Fig. 4 shows,the first mass loss of 14.08% in TG curve occurs between 50 °C and 190 °C in the complex Bi(phth)(NO3)·4H2O, corresponding to the loss of four water molecules. The theoretical mass loss
O2 from the complex, the experimental mass loss is close to the calculated one (10.65%). Upon further heating, the
mass loss of 29.14% in TG curve corresponds to oxidation and decomposition of the phthalate ligand (calculated 29.20%). The mass loss remains constant until ca. 460 °C, and the final residue is only bismuthous oxide, and the experimental result (46.06%) is in agreement with the result of theoretical calculation (45.94%). These results further ascertain that the complex is composed of Bi(phth)(NO3)·4H2O.
100 200 300 400 500
40 50 60 70 80 90 100 446℃ 10.72% 14.08% W ei g h t( % )
Temperature(℃)
183℃ 286℃ 0.0 0.2 0.4 0.6 0.8 1.0 D T G ( % / ℃ ) 29.14%
100 200 300 400 500
40 50 60 70 80 90 100 D T G ( % / ℃ )
Temperature(℃)
[image:5.595.78.539.142.282.2]M a ss ( % ) 3.44% 30.76% 21.38% 0.0 0.4 0.8 1.2 1.6 2.0 185℃ 249℃ 463℃
Fig. 4 TG-DTG curves of Bi(phth)(NO3)·4H2O Fig. 5 TG-DTG curves of Bi(phth)(L-cys)0.5·H2O
Fig. 5 shows that one water molecule is lost when heating the compound from 40 °C to 170 °C. This accounts for 3.44% mass loss observes in TG curve. The theoretical mass loss (3.53%) of water molecule is much closed to the experimental mass loss. The second mass loss of the complex Bi(phth)(L-cys)0.5·H2O occurs between 170 °C and
[image:5.595.178.439.434.585.2]230 °C. It is due to the elimination of L-cystineanion ligand. The experimental mass loss of 21.38% is close to the calculated one (21.78%). Upon further heating, the complex is decomposed completely until ca. 480 °C, the mass loss of 30.57% in TG curve corresponds to oxidation and decomposition of the phthalate ligand (calculated 29.03%). The final residue is bismuthous oxide, and the experimental result (44.61%) is in agreement with the result of theoretical calculation (45.66%). These results further ascertain the complex is composed of Bi(phth)(L-cys)0.5·H2O.
Table 4 Thermal decomposition data of the complexes Bi(phth)(NO3)·4H2O and Bi(phth)(L-cys)0.5·H2O
Reaction Peak Temp.in DTG (°C) Mass loss (%)
mexp mtheor Bi(phth)(NO3)·4H2O
↓ −4H2O
Bi(phth)(NO3)
↓ −NO2, −0.25O2
0.5Bi2(phth)2O
↓ −C6H4(CO)2O
0.5Bi2O3
183 286 446 14.08 10.72 29.14 46.06a 14.21 10.65 29.20 45.94b
Bi(phth)(L-cys)0.5·H2O
↓ −H2O
Bi(phth)(L-cys)0.5
↓ −0.5[SCH2CH(NH2)CO]2O
0.5Bi2(phth)2O
↓ −C6H4(CO)2O
0.5Bi2O3
185 249 463 3.44 21.38 30.57 44.61a 3.53 21.78 29.03 45.66b
a The experimental mass% of the residue in the sample, b the calculated mass% of the residue in the sample.
CONCLUSION
Two ternary complexes of bismuth(III) were synthesized with bismuth nitrate, phthalic acid and L-cystine as main raw materials by liquid reaction at room temperature. The composition of complexes was determined by titration analysis and elemental analyses, and the structure of complexes was characterized by XRD, FTIR and TG-DTG. The crystal structures of the two complexes belong to monoclinic system, and the lattice parameters are: a = 1.0792 nm,
b = 2.2169 nm, c = 1.0306 nm and β = 95.68° for Bi(phth)(NO3)·4H2O, and a = 1.4183 nm, b = 2.2633 nm, c =
1.3753 nm and β = 96.49° for Bi(phth)(L-cys)0.5·H2O, respectively. The results demonstrate that the carboxy group
oxygen atoms of phthalate and L-cystine and the oxygen atoms from nitrate are coordinated directly to bismuth(III) ion in the two complexes. The complexes are decomposed into Bi2O3 at about 480 °C.
Acknowledgments
Technology, and Engineering Research Center of Biomass Materials of Education Ministry for the testing of elemental analyses, XRD, FTIR and TG-DTG.
REFERENCES
[1] S Sivasekar; K Ramalingam; C Rizzoli; N Alexander, Inorg. Chim. Acta, 2014, 419, 82–88.
[2] V Stavila; RL Davidovich; A Gulca; KH Whitmirc, Coord. Chem. Rev., 2006, 250(21-22), 2782–2810. [3] MX Li; M Yang; JY Niu; LZ Zhang; SQ Xie, Inorg. Chem., 2012, 51(22), 12521–12526.
[4] TD Boyd; I Kumar; EE Wagner; KH Whitmire, Chem. Commun., 2014, 50(27), 3556–59. [5] KG Caulton; LG Hubcrt-pfalzgraf, Chem. Rev., 1990, 90(6), 969–995.
[6] GQ Zhong; SR Luan; P Wang; YC Guo; YR Chen; YQ Jia, J. Therm. Anal. Calorim., 2006, 86(3), 775–781. [7] LE Turner; MG Davidson; MD Jones; H Ott; VS Schulz; PJ Wilson, Inorg. Chem., 2006, 45(16), 6123–6125. [8] ZP Zhang; GQ Zhong; QY Jiang, Prog. Chem., 2008, 20(9), 1315–1323.
[9] JG Shao; YX Yang; BW Li; LP Zhang; YR Chen; XL Liu, J. Therm. Anal. Calorim., 2009, 96(1), 277–285. [10] QY Jiang; J Shen; GQ Zhong, Prog. Chem., 2006, 18(12), 1634–1645.
[11] M Busse; I Trinh; PC Junk; RL Ferrero; PC Andrews, Chem.-Eur. J., 2013, 19(17), 5264–5275.
[12] JA Lessa; DC Reis; IC Mendes; NL Speziali; LF Rocha; VRA Pereira; CML Melo; H Beraldo, Polyhedron,
2011, 30(2), 372–380.
[13] DC Reis; MCX Pinto; EM Souza-Fagundes; SM Wardell; JL Wardell; H Beraldo, Eur. J. Med. Chem., 2010, 45(9), 3904–3910.
[14]II Ozturk; CN Banti; N Kourkoumelis; MJ Manos; AJ Tasiopoulos; AM Owczarzak; M Kubicki; SK Hadjikakou,
Polyhedron, 2014, 67, 89–103.
[15] QY Jiang; HQ Deng; YM Hu; J Shen; GQ Zhong; NH Hu, Acta Chim. Sin., 2008, 66(12), 1429–1434.
[16]EV Kovaleva; LA Zemnukhova; VM Nikitin; RL Davidovich; UV Kharchenko, Russ. J. Appl. Chem., 2003, 76(9), 1389–1392.
[17]XW Zhang; J Xia; HW Yan; SL Luo; SF Yin; CT Au; WY Wong, J. Organomet. Chem., 2009, 694(18), 3019–3026.
[18] SV Kharitonov; YuM Kozyreva; VI Zarembo, Pharm. Chem. J., 2008, 42(10), 604–606.
[19] YK Li; M Yang; MX Li; H Yu; HC Wu; SQ Xie, Bioorg. Med. Chem. Lett., 2013, 23(8), 2288–2292. [20] HZ Sun; KY Szeto, J. Inorg. Biochem., 2003, 94(1-2), 114–120.
[21] GQ Zhong; J Shen; QY Jiang; YQ Jia; MJ Chen; ZP Zhang, J. Therm. Anal. Calorim., 2008, 92(2), 607–616. [22] QY Jiang; GQ Zhong; J Shen, Chin. J. Chem., 2011, 29(12): 2637–2642.
[23] J Shen; B Jin; QY Jiang; GQ Zhong; YM Hu; JC Huo, Inorg. Chim. Acta, 2012, 385, 158–163. [24] D Li; GQ Zhong, Bioinorg. Chem. Appl., 2014, 2014, Article ID 461605.
[25] GQ Zhong; RR Jia; YQ Jia, Adv. Mater. Res., 2012, 549, 292–296. [26] M Gu; GQ Zhong, J. Synth. Cryst., 2013, 42(6), 1241–1246.
[27] MS Refat; GG Mohamed; RF de Farias; AK Powell; MS El-Garib; SA El-Korashy; MA Hussien, J. Therm.
Anal. Calorim., 2010, 102(1), 225–232.
[28] GB Deacon; R J Philips, Coord. Chem. Rev., 1980, 33(3), 227–250.
[29] K Nakamoto, Infrared and Raman Spectra of Inorganic and Coordination Compounds, 4th edition, Wiley & Sons, New York, 1986.
[30] B Xu; B Yan, Spectrosc. Lett., 2006, 39(3), 237–248.