AN EYE FEATURE EXTRACTION SCHEME BASED ON
HARRIS ALGORITHM
1WENGDONG ZHAO, 2HUI QI, 3ZHIGUO XIAO
1Faculty of Computer Engineering, Huaiyin Institute of Technology, Huaian 223001, Jiangsu, China 2Department of Computer, Taiyuan Normal University, Taiyuan 030024, Shanxi, China
3Faculty of Computer Engineering, Hohai University, Naijing 210098, Jiangsu, China
ABSTRACT
In order to improve the recognition rate of the facial recognition system and the efficiency of the algorithm, a method based on Harris algorithm and changes of threshold to extract eye contour automatically is proposed. This method uses the idea of minimum extremal region. It makes use of the dynamic change of threshold form low to high. After location the eye area initially, the location of the eye pupil is located accurately by means of the method of gray statistic. Then Harris algorithm is used to confirm the eye point position. Finally, the characteristics of the eye contour are fitted. The experimental result shows that this method can extract the feature of eye contour effectively and has the better robustness about illumination and facial expression.
Keywords: Eye Feature, Minimum Extremal Region, Harris Algorithm, Expression Recognition
1. INTRODUCTION
Eye location is not only the basis of facial normalization, but also plays an important role in many aspects such as gesture identification, video tracking, human-computer interaction, etc [1, 10]. Also, the accurate extraction of eye feature is even an important role in analysis and dealing with the face. Eye Feature includes the location of pupil and canthus, the size of eyeball and the contour of eyelid. Among these features, the contour of eyelid and canthus play an important part in the applications such as face modeling and recognition, facial expression recognition and driver fatigue detection in the three-dimensional, etc.
On the basis of researching large extractions of eye features, a method based on Harris algorithm and changes of threshold to extract eye contour automatically is proposed in this paper. Based on coarse location in the eye area and the idea of minimum extremal region [2, 11], and using the dynamic change of threshold form low to high, the location of the eye pupil is located accurately recurs to natural constrains and similarity analysis. Then the characteristics of the eye contour are gained.
2. EYE FEATURE EXTRACTION
Eye feature extraction can be generally divided into 4 steps: coarse location in the eye area, location in the pupil and eyeball, location in the canthus and fitting of the eye contour.
2.1A Coarse Location in the Eye Area
The concept of extremal region was firstly proposed by Matas et al. The basic meaning of minimum extremal region (MER) can be defined as follows [3, 4]. If the grayscale value of the elements in the region of Q is less than the grayscale value of boundary, then Q is the extremal region. If the grayscale value of the elements in the region of Q is less than a threshold value g, then minimum extremal region Q can be expressed as mer g( ). We can understand the minimum extremal region as follows. To a grayscale image whose gray scale ranges from 0 to 255, if g=0, then mer g( )
represents a black spot or a black area. If g=255, then mer g( ) represents the whole image.
Ifg∈
[
0, 255]
, then mer g( )⊆mer g( +1) is existed certainly.eyes, the threshold stops changing. At this time, these regions and pixels should be remarked. Also their location coordinates should be recorded. Because each piece of face images has some differences, there will always be some interfering factors when choosing the best threshold [5, 9]. To eliminate the disturbances and determine the location of the eye region, the right eye location should be determined. In order to express the relation better among the regions, the 4-dimensional feature between two regions can be extracted according to equation (1).
( 1)
, , , , , 1, ,
2 2 2
r l r l
i r l r l r l
x x y y n n F =c c x −x y −y + + i= −
(1)
In this equation, cl and cr are the black pixel
quantitative value of left and right eye’s regions.
x r l
d =x −x is the horizontal spacing between left
and right eye’s regions, dy =yr−yl is the vertical
spacing between left and right eye’s regions,
(
xr+xl)
/ 2 ,(
yr +yl)
/ 2 is the symmetricalcoordinates between left and right eye’s regions. According to equation (1) and with the natural constraints framed in document [7], the pseudo-area can be removed by the constraints of
(
x yl, l)
,(
xr,yr)
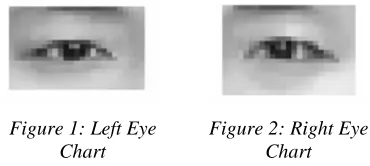
and dx, dy. And Fi which is representsthe two left and right regions detected, as shown in figure 1 and figure 2.
2.2Accurate Location in the Pupil
[image:2.612.99.284.544.627.2]After location the eye area initially, the location of the pupil can be located accurately. Eye pupil is blacker than the adjacent regions, so the method based on Gray Statistics can be used to locate the location of pupil.
Figure 1: Left Eye Chart
Figure 2: Right Eye Chart
2.2.1Determine the horizontal position of the
pupil
When we determine the horizontal position, we regard the shape of pupil as a rectangle [6]. Most researchers
regard the shape of pupil as a circular or square before. These methods exist the obvious deficiencies, that is, when the amplitude of people's eyes which are
open is less, the shape of pupil is not a circular or
of pupil as a rectangle. After facial normalization, there are little differences about the size among every
people’s pupils. When determining the horizontal position, the pupil can be assumed that rectangle size
is
3 6
×
. The rectangle is slid in the areas which are got by coarse location in the eye area. The average ofeach grayscale value of all pixels in the rectangle region is set be minimum. At the same time, the left
side of the rectangle is remarkedRleft, and the right
side of the rectangle is remarkedRright. Then some highlighted points existed during the horizontal location are leached by using median filter to remove
the impact of these high highlights.
Figure 3: The Comparison Among Square, Round, Rectangular Shape
2.2.2Determine the height of pupil and vertical
location
The height of rectangle which belongs to horizontal location is turned into3+i(0< <i 4). Then the rectangle is moved up and down in the range of [Rleft Rright, ] which is in the coarse location in the eye area. And the average of each grayscale value of all pixels in the rectangle region is calculated. Next the rectangle which has the minimum average is chose to be the final size of pupil’s location. And the top of the rectangle is remarked Rtop . The bottom of the rectangle is remarked Rbottom . So the rectangle which is composed ofRleft,Rright,Rtop and Rbottom can be acted as the result of pupil’s location.
2.2.3Location in the canthus based on Harris
algorithm
Harris algorithm is a feature point extraction algorithm based on a signal [7, 12]. It is proposed by C Harris and M J Stephens in 1988 and the former is Morave algorithm. The equation of corner detection proposed by Morave is given by:
( )
[
]
2,
, |x y ( , ) ( , ) ( , )
E uν =
∑
w x y I x u y+ + −v I x y (2)(
( , ) |( , )x y)
[ ]
,u E u v u v M
v
≅
(3)
2
2
( , ) x x y
x y y
I I I M w x y
I I I
=
∑
(4)x
I represent the derivative of horizontal
direction, and Iy represent the derivative of
vertical direction. Then we can gain equation (5) with solution to the similarity diagonalization of M.
1 1
2
0 0
M→R− λ λ R
(5)
M is a 2 2× matrix. λ1 and λ2 are two
eigenvalues of matrix M. Every pixel corresponds to such a matrix. R is regarded as a twiddle factor. Then we can analyze the changing brightness values according to λ1 and λ2 . When the two
eigenvalues are both small, the point locate in the plain areas. When one is large and the other is small, the point is one of the edge points. If they are both very large, the point is considered as corner point.
2 1 2 ( 1 2)
Cornerness=λ λ −k λ λ+ (6)
Where λ1 and λ2 can be expressed as the trace
of matrix M, and λ λ1+ 2 represent determinant of
this matrix. The value of k usually is between 0.03 and 0.2. When Cornerness is larger than threshold and is the local maximum value in a surrounding area, the exact point can be the candidate corner point.
Due to the emphasis of eye feature extraction is to find the location of eye corner points, many corner points can be detected when doing the corner detection in the face image. So the corner points detected should be filtered. The filtering region is the coarse location in the eye area. Two corner points are found in the most left side and the most right side of the coarse location in the eye area. At the same time, the vertical location of these two corner points (Height) must satisfy the conditions ofRtop<Height<Rbottom. Rtop and
[image:3.612.328.524.616.716.2]Rbottom are the top of pupil location and the bottom of pupil location, the results shown in figure 4.
Figure 4: The Result Of Harris Corner Detection
Experiment results are shown that the corner points detected distribute intricately by using the corner detection to detect the facial feature simply. So filtering the result of corner detection is needed. The algorithm of filtering Corner is usually complicated and not effective. However we apply Harris corner detection to determine the location of eye corner point on the basis of coarse location in the eye area and accurate location in the pupil. Because the range of filer is decreasing and the location of eye corner point is limited by the pupil’s location and the size of the eyes after normalization, the location of eye corner point can be located fast and accurately.
2.2.4. Fitting of the eye contour
The method of reversing cubic B-spline curve can be used to fit the eye contour. Let the feature points got from pupil location and eye corner location be the given data point of reversing cubic B-spline curve. Set the top eyelid as an example. Let the given data point beQ ii( =1, 2,,4 ). In
order to find a cubic B-spline curve through the point Q, a group ofP jj( =0, 1, 2,,5 ), polygon vertex of cubic B-spline, which correspond to the points ofQi. P and Q should satisfy the relation of
equation (7).
1 1
(0) ( 4 ) / 6 , 1, 2,
j j j j j
P = P− + P +P+ =Q j= n (7)
There are four equations in equation (6) and (7) unknown number, so two boundary conditions need to be added. The cubic B-spline curve with duplicate control points is used. Therefore, P0 =P1 ,Pn+1=Pn. The linear equation set which is to get
j
P is given by:
0 1 1 1 1 0 6 6
1 4 1
6
1 4 1
6 6 n n n n P Q P Q P Q
P+ +
⋅ ⋅ = ⋅ ⋅ −
The cubic B-spline curve which is consist of ( 0, 1, 2, 5 )
j
P j= , is through the points
ofQ ii( =1, 2,,4 ). Some experimental results are
[image:4.612.90.520.71.215.2]shown in figure 5.
Figure 5: The Result Of Eye Feature Extraction
3. EXPERIMENTAL RESULTS ANALYSIS
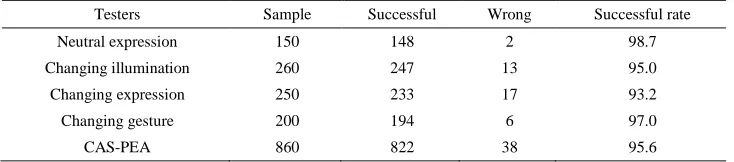
To certify the extraction effect of eye feature, 860 images which are from CAS-PEAL data base are selected as the experimental data. They are including the 150 face images selected randomly in the normal situation, 260 face images under
different illumination which are about 130 people and each one has two images screened under strong and weak light, 50 images about different expressions such as closing the eyes, happiness, anger, sadness, surprise, and 200 face images about different gestures. The experimental results are shown as Table 1.
We can see from Table 1 that the method in this paper has the better robustness and can extract the feature of eye effectively under the condition of strong and weak light. What’s more, it can adjust to different environment. Also regarding the changes of happiness, anger, sadness, surprise, our method is much more adaptable.
4. CONCLUSION
In this paper, a method based on Harris algorithm and changes of threshold to extract eye contour automatically is proposed. This method uses the idea of minimum extremal region. Based on coarse location in the eye area and the idea of minimum extremal region, and using the dynamic change of threshold form low to high, the location of the eye pupil is located accurately by means of natural constrains and similarity analysis and gray statistic. The experimental results show that this method can locate pupils effectively and has the high extraction rate of eye feature under the situation of different illumination, gestures and expressions. However,
with a RGB image, it depends on the boundary of face region. So whether can segment the face region accurately or not will affect the successful rate of eye location and then effect the result of eye feature extraction.
ACKNOWLEDGMENT
The research is supported by the industrial development project of Huaian (HAG09043) and the research content is an important part of the project.
REFERENCES:
[1] Jingfu Ye, Yongzhao Zhan, “Facial Expression Features Extraction Based on Gabor Wavelet Transformation”, Computer Engineering, Beijing, Vol.31, No.15, 2005, pp.172-174. [2] S. Dubussion, F. Devoine, M. Masson, “A
solution for facial expression representation and recognition”, Signal Processing: Image Communication, IEEE Conference Publishing
Table 1: The Results Of Eye Extraction.
Testers Sample Successful Wrong Successful rate
Neutral expression 150 148 2 98.7
Changing illumination 260 247 13 95.0
Changing expression 250 233 17 93.2
Changing gesture 200 194 6 97.0
[image:4.612.124.491.350.431.2][3] S. Keerthi, Lin C J, “Asymptotic behaviors of support vector machines with Gaussian kernel”. Neural Computation, Vol. 15, No. 7, 2003, pp. 1667-1689.
[4] Hua Li, “Research on the image quality evaluation method based on the improved human visual characteristics”, Journal of Convergence Information Technology, AICIT, Vol. 7, No. 18, 2012, pp. 459-467.
[5] Shangbing Gao, Yunyang Yan, “A novel saliency region detection algorithm”,
International Journal of Advancements in Computing Technology, AICIT, Vol. 4, No. 11, 2012, pp. 117-124.
[6] M. Yeasin, B. Bullot, R. Sharma, “Recognition of facial expressions and measurement of levels of interest from video”, IEEE Transactions on Multimedia, Vol. 8, No. 3, 2006, pp. 500-508.
[7] Yang Li, R. Verma, “Multichannel image registration by feature-based information fusion”, IEEE Transactions on Medical Imaging, Vol. 30, No. 3, 2011, pp. 707-720. [8] J. Whitehill, G. Littlewort, I. Fasel, M. Bartlett,
J. Movellan, “Toward practical smile detection”, Pattern Analysis and Machine Intelligence, Vol. 31, No. 11, 2009, pp. 2106-2111.
[9] L. Oliveira, A. L. Koerich, M. Mansano, A. S. Britto, “2D principal component analysis for face and facial-expression recognition”,
Computing in Science and Engineering, Vol. 13, No. 3, 2011, pp.9-13.
[10]I. Kotsia, I. Pitas, I. Pitas, “Facial expression recognition in image sequences using geometric deformation features and support vector machines”, IEEE Transactions on Image Processing, Vol. 16, No. 1, 2007, pp. 172-187.
[11]S. S. Keerthi, C. J. Lin, “Asymptotic behaviors of support vector machines with Gaussian kernel”,
Neural Computation, Vol. 15, No. 7, 2003, pp. 1667-1689.
[12]G. D. Guo, C. R. Dyer, “Learning from examples in the small sample case:face expression recognition”,
![Assessment of Physiological Health Status in Relations to Different Anthropometric and Cardio respiratory Measures of Head Supported Load Carrying Male Porters of Sikkim, India [Article Retracted]](data:image/gif;base64,R0lGODlhAQABAIAAAP///wAAACH5BAEAAAAALAAAAAABAAEAAAICRAEAOw==)