A TEST DATA COMPRESSION SCHEME FOR MINIMIZING
TEST DATA VOLUME AND SCAN POWER
1B. MANJURATHI, 2R. HARIKUMAR, 3K.S. GANESH KUMAR, 4KAREN THANGAM
JACOB
1,3,4
Department of Electrical Sciences Karunya University
Karunya nagar, Coimbatore-641 114, Tamil Nadu, INDIA 2
Department of ECE
Bannari Amman Institute of Technology, Sathyamangalam-638 401, Erode, Tamil Nadu, INDIA. E-mail: 1 [email protected], [email protected], [email protected],
ABSTRACT
Testing a system-on-a-chip (SoC), poses serious issues and challenges owing to the large test data volume and large scan power consumption. To reduce the volume of test data and scan power, several test data compression techniques have been proposed. This paper presents a new test data compression scheme, which simultaneously reduces test data volume and power consumption for the requirement of testing a system-on-a-chip (SoC). The proposed approach is based on the use of Hamming Distance based Reordering, MT (Minimum Transition)-fill technique and Variable Prefix Run-length (VPRL) codes for test data compression. These VPRL codes can efficiently compress the data stream of test patterns, that are composed of both runs of 0s and 1s. Experimental results for ISCAS’89 benchmark circuits supports and proves the proposed approach, better to the other existing techniques, by reducing test data volume and scan power consumption.
Keywords: Hamming distance, MT-Fill, VPRL code, Test data compression, Compression ratio, Average power, Peak power.
1. INTRODUCTION
Advances in VLSI technology have resulted in a change in the design paradigm where complete systems containing millions of transistors are integrated on a single chip. As systems grow in size and complexity, the volume of test data and test scan power also increases rapidly. Power dissipation during a test is also a significant problem, as the size and complexity of system-on-a-chip (SoC) continues to grow [1]. The power dissipation can increase by a factor of 2-3 compared with the functional mode of operation [2]. The Dynamic power dissipation plays a major role in overall test scan power. The Switching activity during test has a large contribution in dynamic power and thereby overall scan power. In stored pattern testing, the test patterns need to be transferred from the automatic test equipment (ATE) to the SOC and then applied to the cores that are being tested[3]. The responses of the cores are compacted and sent back to the ATE for signature analysis. Large test data not only increases the testing time but may also exceed the tester memory capacity [3-7]. The system integrator
Run length-based codes are used for test data compression [8,9,19]. Among these, run length- based codes are used to encode the repeatedly occurring values and is an efficient method for test data compression. The don’t care bit filling methods [10] and test vector reordering [11] further enhances the test data compression. Thus, combining run length- based codes with the Bit filling [10] & reordering techniques [11], not only reduces the switching activity, but becomes efficient in increasing the test data compression.
The rest of the paper is organized as follows: Section 2 presents the different types of test data compression techniques and its effect. Section 3 presents the proposed design algorithm steps. Section 4 presents the decompression architecture. Section 5 presents the power consumption analysis. Experimental results are shown in Section 6 and Conclusions are presented in Section 7.
2. RELATED WORKS
We can Classify the Existing works as Data dependent and Data independent. In the data independent type the decoder or decompression program is suitable for all type of test sets, i.,e it is reusable for any kind of test sets. The Golomb [3,7], FDR [4], EFDR [5,6], ALT-FDR [14], 9C [13], BM [12,15], CEBM [16], ERLC [17] methods belongs to data independent. In the data dependent type the decoder or decompression program is only suitable for specific test sets. The dictionary-based methods, like selective Huffman [20], RL-Huffman [21], LZW [22], LZ77 [23] methods belong to data dependent techniques. The bit filling methods are effective for reducing switching activity and thereby the power. The different types of bit filling methods and their effective results are discussed in [3]. The Golomb [3,7], FDR [4], EFDR [5,6], ALT-FDR [14], CEBM [16], ERLC [17] methods compress the test vectors based on the run-length. The methods Golomb [3,7] and FDR [4] are best suitable for the test vectors having more number of 0 runs, because these methods can compress only the 0 run-lengths in the test set. The EFDR [5,6] code compresses both runs of 0s and 1s, the first bit in the codeword specifying the type of run-lengths. The ALT-FDR [14] code was proposed for both runs of 0s and 1s, wherein a binary parameter, α was used to indicate type of run-length. Here, test vectors starting with both zero run-length and one run-length are suitable for this method. The Block merging (BM) [12,15] technique was proposed to merge the compatible blocks of fixed
length, in the test set. The disadvantage being that it is only suitable for the test vectors having more number of don’t care bits. Using this technique, high compression was achieved by encoding runs of fixed length blocks, in which only the merged block and number of blocks merged, are recorded. The Nine coded (9C) [13] compression technique uses exactly nine code words for compression process and is flexible in using both fixed and variable length blocks. The ERLC [17] technique was proposed to encode the test set having both run of 0’s and 1’s and in this method the repeated codeword is used to denote the other three bit codeword. Its decoder architecture adds one more component, the bit register, to store the repeated run length. The same type of run length in the test sets is difficult to achieve and hence not found to be efficient. The pre-processing techniques hamming distance based reordering (HDR), column wise bit stuffing (CBS), and difference vector (DV) are shown in [11].
Don’t care bit filling is used to fill the X bit in the test patterns. There are different bit filling techniques used to fill the X bit. 0-fill, 1-fill and random fill are the techniques used previously. Later MT- fill and column wise bit filling [10, 11] is used to fill the X bit which reduces the transition. The genetic algorithm based heuristic to fill the don’t cares is proposed in [25]. This approach produces an average percentage improvement in leakage power as well as dynamic power over 0-fill, 1-fill and MT- fill.
3. PROPOSED METHOD
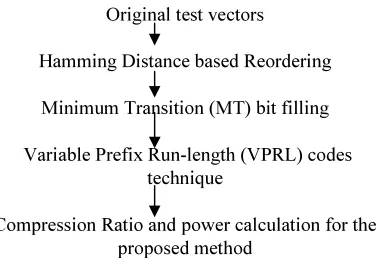
The Proposed technique is the combination of distance based reordering, Bit stuffing and encoding for the original test patterns. The proposed technique flow is shown in figure 1.
Original test vectors
Hamming Distance based Reordering
Minimum Transition (MT) bit filling
Variable Prefix Run-length (VPRL) codes technique
[image:2.595.314.504.574.703.2]Compression Ratio and power calculation for the proposed method
3.1 Selecting the Reference Vector
The First vector in the reordered test set is selected based on the number of don’t care in each test vectors [11]. The number of don’t care bits in each test vectors are calculated. The test vector having the minimum number of don’t care bits is selected as the first vector (reference vector) of the reordered set. For example test vectors: V1= 10XX0X11, V2= 110XX100 and V3= 1XX0X10X. The test vector V2 is taken as first vector in the reorder set because it has minimum number of don’t care bits (number of ‘X’ bits = 2).
3.2 Hamming distance reordering
After choosing the reference vector, the patterns with minimum Hamming distance from the reference vector should be placed as a second reference vector [14]. The distance between two scan frames is equal to the number of corresponding incompatible bits. For example, consider two test frames (F1 = 1 0 1 X 0 1) and (F2 = 0 0 1 X 1 1). The distance d(F1, F2) is 2 because the first and the fifth corresponding bits in the frames are incompatible. Each test pattern is considered as a vertex in a complete undirected graph G and the distance between two patterns will be the weight present between them. The vector which has minimum hamming distance is placed as a second reference vector. This process is repeated to find the consecutive reference vector.
3.3 Minimum Transition (MT)-Fill
A series of X entries in the test vector are filled with the same value as the first non-X entry on the right side of this series [10]. This minimizes the number of transition in the test vector when it is scanned in. For example consider the test vector: 100XX011X11. This vector, after MT-fill [10] , would become 10000011111. If the test vector has a string of X bits that is not terminated by a non-X bit on the right side, then it should be filled by the bit value to the left of the sequence. For example: XX00011XX should be 000001111 after MT-fill.
3.4 Variable Prefix Run-length (VPRL) Code
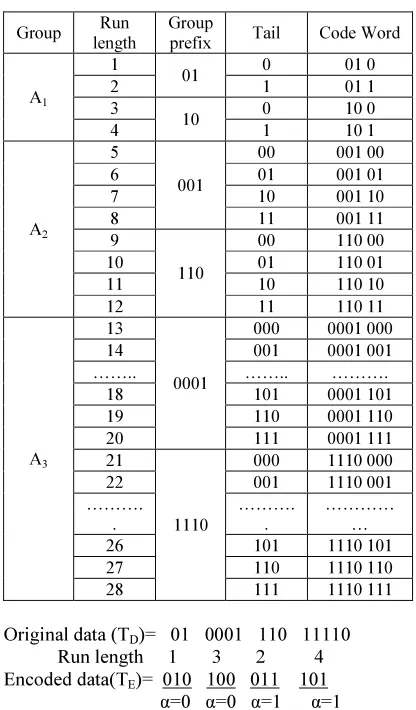
The Variable Prefix Run-length (VPRL) code is a variable-to-variable-length code and it consists of two parts – the group prefix and tail. The group prefix suggests the group to which the run length of either 0’s or 1’s, belong, while the tail further points out to the specific member of the group. The highlight of this technique holds in the simplicity of the coding table, wherein two group prefix are included in each group, the second prefix being the inverted data of 1st prefix in each group [2]. The
first prefix has m 0s ending with 1. Here, the run length is specified by runs of 0s terminating with a 1, or runs of 1s terminating with a 0. For example, 111110 and 110 are the runs of 1s and 000001 and 001 are the runs of 0s. The runs of 1s and 0s are put into groups A1, A2, A3,……….., Am, where k is the longest run length Lmax in the test set. The mth group includes 2m+1 kinds of run length. In other words, group A1 consists of 4 kinds of run length “1, 2, 3, 4”. Group Am is calculated with the following equation [2]:
m = [log2(L+4)-2] (1)
[image:3.595.303.511.298.653.2]Table 1: Variable Prefix Run length (VPRL) code
Group Run
length
Group
prefix Tail Code Word
A1
1
01 0 01 0
2 1 01 1
3
10 0 10 0
4 1 10 1
A2
5
001
00 001 00
6 01 001 01
7 10 001 10
8 11 001 11
9
110
00 110 00
10 01 110 01
11 10 110 10
12 11 110 11
A3
13
0001
000 0001 000
14 001 0001 001
…….. …….. ……….
18 101 0001 101
19 110 0001 110
20 111 0001 111
21
1110
000 1110 000
22 001 1110 001
………. .
………. .
………… …
26 101 1110 101
27 110 1110 110
28 111 1110 111
Original data (TD)= 01 0001 110 11110 Run length 1 3 2 4 Encoded data(TE)= 010 100 011 101 α=0 α=0 α=1 α=1 Figure 2: Example of encoding method of VPRL code.
Unlike FDR, which needs a two-bit codeword “00” for each ‘1’ in the run-length of 1s, in VPRL both runs of 0s and 1s are encoded using the same codeword, with an additional binary parameter α,
is obtained for variable prefix run-length code, compared to Alternating FDR (ALT-FDR) [14] code and other improved codes, as the length of many code words are comparatively smaller in these codes, helping to achieve an improved compression ratio. For example, for runs of 0s “00000001”, the VPRL codeword is “00110”, while the codeword is “110001” for the FDR code [4] and the ALT-FDR code [14], and “0110000” is the codeword for the EFDR code [5,6].Hence, the data volume will decrease much, using VPRL coding , an alternative to the other codes.
3.5 Algorithm for HDR-MT FILL-VPRL code Compression
The HDR-MT FILL-VPRL code is the combination of hamming distance based reordering (HDR) along with minimum transition bit filling (MT-FILL) and VPRL code compression techniques. The Algorithm steps provides the information of the order in how these techniques are combined.
Step 1: The test vectors with minimum number of don’t care bits is selected as the first vector of the reordered test set.
Step 2: If there are more than one vector with minimum don’t care bits, then randomly anyone as the first vector (reference vector) in the reordered test set is selected.
Step 3: The Hamming distance(H.D) of remaining test vectors are calculated from the first vector of reordered test vector.
Step 4: The test vector with minimum Hamming distance(H.D) is selected as next vector in the reordered test set.
Step 5: If there are more than one vector with minimum Hamming distance, then randomly anyone as the next vector (reference vector) in the reordered test set is selected.
Step 6: Step3, Step4 and Step5 is repeated until all the test vectors are reordered.
Step 7: After reordering the test sequences is formed and then the don’t care bits are filled using MT-filling.
Step8: Variable Prefix Run-length (VPRL) code applied to the reordered and MT-filled test set.
Step 9: Compression Ratio (C.R), Average Power and Peak Power values are calculated.
4. Decompression Architecture
Similar to the FDR [4], ALT-FDR [14], ERLC [17] decoder, the compressed data was decompressed on-chip and fed to the circuit under test (CUT). The De-compressor, decompresses the
encoded test set TE and produces the original test set TD. The decompression architecture was simple and it was independent of the pre-computed test set and CUT. The decoder consisted of a finite-state machine (FSM), a (m+1)- bit counter, a log2 (m+1)-bit counter, a T filp-flop and an exclusive OR gate. The Complete decoder architecture is shown in Figure 2.
Figure 2: Decoder Architecture for the VPRL code
Inputs to FSM: The bit-in is the input to FSM and the enable signal, en was used to control the input encoded data when the decoder was ready. rst1 was used to indicate the reset state of the (m+1)-bit counter. While, signal rst2 indicated that the Second counter of log2(m+1)-bit counter has finished counting.
Outputs of FSM: Signal shift was used to control the prefix and tail of the code word to shift into the (m+1)-bit counter. If the prefix started with 0, then it was inverted in the (m+1)-bit counter. Signal dec1 was used for decrement. The log2(m+1)-bit counter was used to count the length of the prefix and tail in order to identify the group in which the run length lies. Signal inc was used to increment the counter and the signal dec2 was used to
Scan_in
FSM
(m+1)-bit counter
Log2(m+1)- bit counter
T filp-flop
clk
α XOR
clk v
en bit_in
out
dec1
rst2 shift
inc
clk rst1
decrement the counter. The FSM’s output signal, out controlled the toggle of the T flip-flop, and indicated that it had finished decoding runs of 0s or 1s before decoding runs of 1s or 0s according to the binary parameter α. Signal v indicated when the output was valid or not.
5. POWER CONSUMPTION ANALYSIS
In this section, we analysis the impact of test set encoding on power consumption during scan testing. For a CMOS circuit, power consumption can be classified two types, Static and Dynamic. Static power consumption, which is caused by leakage current, is usually eliminated. Dynamic power consumption occurs when the output elements switches from logic 0 to 1 or vice versa, which is considered for analysis of power consumption. During testing, the elements in the CUT would switch when the inputs change or when the scan filp flops change value [24]. We used the Weighted transition metric WTM, which was introduced to estimate the power consumption of the scan vectors [24]. The WTM modeled the fact that the scan power for a given vector depended not only on the number of transitions in it but also on the relative positions of the vectors [2]. If vector V1 had more weighted transition than vector V2, then vector V1 was assumed to dissipate more power than vector V2. Next, we considered a scan chain of length l and a scan vector tj=tj,1,tj,2…tk,l,
with tj,1 scanned in before tj,2, and so on. The WTM for tj can be determined by [2]
(2) For a test set TD={t1,t2,….tn}, the average scan-in power Pavg and the peak scan-in power Ppeak can be estimated as follows [2]:
(3)
(4) Where j is the patterns and i is the bit position. Based on the above equation, we know that the key factor for reducing the scan in peak and average power was to reduce the vector’s transition and weight l-i.
6. EXPERIMENTAL RESULTS
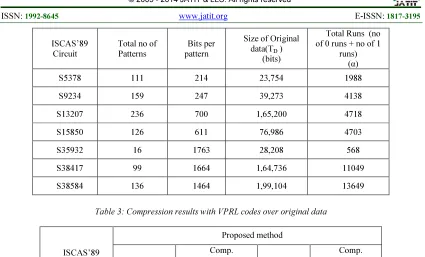
In this section, the proposed test data compression/decompression method for the ISCAS’ 89 benchmark circuits was experimentally evaluated. The ISCAS’89 benchmark circuits test sets are obtained from the Mintest ATPG program. Table 2 shows the test data volume of the benchmark circuits taken into consideration, and gives the analysis of the Total number of runs of 0s and 1s, in each of these test sets. The test set was generated by Mintest and its don’t care bits are mapped according to the Minimum transition fill technique, aiding higher compression and lower power consumption, later.
The Compression Ratio (C.R) was computed as follows [2]:
(5)
Table 3 presents the experimental results of the the compression ratio using the VPRL code, without α (A) and with α (B), over the original data. Here, α indicates the total run-length.
Table 4 projects the Comparison of Compression ratios of proposed method with other test independent Compression techniques, such as the Golomb [3], FDR [4], ALT-FDR [14], EFDR [5], AVR [2], MAVR [26]. It shows that proposed method yields the best Compression ratio compared to other codes.
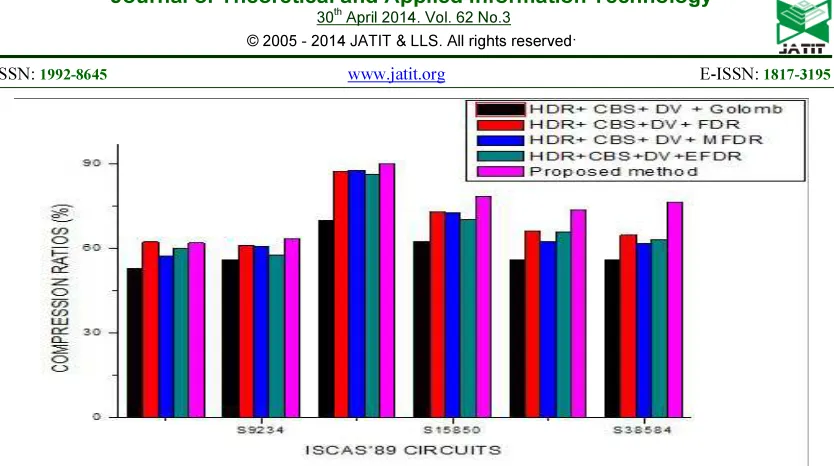
Table 5 and Figure 4 outlines the Compression ratio comparison of various run length based codes Golomb [3, 11], FDR [4, 11],MFDR [11], EFDR [5, 11] with HDR-CBS-DV techniques and it shows the proposed method yields the best Compression ratio compared to others.
Table 6 shows a comparison of the scan-in Peak power of the proposed method with that of the FDR and ALT-FDR codes and it shows the proposed method consumes lesser power. On an average, the Peak power reduction was 77.64% over the original test data volume.
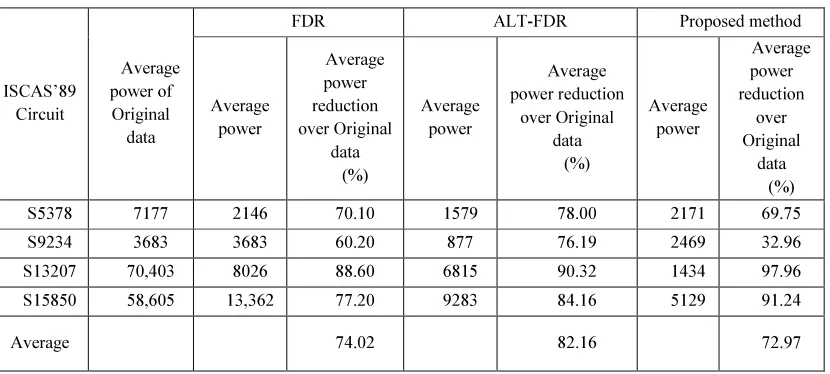
The same comparison was done for scan-in Average power, as shown in Table 7, with that of the FDR and ALT-FDR codes and it again shows the lower power consumption of the proposed method. An Average power reduction of 72.97% over the original test data volume, was obtained.
ISCAS’89 Circuit
Total no of Patterns
Bits per pattern
Size of Original data(TD )
(bits)
Total Runs (no of 0 runs + no of 1
runs) (α)
S5378 111 214 23,754 1988
S9234 159 247 39,273 4138
S13207 236 700 1,65,200 4718
S15850 126 611 76,986 4703
S35932 16 1763 28,208 568
S38417 99 1664 1,64,736 11049
[image:6.595.87.512.99.356.2]S38584 136 1464 1,99,104 13649
Table 3: Compression results with VPRL codes over original data
ISCAS’89 Circuit
Proposed method
VPRL Bits (A)
Comp. Ratio over TD
(%) (A)
VPRL Bits (B)
Comp. Ratio over TD
(%) (B)
S5378 9024 62.01 11,012 53.64
S9234 14,300 63.58 18,438 53.05
S13207 16,466 90.03 21,184 87.17
S15850 16,449 78.63 21,152 72.52
S35932 4110 85.42 4678 83.41
S38417 43,309 73.71 54,358 67.01
[image:6.595.97.505.548.703.2]S38584 46,771 76.50 60,402 69.65
Table 4: Comparison of compression ratios with other techniques over original data
ISCAS’89 Circuit
Golomb
(%) FDR (%)
ALT-FDR (%)
EFDR (%)
AVR (%)
MAVR (%)
Proposed method
S5378 37.11 48.02 50.77 53.67 61.13 62.31 62.01
S9234 45.25 43.59 44.96 48.66 58.93 59.93 63.58
S13207 79.74 81.30 80.23 82.49 85.54 86.44 90.03
S15850 62.82 66.22 65.83 68.66 74.82 77.43 78.63
S38417 28.37 43.26 60.55 62.02 68.63 69.15 73.71
S38584 57.17 60.91 61.13 64.28 71.30 71.90 76.50
Table 5: Compression ratio comparison for various run length based codes with HDR-CBS-DV techniques
ISCAS’89 Circuit
Size of TD (bits)
HDR+ CBS+ DV + Golomb (%)
[11]
HDR+ CBS+DV+
FDR (%) [11]
HDR+ CBS+ DV+ MFDR (%)
[11]
HDR+CBS +DV+EFDR
(%) [11]
Proposed method
S5378 23,754 52.97 62.33 57.26 60.03 62.01
S9234 39,273 56.05 61.06 60.58 57.56 63.58
S13207 1,65,200 70.03 87.47 87.80 86.40 90.03
S15850 76,986 62.55 72.84 72.82 70.43 78.63
S38417 28,208 56.09 66.18 62.46 65.67 73.71
S38584 1,64,736 55.87 64.79 61.83 63.10 76.50
[image:7.595.95.505.322.493.2]Average - 58.52 69.11 67.12 67.19 74.07
Table 6: Comparison of scan-in peak power with other codes over original data
ISCAS’89 Circuit
Peak power of
Original data
FDR ALT-FDR Proposed method
Peak power
Peak power reduction
over Original
data (%)
Peak power
Peak power reduction
over Original
data (%)
Peak power
Peak power reduction
over Original
data (%)
S5378 8661 6546 24.42 6149 29.00 2811 67.54
S9234 11,082 8234 25.70 7646 31.01 3032 72.64
S13207 89,627 66,853 25.41 64,531 28.00 1811 79.79
S15850 65,086 53,162 18.32 41,265 36.60 6110 90.61
Average - - 23.46 - 31.15 - 77.64
Table 7: Comparison of scan-in average power with other codes over original data
ISCAS’89 Circuit
Average power of
Original data
FDR ALT-FDR Proposed method
Average power
Average power reduction over Original
data (%)
Average power
Average power reduction
over Original data
(%)
Average power
Average power reduction
over Original
data (%)
S5378 7177 2146 70.10 1579 78.00 2171 69.75
S9234 3683 3683 60.20 877 76.19 2469 32.96
S13207 70,403 8026 88.60 6815 90.32 1434 97.96
S15850 58,605 13,362 77.20 9283 84.16 5129 91.24
[image:7.595.96.511.519.706.2]Figure 4: Compression ratio comparison for various run length based codes with HDR-CBS-DV techniques
7. Conclusions
Test data Compression is necessary due to the high cost of ATE memory, and the enormous amount of test volume and power consumption. The Proposed method combines Hamming distance based Reordering, Minimum Transition (MT)-fill and VPRL code. This work presented an efficient test data compression method, which simultaneously reduced SoC test data volume, and test power consumption. The Hamming distance based reordering with MT-fill techniques, are used for increasing the run lengths of 0s and 1s,and MT-fill particularly reduces the switching activity which in turn reduces the average and peak power. Experimental results for the ISCAS’89 benchmark circuits shows that the proposed approach decreased test data volume with an average Compression ratio of 74.07% over the Original data Improved test power consumption is also noteworthy, with average Peak and Average power reduction of 77.64% and 72.97%, respectively, over the Original data.
ACKNOWLEDGMENT
We are thankful to prof. Nur A. Tauba and prof U.S. Mehta for providing test sets.
REFERENCES:
[1] J. Lee, N.A Touba, “LFSR-reseeding scheme achieving low-power dissipation during test”,
IEEE Trans. On Computer-Aided Des. Integr.
Circuits and System, Vol. 26, no. 2, 2007, pp.
396-401.
[2] Bo Ye, Qian Zhao, Duo Zhou, Xiaohua Wang, Min Luo, “Test data compression using alternating variable run-length code”, Elsevier,
Integration, the VLSI journal, Vol.44, 2011,
pp. 103-110.
[3] A. Chandra, K. Chakrabarty, “System-on-a-chip Test Data Compression and Decompression Architecture based on Golomb Codes”, IEEE Trans. On Computer-Aided Des.
Integr. Circuits and System, Vol. 20, no. 3,
2001, pp. 355-368.
[4] A. Chandra, K.Chakrabarty, “Test Data Compression and Test Resource Partitioning for System-oc-a-Chip using Frequency-Directed Run-length (FDR) Codes”, IEEE
Trans. Computers, Vol. 52, no. 8, Aug. 2003,
pp. 1076-1088.
[5] A. H. El-Maleh, “Test Data Compression for System-on-a-chip using Extended Frequency-Directed Run-Length Code”, IET Computer
digital Tech., Vol.2, no.3, 2008, pp. 155-163.
[6] M. Y. Wan, Y. Ding, Y. Pan, S. Zhou, X. L. Yan, “Test Data Compression using Extended Frequency-Directed Run Length Code based on Compatibility”, Electronics letters, Vol. 46, no. 6, Mar 2010, pp. 404-405.
[7] Anshuman Chandra, Krishnendu Chakrabarty, “Low-Power Scan Testing and Test Data Compression for System-on-a-Chip”, IEEE Trans. On Computer-Aided Des. Integr.
Circuits and Systems, Vol. 21, no. 5, May
2002, pp. 597-604.
[8] Nur A. Touba, “Survey of Test Vector Compression Techniques”, IEEE Design &
[9] Usha S. Mehta, Kankar S.Dasgupta, and Niranjan M. Devashrayee, “Run-Length-Based Test Data Compression Techniques: How Far from Entropy and Power Bounds?- A Survey”,
Hindawi Publishing Corporation, VLSI
Design, Volume 2010.
[10]K. A. Bhavsar, and U.S. Mehta, “Analysis of Don’t Care Bit Filling Techniques for Optimization of Compression and Scan Power”, International Journal of Computer
Applications, Vol. 18,Mar 2011, pp. 30-34.
[11] Usha S. Mehta, Kankar S. Dasupta, Niranjan M. Devashrayee, “Hamming Distance Based Reordering and Columnwise Bit Stuffing with Difference Vector: A Better Scheme for Test Data Compression with Run Length Based Codes”, In: 23rd International Conference on
VLSI Design, 2010. pp. 33-38.
[12] A. H. El-Maleh, “An Efficient Test Vector Compression Technique Based on Block Merging”, IET Computer Digital Tech., Vol. 2, no. 5, 2008, pp. 327-335.
[13] M. Tehranipoor, M. Nourani, K. Chakrabarty, “Nine-Coded Compression Technique foe Testing Embedded Cores in SoCs”, IEEE Trans. On Very Large Scale Integration(VLSI)
syst., Vol. 13, no. 6, 2005, pp. 719-731.
[14] A. Chandra, K. Chakrabarty, “A Unified Approach to Reduce SoC Test Data Volume, Scan Power and Testing Time”, IEEE Trans. On Computer-Aided Design of Integr. Circuits
and systems, Vol. 22, no. 3, Mar 2003, pp.
352-362.
[15] Tie-Bin Wu, Heng-Zhu Liu, Peng-Xia Liu, “Efficient Test Compression Technique for SoC Based on Block Merging and Eight Coding”, J Electron Test, Vol. 29, no. 6, Dec 2013, pp. 849-859.
[16] Wenfa Zhan, Huaguo Liang, Cuiyan Jiang, Zhengfeng Huang, Aiman El-Maleh, “A Scheme of test data compression based on coding of even bits marking and selective output inversion”, Computers and Electrical
Engineering, Vol. 36, no. 5, Sep.2010, pp.
969-977.
[17] Wenfa Zhan, and Aiman El-Maleh, “A new scheme of test data compression based on equal-run-length coding (ERLC)”, Integration,
the VLSI Jouranal, Vol. 45, no. 1, Jan. 2012
pp. 91-98.
[18] Jia Li, Xiao Liu, Yubin Zhang, Yu Hu, Xiaowei Li, and Qiang Xu, “On Capture Power-Aware Test Data Compression for Scan-Based Testing”, Proceedings of the
International Conference on Comput.-Aided
Designs, 2008, pp. 67-72.
[19] Zainalabedin Navabi. (2011). “Digital System Test and Testable Design Using VHDL Models and Architectures” [online]. Available: http://www.springer.com
[20] A. Jas, J. Ghosh-Dastidar, M.Ng, N.A. Touba, “An Efficient Test Vector Compression Scheme Using Selective Huffman Coding”,
IEEE Trans. On Computer-Aided Design of
Integr. Circuits and systems, Vol. 22, June
2003, pp. 797-805.
[21] M. Nourani, M.H. Tehranipour, “RL-Huffman Encoding for Test Compression and Power Reduction in Scan applications”, ACM Trans. Design Automation of Electronics
systems, Vol. 10, Jan. 2005, pp. 91-115.
[22] M. Knieser, F. Wolff, C. Papachristou, D. Weyer, D. McIntyre, “A Technique for High Ratio LZW Compression”, Proceedings conf. Design Automation Test in Europe (DATE’03),
2003, pp. 116-121.
[23] F. Wolff, C. Papachristou, “Multiscan-Based Test Compression and Hardware Decompression Using LZ77”, Proceedings
Int’l Test conf. (ITC’02), 2002, pp. 331-339.
[24] R. Sankaralingam, R.R Oruganti, N.A Touba, “Static compaction techniques to control scan vector power dissipation”, Proc. IEEE VLSI
Test Sump., 2000, pp. 35-40.
[25]S. Kundu and S. Chattopadhyay, “Efficient don’t care filling for power reduction during testing”, Proceedings of IEEE International
Conference On Advances In Recent
Technologies In Communication And
Computing, 2009, pp. 319–323.
[26]P.R. Sruthi and M.Nirmala devi, “A Modified Scheme for Simultaneous Reduction of Test Data Volume and Testing Power”,
International Symposium, VDAT 2012, 2012,