Simulation of stenosis effect on airflow pattern in
trachea and main bronchi
Z.M.Salleh
1, N.H.Johari
2, K.Osman
3, J.Haron
4, M.Rafiq
31 Faculty of Mechanical and Manufacturing Engineering,
Universiti Tun Hussein Onn Malaysia, 86400 Batu Pahat,Johor
Malaysia
E-mail : [email protected]
2 Faculty of Mechanical Engineering
Universiti Malaysia Pahang 26600 Pekan, Pahang
Malaysia
3Faculty of Mechanical Engineering
Universiti Teknologi Malaysia, 81310 Skudai, Johor, Malaysia
4 Department of Radiology
Hospital Universiti Sains Malaysia, 16150 Kubang Kerian
Kelantan, Malaysia
Abstract—Tracheal stenosis is a condition where the diameter size of trachea wall decreases and leads to the obstruction of the breathing airflow. Investigation on the effect of the stenosis to the airflow pattern in the trachea and main bronchi is the objective for this study. CT-scan images of two airways models were modeled, one with the stenosis and one without. Numerical solution was used to study the airway pattern inside the airway. Different boundary conditions of inspirations flow rate were applied; 15 l/min, 60 l/min and 100l/min where the ratio for the right main bronchus is 55% and for the left main bronchus is 45%. The results showed that the pressure drop inside the stenosis model is higher compared to that of healthy model. The pressure drop was also shown to interrupt the inlet condition into the main bronchi.
Keywords- Trachea, main bronchi, CT-scan images, simplified model and respiratory system.
I. INTRODUCTION
Knowledge about airflow in human airways was known as the alternative source that helps in treatment for the breathing patients. The treatment for the respiration disease usually in the form of aerosol that delivered into the lung and the efficiency of the treatment is depends on the percentage of the drug particle received by the lung.
Tracheal stenosis is one of the tracheal symptoms that obstruct the airways path and lead to breathing difficulties. Thus, present study aims to explore the flow dynamics inside the actual abnormal trachea which are
suffering of stenosis. Ideally, the flow pattern would be different and inconsistent compared to healthy trachea.
The very straight way to understand the airflow characteristics are to study its pressure drop and velocity field along the trachea-bronchial region. Numerous numerical studies of inhaled airflow and particle transport modeling have been performed until now. Schroter and Sudlow [1] initiated the earliest study of airflow inside the human lung. Their experimental study of single symmetric bifurcation and flow was at Reynolds numbers ranging from 50 to 4500 concluded that the inhale flows were independent on either Reynolds number and entry velocity profiles. It was followed by other studies which address varieties of airflow and particle deposition problems in selected segment at bifurcation, main bronchi and lower generations [2-6]. They have shown that simulation of airflow and particle transport at different bronchi’s generation with different boundary conditions resulting significant changes of velocity and pressure drop which influenced the breathing cycle. However, all the research named above was used simplified model of human lung due to the limitation of applications. Their findings and conclusions were initiated this present study to go deeper on investigation of air flow dynamics patterns in actual human lung model.
made the earliest study of Computational Fluid Dynamics (CFD) simulations within model of stenosis trachea. They initiated a study of flow dynamics inside a few sizes of stenosis and found that pressure drop dramatically increased due to the constriction of trachea airways and concluded that the pressure drop can be detected at early stage of stenosis. Although Mark Brouns et al. simulated airflow inside a few conditions of model geometry and boundary condition, the results produced still can be argued. It is because the model used have smooth wall, no rings protrusions effect, and only shows flow pattern until centre of trachea. We believed that the actual wall conditions, shapes, angle of bending, bifurcation of main bronchi and all the boundary conditions are a priority in analyzing the effect of stenosis on air flow inside trachea.
In this study, two actual models of trachea are used; with and without the stenosis. The flow pattern in healthy trachea is benchmark to the stenosis trachea. Dimensionless techniques were used along the way of analyzing the result.
II. METHODOLOGY A. The model geometry
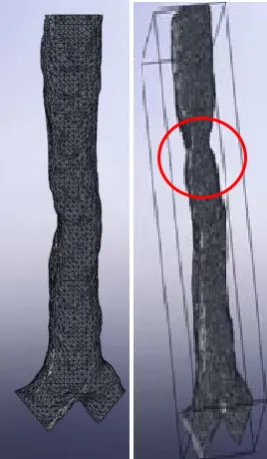
[image:2.595.114.248.442.672.2]The complexity of the actual airway geometry is essential in improving the efficiency of simulation airflow to capture the velocity distribution and pressure drop. For this study, two models with different geometry conditions were utilized for comparison purpose (figure 1).
Figure 1: The extracted actual model of trachea and main bronchi from CT images. Healthy model (left) and abnormal trachea with constriction of stenosis model (right).
The models were reconstructed from the Computed Tomography (CT) scan images by using modeling software before being exported into Computational Fluid software for simulation of airflow. The images of the reconstructed model of human airways consists of trachea and main bronchi were taken from an Asian, 60 years old male as for stenosis model and the stenosis area for the same model then been removed to used as the healthy model. Smoothing of the surface was performed on the model to eliminate the roughness of the curves caused by partial volume effects and pixilation of rounded images [8]. The model provides an anatomically realistic model of human airways.
B. Boundary conditions
Beside the model geometry, boundary conditions are another factor that needs to be looked while studying the airflow [2]. Laminar flow does not occur in human lung airways except in very small airways deep down into the lung at resting condition [9]. The airflow from larynx to third generation is transitional-to-turbulent even at a low local Reynolds number. The turbulence may be induced again at the central zone due to flow instabilities generated by the great geometric transition at the carinal ridges which may complicate flow structures [10] have shown that the turbulent influenced the particle deposition. Higher particle deposition was recorded for turbulent flow over laminar flow [11]. Thus, the turbulence generated by the larynx need to be taken into account. K-epsilon model is appropriate to simulate internal laminar-transitional-turbulent flow. The actual model wall was assumed as smooth and rigid wall along the airways. In the actual trachea, the wall actually covers by cilia and normally lined up with mucus which tends to make it smooth. It is also have the cartilage rings to support the trachea.
Table I: Parameters at both trachea different breathing conditions.
Parameter Incomp
Flow rate (l/min) 15,60 and Inlet Pressure 101325 P
Density 1.225 kg/m
Viscosity 1.7894e-0
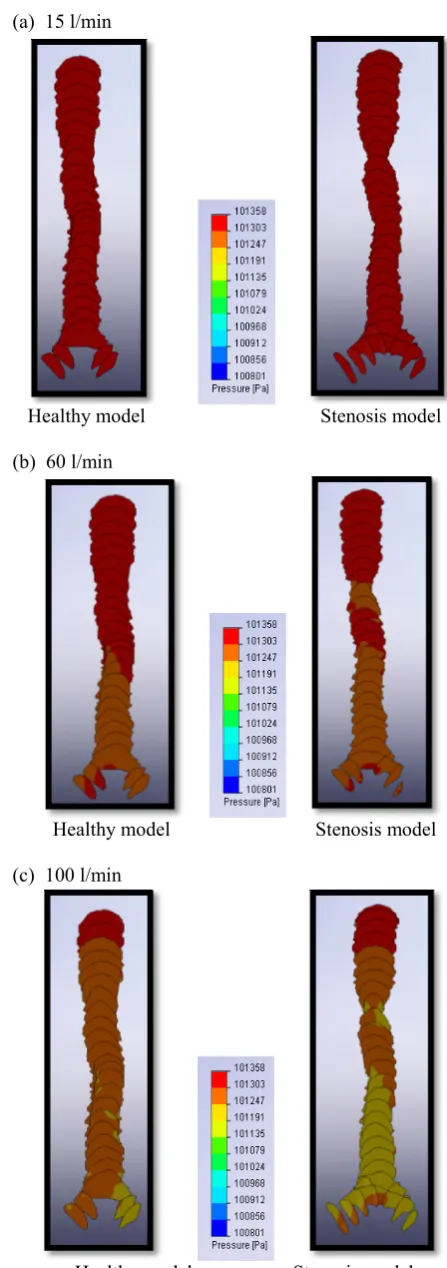
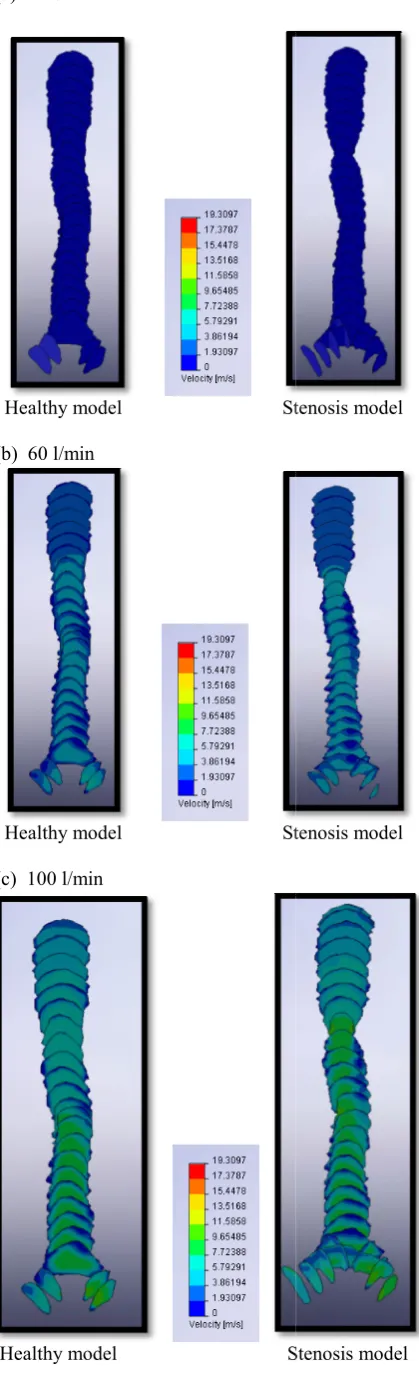
III. RESULTANDDISCU A. Pressure and velocity contours
The velocity and the pressure conto trachea and the main bronchi are show Figure 3. Both contours are almost healthy and stenosis models for the res l/min). There are no significant pr velocity different throughout the tr bronchi for both models. The contou different between both models when s l/min and 100 l/min flow rates.
From the Figure 2 (b) and Figure 2 the pressure drop is higher in the especially at the area after the stenosi difference became more significant w increases as shown. The differences obstruction and reduce sizes of the trach stenosis and it affected the flow from m the main bronchi. The flow that reach the main bronchi also effected when rates were applied into both model.
Then again, for the velocity contour, differences in contour when applying 100 l/min boundary conditions. The c uniform throughout the trachea and ma healthy model compared to the stenos stenosis model, the velocity flow hap when reach the obstruction and star before it became uneven. But the locati itself is far enough for the velocity to r profile before reach the bifurcation area
model for three
pressible flow d 100
a
m3
05 kg/ms-1
USSION
our throughout the wn in Figure 2 and similar for both sting flow rate (15 ressure drop and rachea and main urs begin to show
imulated using 60
(c), it shows that e stenotic model
s is located. The when the flow rate s are due to the hea diameter at the moving smoothly to es to each side of the different flow
it started to show the 60 l/min and contours are more ain bronchi for the sis model. For the pening to distract rting to speed up
ion of the stenosis eform the uniform a.
(a) 15 l/min
Healthy model
(b) 60 l/min
Healthy model
(c) 100 l/min
Healthy model
Figure 2: Simulated pressure c main bronchi in healthy and st flow rates. (a) 15 l/min, (b) 60 l
Stenosis model
Stenosis model
Stenosis model
(a) 15 l/min
Healthy model St
(b) 60 l/min
Healthy model St
(c) 100 l/min
Healthy model S
tenosis model
tenosis model
[image:4.595.67.277.80.770.2]Stenosis model
Figure 3: Simulated velocity c bronchus in healthy and stenos rates. (a) 15 l/min, (b) 60 l/min
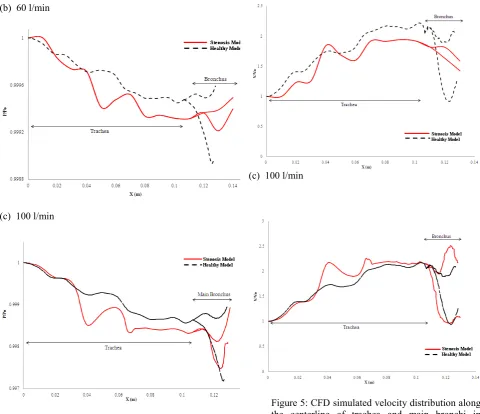
B. Pressure and velocity distrib
Figure 4 and Figure 5 show velocity distributions along the stenosis models at different flow
In general, the pressure dr model is much higher than that happens due to the contraction effect the pressure distribution overall pattern of the pressur model still having the same pa except at the stenotic area pressure value take place. It is applied for each model.
With reference to velocity di for both model showing the velocity in the stenosis mo especially when reach the sten flow rate (15 l/min), there are n the healthy and stenosis mode different when the flow rate inc Overall, due to the location o at the beginning of the trachea the bifurcation area, the pr distribution did not effected t much and the flow still reac content condition.
(a) 15 l/min
contour in the trachea and sis models at different flow
and (c) 100 l/min
butions
the simulated pressure and e centerline of healthy and
w rates.
rop occur in the stenosis t in the healthy model. It is n at the stenosis area that n along the airways. The re distribution in stenosis attern as the healthy model
where the large drop of shown at every flow rates
istribution plots, the pattern same pattern except the del having higher spped nosis area. For the resting not significant gap between el and it started to have a creases.
of the stenosis that located a which is far enough from ressure and the velocity the flow characteristic too
[image:4.595.307.551.474.669.2](b) 60 l/min
[image:5.595.57.538.69.483.2](c) 100 l/min
Figure 4: CFD simulated pressure drop along the centerline of trachea and main bronchi in healthy and stenosis models at different flow rates. (a) 15 l/min, (b) 60 l/min and (c) 100 l/min
(a) 15 l/min
(b) 60 l/min
(c) 100 l/min
Figure 5: CFD simulated velocity distribution along the centerline of trachea and main bronchi in healthy and stenosis models at different flow rates. (a) 15 l/min, (b) 60 l/min and (c) 100 l/min
IVCONCLUSION
Stenosis inside the trachea did affect the flow characteristic for human airways. The results show that the flow pattern will become more non-uniform when the flow rates apply increases. The results also show that the stenosis affect the flow in the trachea as well as the inlet flow condition into the main bronchi.
REFERENCES
[1] Schroter, R.C., Sudlow, M.F., 1969. “Flow patterns in model of the human bronchial airways”. Respiratory Physiol.J. 7, 341–355 [2] Natalya Nowak, Prashant P.Kakade and Ananth V.Annapragada,
“Computatioal fluid dynamics simulation of airflow and aerosol deposition in Human Lung”, Annals Biomedical Engineering Vol.31,pp.374-390,2003
[image:5.595.58.298.557.743.2][4] Balashazy, I., T.Heistracher and W.Hofman, “Airflow and particle deposition patterns in bronchial airways bifurcation, J.Aerosol Med. 9:287-301,1996
[5] Zhang, Z., and C.Kleinster, “Effect of particle inlet distributions on deposition in a triple bifurcation lung airway model; Edwards, D.A. “Numerical simulation of air and particle transport in the conducting airways, J. Aerosol Med.9:303-316;1996
[6] I.M. Katz and T.B Martonen, “Flow patterns in 3D laryngeal model, Journal Aerosol Medicine,9, 501-511 (1996)
[7] Mark Brouns .M,Jayaraju, S.T. Lacor C., Mey JD, Noppen M, Vincken, W.Verbanck, “Tracheal stenosis”, A Flow Dynamics Study, Journal Applied Physiology 2006
[8] Thomas A. Spirka, Jerry G. Myers, Randolph M. Setser, Sandra S. Halliburton, Richar D. White, George P. Chatzimavroudis. “Construction of a computational non-planar curved tube models
from MRI data”. IEEE IST 2005. International Workshop on Imaging Systems and Techniques.
[9] R.K.Calay,Jutarat Kurujareon and Arne Erik Holdo, “Numerical simulation of respiratory flow patterns within human lung, Respiratory Physiology & Neurobiology 130 (2002) 201-221 [10] Zhang, Z. and Kleinstreuer, C. (2004). Airflow structures and
nano particle deposition in a human upper airway model. Journal of Computational Physics, 198, 178-210
[11] J. Russo, R. Robinson, Michael J. Oldham (2008), Effects of cartilage rings on airflow and particle”, Journal of Medical [12] Luo, X. Y., Hinton, J. S., Liew, T. T., Tan, K. K., LES modelling
of flow in a simple airway model, Medical Engineering & Physics 26 (2004) 403–413