Spectral, Modal and Coherence Analysis of Sum and Difference
Scattering of Narrowband Noise in Turbomachinery
Ian Davis
∗and Gareth J. Bennett
†Trinity College, Dublin 2, Ireland
April 26, 2015
ABSTRACT
The phenomenon of sum and difference frequency scattering of narrowband noise as it interacts with ducted rotating turbomachinery is studied experimentally in this article. This phenomenon will affect the spectral and modal distribution of the noise downstream of rotating turbomachinery, which must be considered in order to optimise any acoustic mitigation methods installed inside the engine. In the experimental set-up, narrowband noise is generated by a loudspeaker located at the upstream end of the test duct which then propagates through a rotor stage. A microphone array located downstream of the rotor is used to examine the spectral and modal distribution of the acoustic pressure field at a single axial location. The results from this analysis are compared with pre-existing theory which had not previously been experimentally validated in the literature. This theory may be used to predict the modal content of the scattered noise. A coherence analysis is also presented using microphones upstream and downstream of the rotor stage in order to assess whether sum and difference scattering is best predicted by a linear or non-linear model. The results from this study serve to enhance our current understanding of sum and difference scattering of narrowband noise through turbomachinery stages, and highlight interesting results from this interaction such as potential overlapping of incident and scattered noise which may otherwise be overlooked.
1
INTRODUCTION
As the airline industry continues to grow, the noise emitted from aircraft has been a growing concern with regards to noise pollution, which has been reflected in E.U. directives on aircraft noise such as directive 2002/30/EC. Historically, jet noise has been the focus of most investigation[1]. Such research has lead to the implementation of high bypass-ratio engine types, chevrons at the jet nozzle, and a clearer understanding of the mixing mechanism of the hot jet exhaust (core), bypass stream (fan), and ambient air have all resulted in a significant reduction in this noise. Core noise refers to the noise emanating from the unsteady heat release of the combustion process, as well as the individual rotor-stator stages of the turbines, and indirect combustion noise generated by the rapid acceleration of entropy inhomogeneities from the combustor through the turbine stages. As jet noise has decreased, the focus has begun to shift to the contribution of core noise radiated from aircraft engines. Core noise consists of both tonal and broadband noise. Core noise is the
dominant noise source in engines which generate little or no jet noise, such as turboshaft enginese.g.helicopter
engines. Recent EU funded projects such as Friendcopter[2],TEENI[3] (TurboshaftEngineExhaustNoise
Identification) andRECORD[4] (Research onCore NoiseReduction) have focused on the characterisation
and hence strategic reduction of core noise emanating from the turboshaft engines used in helicopters. Core
∗Ph.D. Candidate, Dept. of Mechanical and Manufacturing Engineering, Trinity College, Dublin 2, Ireland. Now a Member
of Technical Staff at Bell Labs Ireland.
noise is also a significant contributor to the noise radiated from turbofan engines during the approach and taxiing of aircraft, when jet velocities are low.
Rotor-stator BPF tones propagating downstream in an aeroengine will interact with the rotating blades and stationary stators of the various stages of turbomachinery. This interaction can result in scattering of noise at sum and difference frequencies with respect to the incident noise. Crucially, this scattering has been demonstrated in recent literature to occur not only for tonal noise from a rotor/combustor, but also narrowband (band-limited broadband) noise[5]. This phenomenon may explain some of the low-frequency acoustic energy found in far-field measurements which cannot be associated with any specific noise-source
within the engine, as energy from upstream noise-sources (e.g. direct combustor noise) could be scattered
in frequency[6]. It may also be possible for the high-frequency turbine broadband noise to be scattered to lower frequencies, perhaps contributing to the broadband noise observed at low frequencies. This is a concern for studies considering aeroengine noise which aim to characterise the broadband noise emanating from engine exhausts, as some low-frequency noise may not be attributed to a specific core noise-source within the engine using traditional coherence-based methods. Low frequency noise is also attenuated less by atmospheric absorption, and therefore propagates long distances more effectively[7]. The possibility of sum and difference scattering affecting the far-field spectral distribution of acoustic energy in this way would have a significant impact on environmental noise considerations of aeroengine design.
Sum and difference scattering of noise may also present an issue when applying noise-source identification techniques, which make the assumption of a linear propagation path between source and receiver. Sum and difference scattering has previously been suggested as being a non-linear interaction between the downstream propagating noise and rotating turbomachinery[5, 8]. Frequency scattering will furthermore have an impact on the effectiveness of any installed acoustic liners, as noise may be scattered outside the frequency range for which the liner design is effective. Previous analytical theory also suggests that the modal content of the noise at any scattered frequencies will also be affected by the scattered noise[9]. This will further reduce the effectiveness of any liners if they have not been optimised for the acoustic modes excited by the scattered noise. Furthermore, any liners installed upstream of any turbine stages at which scattering occurs will not mitigate the scattered noise. If the scattering mechanism is well understood however it may be possible to eliminate the factors which cause such scattering to occur, therefore eliminating the need for passive or active mitigation methods.
The experimental investigation undertaken in this article will focus on quantifying both the sound pressure level spectra of scattered narrowband noise across a range of test frequencies in a circular duct, and examining these results in order to draw conclusions on whether or not the onset of noise scattering is well predicted by the theory outlined in Section 2.1. In order to allow a deeper investigation of the effect of noise scattering on the acoustic pressure field within the test duct, an azimuthal modal analysis is also performed downstream of a rotor stage. An overview of the modal analysis method used may be found in Section 3. Details on the experimental set-up are presented in Section 4. The possibility of spectral overlapping between wider-band noise and scattered noise will also be discussed. Finally, the linear and non-linear coherence analysis methods outlined in Section 2.2 are applied to measurements upstream and downstream of a rotating rotor where scattering is predicted to occur, in order to offer further insight into the underlying mechanism which causes this scattering of noise.
2
THEORY OF SUM AND DIFFERENCE SCATTERING OF
NOISE IN TURBOMACHINERY
2.1
Mechanism of Interaction Between Incident Noise and Rotating
Turboma-chinery
A literature review of the field of frequency scattering through rotating stages of turbomachinery is presented in this section. Further details on other types of scattering (such as modal scattering of noise, without frequency scattering) may be found elsewhere[26].
be present at sum and difference frequencies relative to the blade-pass frequency tone and its harmonics. Possible sources of this modulation include blade vibration, rotor speed fluctuation, variations in boundary layer thickness with position and/or time, irregularly positioned blades, blade-to-blade variations in tip clearances or stagger angle, and rotating intake distortions. It is this last point which is of interest for this current study. Barry and Moore consider the interaction of a particular intake distortion, which rotates with a steady circumferential speed, with a rotating rotor. This produces noise at frequencies of:
fscatt=f+qfBP F (1)
wheref is the frequency of the intake distortion,qis a non-zero integer denoting the scattering harmonic and
fBP F is the blade-pass frequency of the rotor. The modal content at each scattered frequency is predicted
as being
mscatt=m+qB (2)
where q is again the scattering harmonic, B is the number of rotor blades and m is any azimuthal mode
carrying energy by the incident noise. This assumes that there is little or no irregularity between blade
forces and the interaction results in scattered noise with a supersonic phase velocityi.e.mscatt is cut-on at
the scattered frequency. If the incident noise was a downstream-travelling rotor BPF tone generated by an
upstream rotor-stator,mwill be restricted to Tyler-Sofrin[11] predicted values.
Cumpsty[9] observed that when two rotor stages are present, as in a compressor for instance, tonal noise is apparent at sum and differences frequencies of the rotor blade-pass frequencies in downstream spectral measurements. Cumpsty studied this effect of frequency scattering by considering the variation of the
time-domain acoustic pressure with respect to the circumferential coordinate, θ. Radial and axial effects were
omitted. The author considered first a rotor withB1 blades rotating at an angular velocity Ω1 interacting
with an inflow distortion of the form cos(miθ). This inflow distortion is in the form of an azimuthal mode of
ordermi, which spins as it propagates in the axial-direction. It was shown that rotor acoustic modes took
the form:
p(θ, t) =am1exp(i(m1θ−h1B1Ω1t)) (3)
wherem1=n1B1−mi andh1is the rotor blade-pass harmonic.
The author then demonstrates how, if this scattered pressure field were to propagate downstream and
through a second rotor stage havingB2 blades rotating at Ω2, the pressure pattern generated by the blades
of this second rotor will be given by:
p(θ, t) =B2amexp(i[mθ−(h1B1Ω1±h2B2Ω2)t+ Φm]) (4)
where the values formare restricted tom=±h2B2+m1=±h2B2+h1B1−mi.
Holste and Neise[12] also discuss the interaction case of two rotors and the subsequent scattered modes and frequencies, and made the same conclusions regarding predicted scattering frequencies and mode orders.
Enghardtet al.[13] expanded for the case of two rotors and two stators, and suggested that scattering would
occur and be measured at frequencies:
fscatt =h1fBP F,1+qfBP F,2 (5)
with the modal content at each scattered frequency given by:
mscatt=h1B1±qB2−k1V1−k2V2 (6)
where h1 and fBP F,1 are the blade-pass harmonic and blade-pass frequency of the upstream rotor, q is a
non-zero integer denoting the scattering harmonic, fBP F,2 is the blade-pass frequency of the downstream
rotor,B andV are the number of blades and vanes at each rotor-stator stage and bothk1and k2 can take
any integer value. The±value in the modal scattering equation will be positive if the rotors are rotating in
2.2
Non-Linearity of Sum and Difference Scattering
Bennett and Fitzpatrick[5] undertook an investigation into the application of coherence-based noise-source identification techniques for the identification of combustion noise through a ducted system. Typically, the underlying assumption made with these identification techniques is that the propagation path from source
(e.g. combustor can) to receiver is linear. The authors considered non-linearities which may arise which
would cause these techniques to fail to correctly attribute noise at a receiver location to its corresponding
noise source. Siller et al. [16] noted a drop in coherence between acoustic pressure measurements at a
combustor can and measurements at the exit plane of an aero-engine when the rotational speed of the rotor was increased. An interpretation of this result is that, as jet noise is low, combustion noise is a significant contributor to noise in the near field. As jet noise is increased, however, the relative contribution of the combustor is low and hence the coherence drops. This interpretation assumed a linear frequency response function between the combustor can and the exit plane of the engine. If there were non-linearities present, however, this could also explain the relative drop in coherence observed at higher rotor speeds.
The authors considered the case where noise propagates through a rotating turbine stage in an aeroengine. Such a pressure pattern could be tonal noise, such as that generated at the BPF of a second turbine located upstream of the turbine of interest, or narrowband (band-limited broadband) noise generated at a combustor upstream of the turbine of interest. The authors considered the possibility of interactions between the downstream propagating noise and the turbine, and that additional inputs to the system as shown in
Figure 1, due to non-linearities, could cause the drop in coherence as measured by Siller et al.[16]. In a
[image:4.612.168.454.388.505.2]non-linear system, a drop in coherence may occur when there is no change in the power of the linear noise sources. Without non-linear analysis the conclusion could be made that core noise is less significant than it is in reality, and hence be ignored in the development of acoustical treatment. It was demonstrated by the authors using basic trigonometric identities how quadratic interactions result in a doubling of frequency from self-interaction, and sum and difference frequencies from combination interactions.
Figure 1: Frequency response function between the combustion noise and the pressure measured at the exit plane when some rpm dependent non-linearity is included in the model (from Bennett and Fitzpatrick[5]).
Having proposed a non-linear interaction that could arise when downstream-going noise propagates through a rotor stage, the authors showed that energy scattered into sum and difference frequencies would not be identified using classical ordinary coherence-based techniques. They highlighted this by generat-ing synthetic data representgenerat-ing a non-linear interaction between combustor noise and fan noise, as shown conceptually in Figure 2. The upstream measurement shown in Figure 2(a) measures the incident noise only coming from the combustor. Downstream of the fan, the incident noise measurement shown in Figure 2(b) will contain contribution of the combustor and the fan, as well as the additional noise caused by the interaction of the combustor and fan.
Figure 2: Incident pressure models accommodating a quadratic non-linear term (from Bennett and Fitzpatrick[5]).
of the output could be isolated by taking the ordinary coherence between the square of the input and the output.
A further consideration was then made by the authors to enhance non-linear coherence-based
identifica-tion by condiidentifica-tioning out the linear effects between signalsi andj, assuming that iand j are composed of
at least two components each, one of which is the correlated linear effectr. Using the technique of Rice and
Fitzpatrick[17], the partial coherence function between the two signals with the linear effectsrremoved can
be isolated. This technique uses the partial coherence function, given by:
γij2·r= |Gij·r|
2
Gii·rGjj·r
(7)
where
Gij·r=Gij−
GirGrj
Grr
(8)
and
Gii·r=Gii−
|Gri|2
Grr
(9)
which provides the input conditioned on the square of the input,i.e.the linear contribution.
Figure 3: Inputs into upstream and downstream measurements modelled showing linear and non-linear parts (from Bennett and Fitzpatrick[5]).
This technique for identifying non-linear interaction was further enhanced by Bennett et al. [18] who
proposed the enhanced non-linear coherence technique. From analysis of the expansion ofx3(t) it was found
that multiples of the same correlated terms appear which are also present in the expansion of x2(t). The
proposal for an enhanced non-linear coherence technique was to condition thex3(t) contribution fromx2(t)
to removed these partially-coherent terms. As the expansion of x4(t) contains further terms not included
in thex2(t) term, it was proposed that the partial coherence function was applied to conditionx4(t) from
x3(t), and then conditioning this result fromx2(t).
Besides analytical tests, the non-linear coherence analysis method was applied to full-scale engine data during the SILENCE(R)[19] project. The high quadratic coherences measured in these tests validated that the quadratic model could be applied to predict sum and difference scattering.
3
MODAL ANALYSIS TECHNIQUES
[image:5.612.204.412.433.489.2]ˆ
p(x, r, θ) = ∞
X
m=−∞ ∞
X
n=0
[A+m,ne−jk+m,nx+A−
m,ne
−jk−m,nx]f
m,n(r)ejmθ (10)
where A+
m,n and A−m,n are the complex modal amplitudes, k+m,n andkm,n− are the axial wavenumbers, and
m and n are the azimuthal and radial mode indices respectively. The + and − superscripts refer to the
direction relative to the flow, with the convention that positive is in the direction of the mean flow. Each acoustic mode describes a specific way in which noise can propagate in the duct. For the case of a hard-walled acoustic boundary condition, an orthogonal eigensystem is formed, with a modal shape factor described by
fm,n(r).
In many experimental investigations of the acoustics of ducted systems, such as in an aeroengine, the fre-quency range of interest commonly extends above the cut-on frefre-quency of many of these higher order acoustic modes. Knowledge of the constituent modal amplitudes for each cut-on mode is useful for determining the propagation process of sound in the duct, and can also be used to help identify the relative contributions of noise sources in the duct to this propagating noise. Certain sources of noise, such as the periodic interaction
between rotor-stator stages, have specific modal content associated with them i.e. the dominant acoustic
modes at these periodic frequencies can be predicted analytically. Several studies have also used acoustic modal theory to study rotor noise[20, 21], compressor noise[13] and combustor noise[22, 23].
Holste and Neise[12] used rakes of sensors to determine the modal content radiated from a counter-rotating propfan engine. A sensor rake located at a single axial location contains several microphones spaced radially. Data is acquired, and then the rake is traversed azimuthally. Data is then acquired at this new azimuthal location. This process is repeated for a full revolution of the sensor rake, and the azimuthal modal content of the pressure field at this axial location is resolved by:
ˆ
p(r, θ, x, ω) = ∞
X
m=−∞
Am(x, r, ω)ejmθ (11)
This is a reformulation of Equation 10, where the complex circumferential mode distribution is shown in isolation. By repeating the sensor rake measurements at several radial locations, it is further possible to discriminate on radial mode order in the modal analysis. Two main limitations of sensor rake measurements are noted. Firstly, such measurements are invasive in nature, as the sensor rakes interfere with the flow through the duct causing probe contamination in any results. Secondly, the non-synchronous nature of the measurements means that the identified modal amplitudes cannot be used in any correlation-based techniques.
˚
Abom[24] introduced a novel method of modal decomposition which uses the transfer function between pairs of microphones, provided the duct eigenfunctions and eigenvalues are known. Unlike previous modal
decomposition techniques in the literature at the time, ˚Abom’s proposed technique does not requirea priori
assumptions on the signal type present in the duct. Furthermore, this modal decomposition technique allows the content of the modes travelling in both axial directions to be found – hence allowing both the incident and reflected modal content to be identified.
Bennett[25] employed the modal decomposition technique of ˚Abom for a test set-up where an array of
microphones is mounted flush to the inside duct wall. The sensors in this array are equally spaced azimuthally and axially and all measurements are made simultaneously. From the formulation of the acoustic pressure in a hard-walled duct given by Equation 10, this modal decomposition technique is undertaken in two stages. In the first stage an azimuthal decomposition is carried out using microphones located circumferentially around the duct as follows:
k= 0,1....2N−1
pl,k= M−1
X
m=1−M
hm,ke[jmθl] where l= 0,1, ....2M −2 (12)
θl=
2πl
wherepl,k is a complex, frequency-domain acoustic pressure measurement,m is the index of the azimuthal
mode being analysed, M is the maximum azimuthal mode index to be analysed,N is the maximum radial
mode index to be analysed, andk andlare the radial and azimuthal location indices. Using this technique
it is possible to asses the azimuthal modal content at a given axial location in the duct using an array of wall-mounted, circumferentially-spaced acoustic pressure sensors, however it is not possible to separate out the incident and reflected modal content. In order to seperate out the incident and reflected components as well as the specific radial modal content, this technique can be repeated at multiple axial locations.
4
EXPERIMENTAL RIG
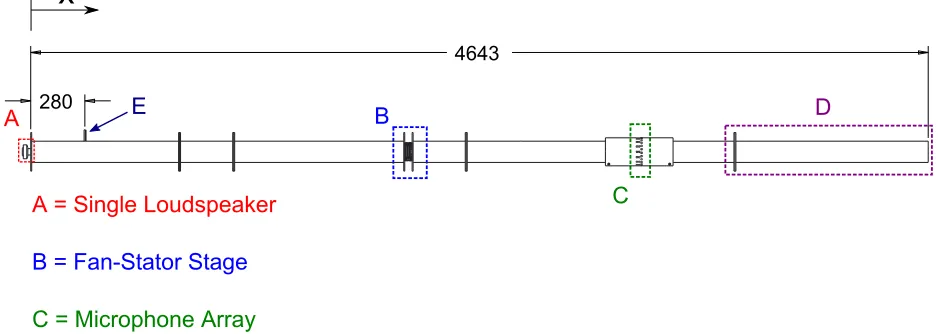
In order to investigate scattering of narrowband noise, narrowband source signals were used to drive a single loudspeaker located at one end of a circular duct. The schematic of this experimental rig is shown in Figure
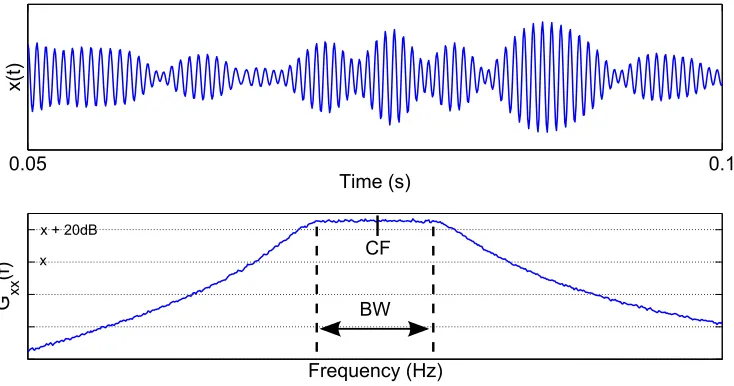
4, and the duct inner diameter is 0.1m. An example of a narrowband noise source signal is shown in Figure
5 in both its time- and frequency-domain representations. These source signals were generated by band-pass filtering stochastic broadband noise. Both the centre frequency (CF) and frequency bandwidth (BW) of the source signals were changed between tests.
E
B
C
D
A2=2Single2Loudspeaker
B2=2Fan-Stator2Stage
C2=2Microphone2Array
D2=2Semi-Anechoic2Termination
E2=2Source2Microphone
2804643
[image:7.612.71.540.291.458.2]A
x
Figure 4: Experimental rig used to investigate frequency and modal scattering at sum and difference frequencies. All dimension inmm.
The rotor-stator stage used in these experiments consists of a five-bladed axial fan adjacent to an
eight-vane stator (EBM-PAPST 3214 JH4). When the rotor rotates, a flow is induced in the positivex-direction.
The stator is located downstream of the fan. For all results discussed in this study where the rotor is
spinning, the rotor rotates at 13000rpm. This corresponds to a rotor blade-pass frequency (BPF) of 1083Hz
and an axial mean flow of Mach numberMx= 0.036. A single BMS 4540ND loudspeaker has been placed
at the entrance plane to the duct, located adjacent to the upstream open end (x=−0.1). The speaker does
not block the flow at the duct inlet.
Modal analysis at frequencies of interest was performed using an array of 25 wall-flush-mounted micro-phones distributed circumferentially at a single axial location in the test duct. This allows an azimuthal
modal anlysis to be performed up to the cut-on of the m=±12 azimuthal modes. A single ring of
micro-phones was used to maximize the frequency range of modal analysis for the available number of micromicro-phones, with the trade-off that the specific contributions of incident and reflected noise to the total modal amplitudes
0.05 0.1 Time (s)
x(t)
Frequency (Hz)
G xx
(f)
BW x + 20dB
[image:8.612.124.491.71.264.2]x CF
Figure 5: Time-domain representation (top) and auto-spectral density estimate (bottom) of a nar-rowband source signal of bandwidth BW and centre frequency CF. This signal was generated at a clock frequency of 44100Hz.
greatly reduces acoustic reflections at this end of the duct. This was demonstrated in an experimental study where two rings of twelve microphones were used to analyse the incident and reflected modes when a single
loudspeaker (located at x= 0) excites broadband noise in the duct. The modal reflection coefficients at
x = L are shown for the m = 0,1,−1 modes in Figure 6, with the open-ended results also plotted for
reference. Further details of this experimental study, as well as further results at additional higher-order modes, may be found elsewhere[26].
A single microphone was also located close to the loudspeaker to obtain a source measurement for the coherence analyses presented in Section 5.4, with the microphones in the sensor array used as outputs.
The results presented in this article focus on both the sound pressure level spectra from single microphone measurements as well as the acoustic modes decomposed at the microphone array. These measurements were recorded for three test cases:
• Case one: the fan is rotating;
• Case two: the loudspeaker generates narrowband noise;
• Case three: both the fan is rotating and the loudspeaker generates narrowband noise.
By comparing the results analysed for each of these three test cases, quantitaive assesments on the contribution of any scattered noise to the microphone and modal sound pressure levels downstream of the rotor stage may be made.
In order to draw clear relationships between the incident and scattered modes, it is beneficial to have a single azimuthal mode dominant at the source noise frequencies. It was found that narrowband noise
generated by a single loudspeaker at the upstream end will propagate in the duct with the m = 0 mode
Open−Ended S.A.T at x=L
2 3 4 5 6 7
0 0.2 0.4 0.6 0.8
1 m = 0
kR
|R|
2 3 4 5 6 7
0 0.2 0.4 0.6 0.8
1 m = 1
kR
|R|
2 3 4 5 6 7
0 0.2 0.4 0.6 0.8
1 m = −1
kR
[image:9.612.82.538.70.387.2]|R|
Figure 6: Reflection coefficients of azimuthal modes estimated using two rings of twelve microphones, plotted against Helmholtz number. Broadband noise has been generated by a loudspeaker located at x= 0, with and without the semi-anechoic termination (S.A.T.) at the downstream end (x=L).
1500 2000 2500
40 50 60 70 80
Frequency (Hz)
SPL (dB)
2500 3000 3500
40 50 60 70 80
Frequency (Hz)
SPL (dB)
3500 4000 4500
40 50 60 70 80
Frequency (Hz)
SPL (dB)
4500 5000 5500
40 50 60 70 80
Frequency (Hz)
SPL (dB)
5500 6000 6500
40 50 60 70 80
Frequency (Hz)
SPL (dB)
6500 7000 7500
40 50 60 70 80
Frequency (Hz)
SPL (dB)
[image:9.612.109.505.455.664.2]5
EXPERIMENTAL RESULTS AND DISCUSSION
Data was acquired at all microphones at a sampling rate of 26kHzfor 40 seconds for each test point, allowing
spectral analyses to be performed up to a frequency of 13kHz. Azimuthal modal analyses could be performed
using the microphone array up to the cut-on of the (12,0) mode, which occurs at a frequency higher than the Nyquist frequency for the sampling rate used. Data was analysed using 252 blocks of time-domain data in
an ensemble, each containing 4096 data points. This gives a frequency resolution of 6.34Hzin any spectral
estimates.
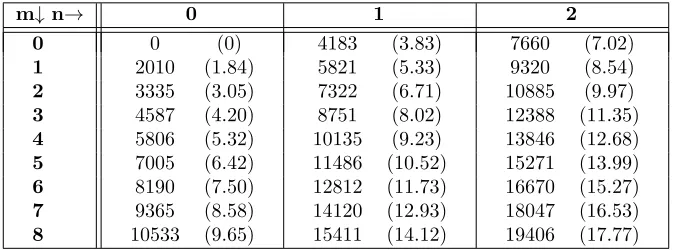
[image:10.612.138.475.253.378.2]The modal cut-on frequencies at standard values for temperature and pressure are shown in Table 1 for the test duct diameter. These cut-on frequencies are shown in terms of both the dimensionless Helmholtz number and Hertz.
Table 1: Cut-on frequencies in Hz (with the correspondingkR values in brackets) of acoustic modes for a R = 0.05m circular duct, assuming standard conditions for temperature and pressure and zero mean-flow.
m↓n→ 0 1 2
0 0 (0) 4183 (3.83) 7660 (7.02)
1 2010 (1.84) 5821 (5.33) 9320 (8.54)
2 3335 (3.05) 7322 (6.71) 10885 (9.97)
3 4587 (4.20) 8751 (8.02) 12388 (11.35)
4 5806 (5.32) 10135 (9.23) 13846 (12.68)
5 7005 (6.42) 11486 (10.52) 15271 (13.99)
6 8190 (7.50) 12812 (11.73) 16670 (15.27)
7 9365 (8.58) 14120 (12.93) 18047 (16.53)
8 10533 (9.65) 15411 (14.12) 19406 (17.77)
5.1
Single Microphone Spectral Analysis
Sound pressure level measurements when narrowband noise of bandwidth 200Hz is generated are shown in
Figures 8 and 9 for a range of test centre frequencies. Each row of subplots show the spectra recorded for different test frequencies. Each column of plots centres on specific frequency ranges of interest, with the incident narrowband noise shown on the left and three potential scattering frequencies shown to the right.
The black broken-line lines show the sound pressure level spectra measured when the rotor is rotating (case one). The gray solid-line plots show the sound pressure level spectra measured when the loudspeaker
generates narrowband noise (case two) in the frequency range NBN with a centre frequency CF and a
bandwidthBW. The black solid-line plots show the sound pressure level spectra measured when both the
loudspeaker generates noise and the rotor is rotating (case three). The vertical black dashed lines are plotted at the frequency of interest plus or minus the bandwidth of the narrowband signal. This is effectively double
the bandwidth of the source signal (200Hz). As the figures demonstrate, the roll-off of the narrowband
speaker noise to the fan noise floor extends the bandwidth of the narrowband noise significantly from the targeted bandwidth.
Any noise measured for case three which is not present in cases one or two will have been generated by the interaction between the rotor and the incident narrowband noise. Test frequencies were selected where
the m = 0 mode dominantes the incident narrowband noise generated by the loudspeaker, as in the test
results shown in Figure 7.
For frequency scattering to occur atN BN+ (q×BP F), the azimuthal mode orders of the scattered noise,
as caused by the interaction of the speaker noise and the rotating fan, are predicted by the theory discussed in Section 2.1 as:
mscatt=m−qB (13)
where the integer q denotes the scattering harmonic which can take positive or negative non-zero integer
1200 1400 1600 1800 2000 2200 2400 2600 2800 60 70 80 90 100 110 Incident Noise
CF = 2000 Hz
200 400 600 800 1000 1200 1400 1600 60 70 80 90 100 110
CF − (1
× BPF) 2400 2600 2800 3000 3200 3400 3600 3800 60 70 80 90 100 110
CF + (1
× BPF) 3400 3600 3800 4000 4200 4400 4600 4800 5000 60 70 80 90 100 110
CF + (2
× BPF) 2200 2400 2600 2800 3000 3200 3400 3600 3800 60 70 80 90 100
110 CF = 3000 Hz
1200 1400 1600 1800 2000 2200 2400 2600 60 70 80 90 100 110 3400 3600 3800 4000 4200 4400 4600 4800 60 70 80 90 100 110 4400 4600 4800 5000 5200 5400 5600 5800 6000 60 70 80 90 100 110 3200 3400 3600 3800 4000 4200 4400 4600 4800 60 70 80 90 100
110 CF = 4000 Hz
2200 2400 2600 2800 3000 3200 3400 3600 60 70 80 90 100 110 4400 4600 4800 5000 5200 5400 5600 5800 60 70 80 90 100 110 5400 5600 5800 6000 6200 6400 6600 6800 7000 60 70 80 90 100 110 3600 3800 4000 4200 4400 4600 4800 5000 5200 60 70 80 90 100
110 CF = 4400 Hz
5600 5800 6000 6200 6400 6600 6800 7000 7200 60 70 80 90 100 110 Incident Noise
CF = 6400 Hz
4600 4800 5000 5200 5400 5600 5800 6000 60 70 80 90 100 110
CF − (1
× BPF) 6800 7000 7200 7400 7600 7800 8000 8200 60 70 80 90 100 110
CF + (1
× BPF) 7800 8000 8200 8400 8600 8800 9000 9200 9400 60 70 80 90 100 110
CF + (2
× BPF) 6200 6400 6600 6800 7000 7200 7400 7600 7800 60 70 80 90 100
110 CF = 7000 Hz
5200 5400 5600 5800 6000 6200 6400 6600 60 70 80 90 100 110 7400 7600 7800 8000 8200 8400 8600 8800 60 70 80 90 100 110 8400 8600 8800 9000 9200 9400 9600 9800 10000 60 70 80 90 100 110 7000 7200 7400 7600 7800 8000 8200 8400 8600 60 70 80 90 100
110 CF = 7800 Hz
Table 2: Scattered modes predicted as per Equation 14, with them= 0mode dominant at the incident tone. B= 5, V = 8.
Scattered Mode Order (mscatt) Cut-On Frequency ofmscatt(Hz)
q k=−2 k=−1 k= 0 k= 1 k= 2 q k=−2 k=−1 k= 0 k= 1 k= 2
-1 -11 -3 5 13 21 -1 14004 4587 7005 16299 25390
1 -21 -13 -5 3 11 1 25390 16299 7005 4587 14004
2 -26 -18 -10 -2 6 2 31027 21993 12851 3335 8190
analysis undertaken herein takes clockwise rotating modes as being positive. As a stator is present, this
equation is modified by a stator scattering term, as factored into the analysis by Enghardt et al.[13]. The
scattered modal content of an incident mode due to the presence of a rotating fan and stationary stator is therefore predicted to be:
mscatt=m−(qB−kV) (14)
Focusing first on the specific scattering harmonic of q = 1, the noise scattered at the corresponding
frequency ofN BN+ (1×BP F) is shown in the third column of plots shown in Figures 8 and 9. For the case
studied herein, the incident noise propagates with them= 0 mode dominanting, and this noise propagates
through and interacts with a five-blade rotor and an eight-vane stator. Equation 14 predicts in this case
that the scattered noise will be dominated by them= 3 andm=−5 modes whenq= 1. These azimuthal
modes have cut-on frequencies of 4620Hzand 7020Hzrespectively (the modal cut-ons are increased slightly
from the values in Table 1 by the presence of a mean flow).
The experimental results show that scattering is indeed observed above the cut-on frequency of the
m= 3 mode, and the magnitude of the scattered noise increases with increasing CF. A significantly large
increase in the magnitude of this scattered noise is also observed whenN BN+ (1×BP F) is above 7000Hz,
corresponding closely to the cut-on of them=−5 mode. These results would seem to verify that the theory
used to formulate Equation 14 may be used to predict the onset of sum and difference frequency scattering of narrowband noise, at least for this scattering harmonic. The critical frequency above which scattering occurs may be predicted by the cut-on frequency of the lowest mode order predicted by Equation 14. This
is demonstrated for other scattering harmonics as well; for q = 2, shown in the fourth column of plots, a
significant increase in the level of scattered noise is observed at frequencies above approximately 8000Hz.
The cut-on frequency of them= 6 mode, one of the scattered modes predicted by theory, occurs at 8190Hz.
These results would strongly suggest that the same rules governing the scattering of tonal noise, as validated elsewhere[14], are maintained for scattering of noise over a broader spectral range. Interestingly, any interaction noise generated at sum and difference frequencies has approximately the same spectral shape as the incident noise.
5.2
Modal Analysis at Incident and Scattered Frequencies
In Figures 8 – 9, spectral results were presented for a single microphone measuring the narrowband noise at both scattered and incident frequencies for a range of narrowband centre frequencies. Figures 10 – 11 present the azimuthal modal analyses for the test points shown in Figures 8 and 9 where narrowband noise
was generated with a bandwidth of 200Hz. Rather than simply plotting the absolute sound pressure levels
of each azimuthal mode, the difference in the measured sound pressure levels of each mode between cases
one and three are plotted instead. This relative sound pressure level will be referred to as the ∆SP L of each
mode, as applied in the analysis of the scattering of tonal noise in companion papers[14, 15]. This quantity isolates the contribution of the noise generated by the interaction of the rotor-stator and the incident noise
to the azimuthal modal amplitudes at the scattered frequenciesN BN+ (q×BP F).
Equation 14 predicts that the m = 0 mode will be scattered into infinite modes (as k can take any
Figures 10 and 11 show the ∆SP L amplitudes of the azimuthal acoustic modes in a format similar to
Figures 8 and 9. These results further validate the conclusions made in Section 5.1, with significant scattering occurring into the modes predicted by Equation 14. The scattered modes predicted by this equation are shown with solid-black and dotted-gray lines and are also labelled, and all other modes are shown with dashed-gray lines. These results demonstrate that scattering is strongest into modes predicted by Equation
14 fork= 0.
5.3
Spectral Overlapping of Incident and Scattered Noise
The narrowband scattering results presented thus far have focused on the sound pressure levels of the acoustic modes at both the incident and scattered frequencies, and the relationships between these acoustic modes. The bandwidths of the narrowband signals used to excite the loudspeakers were smaller than half the rotor BPF, and therefore no overlapping of the noise at incident and scattered frequencies was observed. The possibility of such overlapping is interesting, as the acoustic pressure field in the overlapping frequency range could contain contributions of both the incident and scattered noise. As sum and difference scattering is a result of a quadratic interaction between the incident noise and the rotating rotor, this also raises the possibility that the coherence observed between acoustic measurements made upstream and downstream of the rotor could drop in this overlapping frequency range, due to the addition of a non-linear contribution to the system equation between both input and output measurements.
In Figure 12a), the sound pressure levels from a single microphone in the sensor array are presented for three test points: the rotor rotating at 13000rpm, the loudspeaker generating narrowband noise of bandwith
1600Hzcentred at 7000Hz, and a third test with the previous two noise-sources both present. Focusing on
theq= 1 scattering harmonic, it is clear in this figure that noise at a frequency range ofN BN+ (1×BP F) is
being scattered into the spectral range of the incident noise, as evident by the increase in the sound pressure levels in the overlapping region between A and B when both rotor and loudspeaker are present. In order to isolate the contribution of this sum scattering to the total noise for this test point, the sound pressure levels of the rotor only and loudspeaker only tests were summed (in Pascals), and the difference in sound pressure level between this summation and the sound pressure levels measured when both noise-sources are present simultaneously is then measured. This measurement, which isolates the contribution of sum and difference interaction to the total noise measured when both noise-sources are present, is shown in Figure 12b). This
more clearly demonstrates that significant noise is scattered at frequenciesN BN+ (1×BP F) which overlaps
with the incident noise, increasing the sound pressure levels by around 5dB in this frequency range. The
spikey nature of this spectra is a result of periodic rotor noise which has modulated slightly between tests due to small variations in rotor rotational speed with time.
An azimuthal modal analysis of this scattered noise is presented in Figure 13. As in the narrower
bandwidth studies when them= 0 modes are dominant at the incident noise frequencies, them=−5 and
m= 3 modes dominate the scattered noise for theq= 1 scattered harmonic. Figure 14 verifies that them= 0
mode dominates the incident noise in this test case. These two results demonstrate that the overlap region between the incident and scattered noise will contain contributions from both the acoustic modes excited by the incident noise and the scattered noise. This is an interesting test case, as it illustrates that broader-band noise could be scattered and hence overlap spectrally downstream of rotating turbomachinery, with both the incident noise and the noise produced by the sum and difference scattering mechanism described in this study contributing to the total noise at overlapping frequencies. This may not be anticipated in the design of acoustic liners at the engine inlet and outlet.
5.4
Coherence Analysis of Incident and Scattered Noise
The analysis of narrowband noise scattering in this article has so far been limited to sound pressure level spectra of both microphone and acoustic modal measurements. As discussed in Section 2.2, it has previously been suggested that scattering of noise can be modelled by a quadratic interaction between the downstream-propagating noise and the rotating rotor. Sum and difference frequency scattering could arise, for example, as a result of the following quadratic trigonometric identity:
The presence of such a quadratic non-linear interaction occurring at a rotor stage can be identified using
the non-linear coherence function[18], defined asγ2
1600 1700 1800 1900 2000 2100 2200 2300 0 10 20 30 40 Incident Noise
CF = 2000 Hz
m = 0
600 700 800 900 1000 1100 1200 1300 0 10 20 30 40
CF − (1
× BPF) 2700 2800 2900 3000 3100 3200 3300 3400 0 10 20 30 40
CF + (1
× BPF) 3800 3900 4000 4100 4200 4300 4400 4500 0 10 20 30 40
CF + (2
× BPF) 2600 2700 2800 2900 3000 3100 3200 3300 0 10 20 30 40 Incident Noise
CF = 3000 Hz
m = 0
1600 1700 1800 1900 2000 2100 2200 2300 0 10 20 30 40
CF − (1
× BPF) 3700 3800 3900 4000 4100 4200 4300 4400 0 10 20 30 40
CF + (1
× BPF) 4800 4900 5000 5100 5200 5300 5400 5500 0 10 20 30 40
CF + (2
× BPF) 3600 3700 3800 3900 4000 4100 4200 4300 0 10 20 30 40 Incident Noise
CF = 4000 Hz
m = 0
2600 2700 2800 2900 3000 3100 3200 3300 0 10 20 30 40
CF − (1
× BPF) 4700 4800 4900 5000 5100 5200 5300 5400 0 10 20 30 40
CF + (1
×BPF
)
m = 3
5800 5900 6000 6100 6200 6300 6400 6500 0 10 20 30 40
CF + (2
×BPF
) m = -2
4000 4100 4200 4300 4400 4500 4600 4700 0 10 20 30 40 Incident Noise
CF = 4400 Hz
m = 0
3000 3100 3200 3300 3400 3500 3600 3700 0 10 20 30 40
CF − (1
× BPF) 5100 5200 5300 5400 5500 5600 5700 5800 0 10 20 30 40 CF + (1 ×B P F)
m = 3
6200 6300 6400 6500 6600 6700 6800 6900 0 10 20 30 40 CF + (2 ×B P F)
m = -2
6000 6100 6200 6300 6400 6500 6600 6700 6800 0 10 20 30 40 Incident Noise
CF = 6400 Hz
m = 0
5000 5100 5200 5300 5400 5500 5600 5700 0 10 20 30 40
CF − (1
×BPF
) m = -3
7100 7200 7300 7400 7500 7600 7700 7800 0 10 20 30 40
CF + (1
×BPF
)
m = -5
m = 3
8200 8300 8400 8500 8600 8700 8800 8900 0 10 20 30 40
CF + (2
×BPF
)
m = -2
m = 6
6700 6800 6900 7000 7100 7200 7300 7400 0 10 20 30 40 Incident Noise
CF = 7000 Hz
m = 0
5600 5700 5800 5900 6000 6100 6200 6300 0 10 20 30 40
CF − (1
×BPF
)
m = -3
7700 7800 7900 8000 8100 8200 8300 8400 0 10 20 30 40
CF + (1
×BPF
)
m = -5
m = 3
8800 8900 9000 9100 9200 9300 9400 9500 0 10 20 30 40
CF + (2
×BPF
)
m = -2
m = 6
7500 7600 7700 7800 7900 8000 8100 8200 0 10 20 30 40 Incident Noise
CF = 7800 Hz
m = 0
6400 6500 6600 6700 6800 6900 7000 7100 0 10 20 30 40
CF − (1
×BPF
) m = -3
8500 8600 8700 8800 8900 9000 9100 9200 0 10 20 30 40
CF + (1
×BPF
)
m = -5
m = 3
9600 9700 9800 9900 10000 10100 10200 10300 0 10 20 30 40
CF + (2
×BPF
)
m = -2
m = 6
4 5 6 7 8 9 10 60
70 80 90 100 110
Frequency (kHz)
SPL (dB)
NBN Only Fan Only NBN and Fan A
B
(a) Sound pressure levels measured at a single-microphone for three test points
4 5 6 7 8 9 10
0 5 10 15
Frequency (kHz)
∆
SPL
(d
B)
A
B
[image:17.612.73.503.74.245.2](b) Sound pressure levels of the scattered noise shown in sub-figure a) conditioned of the contribution of rotor noise and the inci-dent narrowband noise generated by the loud-speaker.
Figure 12: Sound pressure levels measured by a single microphone for a series of narrowband noise scattering tests, CF = 7000Hz, BW = 1600Hz. Bandwidth A indicates the bandwidth of the incident noise, bandwidth B indicates the bandwidth of the scattered noise centred at a frequency of CF+
(1×BP F).
4 5 6 7 8 9 10
0 5 10 15
Frequency (kHz)
∆
SPL
(d
B)
m = -5
m = 3
A
B
Figure 13: Sound pressure levels of the azimuthal modes of the scattered noise isolated in Figure 12(a).
downstream of the rotor stage. In order to demonstrate how the quadratic coherence function allows the presence of quadratic interaction to be identified, we first consider the noise measured by an upstream sensor which measures incident and reflected noise:
x=N BN+BP F + (N BN+BP F)2 (15)
where NBN is the upstream noise (generated by the loudspeaker in this experimental investigation) and BPF is the blade-pass frequency of the rotor. Expanding the square of this input (as per Figure 3):
((N BN+BP F) + (N BN+BP F)2)2=N BN2+ 2(N BN×BP F) +BP F2+ 6(N BN2×BP F) + 6(N BN×BP F2)
+4(N BN3×BP F) + 6(N BN2×BP F2) + 4(N BN×BP F3) + 2N BN3+ 2×BP F3+N BN4+BP F4
[image:17.612.142.471.319.499.2]4 5 6 7 8 9 10 0
10 20 30 40 50 60
Frequency (kHz)
∆
SPL
(d
B)
A
[image:18.612.145.470.120.299.2]B
m = 0
Figure 14: Difference between the modal sound pressure levels measured when the the loudspeaker is the only noise-source and the modal sound pressure levels measured when the rotor is the only noise-source.
f
1+ BPF
f
1- BPF
Noise from
Upstream
Noise-Source
Rotor BPF
ω
1= 2πf
1=
Angular frequency of upstream
tonal noise
ω
2= 2πf
2=
Angular frequency of rotor BPF
[image:18.612.76.536.426.633.2]The quadratic contribution to the total input measurement (underlined) is maintained in this expansion. However, the linear terms are removed. Therefore taking the ordinary coherence between the square of the
input (x2(t)) and some output (y(t)) will identify the quadratic component of the output measurement.
This technique has been applied in previous experimental tests[5, 8] to estimate both linear and quadratic
coherence functions between upstream (input,x) and downstream (output,y) measurements. These
experi-mental results showed very low measurements of the linear coherence and relatively high non-linear coherence at sum and difference scattered frequencies, which would confirm the hypothesis that such scattering is in-deed the result of a quadratic interaction. Further enhanced linear and non-linear coherence function were formulated using partial coherence methods, in order to condition out the influence of non-quadratic higher-order terms from the quadratic coherences. Enhanced linear coherence functions were also tested, which condition quadratic and other higher-order terms from the linear coherence measurements. These partial coherence formulations were discussed further in Section 2.2.
The possibility of sum and difference scattering being caused by a non-linear interaction is of interest, as such a violation of the assumption of a linear propagation path from source to receiver will reduce the effec-tiveness of coherence-based methods of noise-source identification. By adding non-linear effects to the system equation between two measurements, the measured ordinary coherence will drop, even if the contribution of linear effects to this system equation is unchanged[5]. It is therefore prudent to investigate coherence measurements further using the current experimental rig, which allows more detailed and accurate causal conclusions to be obtained from coherence measurements due to the reduced reflections at the downstream end of the test duct.
For this coherence investigation, most signal processing parameters were maintained from the results discussed in Sections 5.1 – 5.3, however the data acquisition time for each test case was increased to 120 seconds. This increases the number of time-domain blocks in the averaging ensemble to 761. The number of blocks was increased in order to increase the accuracy of any coherence function estimates by reduction of the associated mean error, which is dependent on the number of averaging blocks used.
The sound pressure level spectra measured by a single microphone in the sensor array for three test cases is shown in Figure 16. In the “NBN Only” case, narrowband noise has been generated by the loudspeaker,
centred at 6400Hzwith a bandwidth of 200Hz. In the “Rotor Alone” case, the rotor rotates at 13000rpm. In
the “NBN and Rotor” case, both the rotor rotates and the speaker generates narrowband noise. A significant amount of noise has been scattered into each of the three scattering frequencies displayed in this figure. It therefore presents an interesting test case in order to investigate the linear and quadratic coherence measured between the source microphone and a microphone in the sensor array.
The ordinary coherence estimated between the source microphone (as the input x, shown with label E
in Figure 4) and a microphone in the sensor array (as the output y) is plotted in Figure 17. The linear
coherences conditioned by the square and third power of the input are also plotted in this figure. The
measured ordinary coherence is high (≈1) for most frequencies for the incident noise, and remains high
when conditioned by the higher powers of the input. The dips in the coherence match dips in the sound pressure level spectra in Figure 16. This demonstrates that the frequency response function, describing the propagation path from source (loudspeaker) to receiver (output microphone), is linear for the incident noise. At the three scattered frequency ranges shown in Figure 17, the ordinary coherence drops significantly
when compared with the incident noise, peaking at levels of≈0.5. Unlike the incident noise, the coherence at
the scattered frequencies drops significantly when conditioned of the square of the input, and further again when additionally conditioned of the third power of the input.
Figure 18 shows the quadratic coherence estimated between the source and output microphone measure-ments, as well as the quadratic coherence conditioned of the third power of the input. In both estimates, the quadratic coherence is very low at the incident noise frequencies, further demonstrating that the propagation path at the incident noise frequency range between the speaker source and output receiver is linear. The quadratic coherences estimated at all scattered frequency ranges are far higher however, generally of the
order of 0.5 but peaking at a value of almost 1 at the scattered frequencyN BN+ (2×BP F). The quadratic
coherence remains high when conditioned by the third power of the input.
6000 6250 6500 6750 55
70 85 100
Incident Noise
NBN Only
Rotor Only
NBN and Rotor
4750 5000 5250 5500 5750
55 70 85 100
CF − (1
×
BPF)
7000 7250 7500 7750 8000
55 70 85 100
CF + (1
×
BPF)
8250 8500 8750 9000
55 70 85 100
[image:20.612.75.540.95.325.2]CF + (2
×
BPF)
Figure 16: Spectra of narrowband noise (SPL (dB) against Frequency (Hz)) centred at the incident noise at 6400Hz (top left) and three possible scattering frequencies.
6000 6250 6500 6750
0 0.25 0.5 0.75 1
Incident Noise
γ2xy
γ2xy⋅(x2
)
γ2
xy⋅(x2x3)
4750 5000 5250 5500 5750
0 0.25 0.5 0.75 1
CF − (1
×
BPF)
7000 7250 7500 7750 8000
0 0.25 0.5 0.75 1
CF + (1
×
BPF)
8250 8500 8750 9000
0 0.25 0.5 0.75 1
CF + (2
×
BPF)
[image:20.612.75.540.414.665.2]6000 6250 6500 6750 0
0.25 0.5 0.75 1
Incident Noise
γ2
x2y
γ2
x2y⋅x3
4750 5000 5250 5500 5750
0 0.25 0.5 0.75 1
CF − (1
×
BPF)
7000 7250 7500 7750 8000
0 0.25 0.5 0.75 1
CF + (1
×
BPF)
8250 8500 8750 9000
0 0.25 0.5 0.75 1
[image:21.612.73.541.70.320.2]CF + (2
×
BPF)
Figure 18: Quadratic coherence estimated between measurements made upstream (x) and downstream (y) of the rotor plotted against frequency for the “NBN and Rotor” test case shown in Figure 16.
strongly suggest that the scattering mechanism is quadratic in nature, however significant linear coherences are also observed. These results would suggest that sum and difference scattering is caused by a combination of both quadratic and linear interactions between the incident noise and the rotating rotor. The observed
linear coherence is also higher than was observed in the results discussed in Bennettet al.[8].
In Figure 15, an interaction model was outlined (as originally proposed by Bennett and Fitzpatrick[5]) which shows how a quadratic interaction between the rotor/fan and the incident noise cause the frequency scattering observed in this section. Although the coherence analysis performed herein would suggest that this model is accurate, the model itself does not describe the physics of the scattering mechanism. Further-more, the previously published analytical studies discussed in Section 2 accurately predict frequency and modal scattering behaviour using simple linear kinematic theory. The significant amount of linear coherence observed at scattered frequencies in the preceding experimental study is also not explained by the quadratic scattering model.
An alternative interaction mechanism which could lead to sum and difference scattering of noise is the presence of a time-varying boundary condition. A possible model demonstrating this is shown below:
Acos(ω1t) +Bcos(ω2t) = A
2[cos(ω1−ω2)t+ cos(ω1+ω2)t] +Bcos(ω2t) (17)
where ω1 is the frequency/frequencies of the incident noise, ω2 is the fan BPF, and A = Acos(ω2t) i.e.
the amplitude of the incident noise is time-varying and linked to the rotor rotational speed. While this time-varying boundary condition model does not explain the high quadratic coherence levels observed in the experimental results presented in this sub-section, it does demonstrate that a linear interaction model with a time-varying boundary condition will also predict sum and difference frequency scattering.
6
CONCLUSIONS
In this experimental study, noise was generated by the speaker upstream of the rotor, which then propagated through and interacted with the rotating rotor. The resulting noise propagating downstream of the rotor was measured by an array of microphones located at a single axial location in the duct. This test procedure was repeated for a range of narrowband centre frequencies. It was found from modal analysis that the analytical theory which accurately predicted tonal scattering[14, 15] also successfully predicts the scattered modal content and onset of sum and difference scattered broadband noise. Very little scattering was observed whenmscatt modes predicted by Equation 14 were not cut-on. If only a single azimuthal mode were to be
excited by an idealised mode generator, no scattering would occur if no predictedmscatt modes were cut-on.
Significant levels of noise scattering was observed at a frequency rangeN BN+ (1×BP F) for the highest
bandwidth tested (BW = 1600Hz). This scattering of noise with a bandwidth greater than the fan BPF
(1083Hz) results in overlapping of incident and scattered noise. This raised an interesting possibility that
broadband noise could be scattered. This could potentially lead to the acoustic pressure field downstream of the rotor containing contributions from the rotor, broadband noise generated upstream of the rotor, and additional noise scattered in frequency and mode order by the sum and difference interaction mechanism. The additional contribution of sum and difference scattering would be very difficult to quantify in this case, as the incident broadband noise could contain a large number of acoustic modes across a very broad frequency range which could then in turn be scattered across additional broad frequency ranges and mode orders.
The coherence-based investigation undertaken in Section 5.4 has investigated the quadratic nature of the interaction. These coherence measurements have indicated that scattering is best predicted by a quadratic interaction model between the incident noise and the rotating rotor, however some levels of linear coherence are also observed in the results from the current test campaign. No conclusive explanation for this high linear and quadratic coherence is as yet offered, however this would appear to further validate the hypothesis that sum and difference scattering arises (at least in part) as a result of a quadratic interaction between the incident noise and a rotating rotor. A further analysis using additional rings of microphones would allow a radial modal analysis to be performed, which would also in turn allow the sound power levels of each radial mode to be quanitifed (with directionality). This is an advisable area of future study.
This investigation has significantly advanced the current level of understanding of sum and difference scattering of noise. This understanding will allow a better prediction of the onset of noise scattering, as well as better consideration of its effect on the exhaust pressure field in aeroengines, and better mitigation through passive (acoustic liner design) or active (noise control system) attenuation.
ACKNOWLEDGEMENTS
This work was supported by the Seventh Framework Programme TEENI project which was funded under EU commission grant agreement 212367.
References
[1] R.J. Astley, A. Agarwal, P.F. Joseph, R.H. Self, M.G. Smith, R. Sugimoto, and B.J. Tester. Predicting
and reducing aircraft noise. In14th International Congress on Sound and Vibration, Cairns, Australia,
9-12 July, 2007.
[2] Friendcopter. Available: http://cordis.europa.eu/result/rcn/47854_en.html.
[3] TEENI: Turboshaft engine exhaust noise identification. Available: http://cordis.europa.eu/
project/rcn/89869_en.html.
[4] RECORD: Research on core noise reduction. Available: http://cordis.europa.eu/project/rcn/
104865_en.html.
[5] G.J. Bennett and J.A. Fitzpatrick. Noise source identification for ducted fan systems. AIAA Journal,
[6] B. Pardowitz, U. Tapken, K. Knobloch, F. Bake, E. Bouty, I. Davis, and G.J. Bennett. Core noise
-identification of broadband noise sources of a turbo-shaft engine. In 20th AIAA/CEAS Aeroacoustics
Conference. 16 -20 June, Atlanta, Georgia, pages –. American Institute of Aeronautics and Astronautics, June 2014.
[7] J.E. Piercey, T.F.W. Embleton, and L.C. Sutherland. Review of noise propagation in the atmosphere. The Journal of the Acoustical Society of America, 61:1403, 1977.
[8] G.J. Bennett, I. Davis, U. Tapken, and J. Mahon. Non-linear frequency scattering of broadband noise
in turbomachinery. In16th AIAA/CEAS Aeroacoustics Conference, Stockholm, 7-9 June, 2010.
[9] N.A. Cumpsty. Sum and difference tones from turbomachines. Journal of Sound and Vibration,
32(3):383–386, 1974.
[10] B. Barry and C.J. Moore. Subsonic fan noise. Journal of Sound and Vibration, 17(2):207–208, 1971.
[11] J.M. Tyler and T.G. Sofrin. Axial compressor noise studies. SAE Transactions, 70:309–332, 1962.
[12] F. Holste and W. Neise. Noise source identification in a propfan model by means of acoustical near field
measurements. Journal of Sound and Vibration, 203(4):641–665, 1997.
[13] L. Enghardt, U. Tapken, O. Kornow, and F. Kennepohl. Acoustic mode decomposition of compressor
noise under consideration of radial flow profiles. AIAA Journal, 2833:23–25, 2005.
[14] I. Davis and G.J. Bennett. Sum and difference scattering of tonal noise in turbomachinery. In 19th
AIAA/CEAS conference in Berlin, Germany, 27-29 May, 2013.
[15] I. Davis and G.J. Bennett. Sum and difference scattering of tonal noise propagating through
turboma-chinery. Submitted to Journal of Sound and Vibration, 2014.
[16] H.A. Siller, F. Arnold, and U. Michel. Investigation of aero-engine core-noise using a phased microphone
array. In7th AIAA/CEAS Aeroacoustics Conference, Maastricht, The Netherlands, 28-30 May, 2001.
[17] H.J. Rice and J.A. Fitzpatrick. A generalised technique for spectral analysis of non-linear systems. Mechanical Systems and Signal Processing, 2(2):195–207, 1988.
[18] G.J. Bennett, J. Mahon, and J.A. Fitzpatrick. Non-linear identification applied to broadband
turbo-machinery noise. In 12th CEAS-ASC Workshop on Turbomachinery Broadband Noise, Bilbao, Spain,
23-24 October, 2008.
[19] SILENCE(R): Significantly lower community exposure to aircraft. Available: http://cordis.europa.
eu/project/rcn/56984_en.html.
[20] E. Envia. A high frequency model of cascade noise. Technical report, NASA, 1998.
[21] M. Nallasamy. Computation of noise radiation from fan inlet and aft ducts. Journal of Aircraft,
34(3):387–393, 1997.
[22] A.M. Karchmer. Acoustic modal analysis of a full-scale annular combustor. In8th AIAA Aeroacoustics
Conference, Atlanta, Georgia, 1983.
[23] J.H. Miles. Restricted modal analysis applied to internal annular combustor autospectra and
cross-spectra measurements. AIAA Journal, 45(5):988–999, 2007.
[24] M. ˚Abom. Modal decomposition in ducts based on transfer function measurements between microphone
pairs. Journal of Sound Vibration, 135:95–114, 1989.
[25] G.J. Bennett. Noise source identification for ducted fans. PhD thesis, Trinity College Dublin, 2006.
[26] I. Davis. Experimental investigations in turbomachinery noise-source identification. PhD thesis, Trinity
![Figure 1: Frequency response function between the combustion noise and the pressure measured atthe exit plane when some rpm dependent non-linearity is included in the model (from Bennett andFitzpatrick[5]).](https://thumb-us.123doks.com/thumbv2/123dok_us/8793754.910548/4.612.168.454.388.505/frequency-response-function-combustion-pressure-dependent-linearity-andfitzpatrick.webp)
![Figure 2: Incident pressure models accommodating a quadratic non-linear term (from Bennett andFitzpatrick[5]).](https://thumb-us.123doks.com/thumbv2/123dok_us/8793754.910548/5.612.204.412.433.489/figure-incident-pressure-models-accommodating-quadratic-bennett-andfitzpatrick.webp)