Abstract -- This paper is study about symmetrical and
unsymmetrical faults. Symmetrical fault which is also known as balanced fault while unsymmetrical fault is representing an unbalanced fault. Generally this paper is focused on modeling the 3 busbar network systems which concerns numerical studies of IEEE 3 busbar standard system testing. The +5% of industrial network will be considered in order to demonstrate the fault location in every different scenario of balanced and unbalanced condition. Moreover, the system is modeled in Simulink Matlab software then the simulation results are compared with manual calculation. The analysis consists of ABC Classification. Therefore, at the end of this paper a network will be development and study the characteristics of ABC and symmetrical sequences with the simulation data available.
Keywords : ABC, balanced fault, symmetrical, unbalanced fault
I. INTRODUCTION
F
AULT studies form an important part of power system analysis. Faults on power systems are divided into two components which are balanced faults and unbalanced faults. There are different types of unbalanced faults which are single line-to-ground fault, line-to-line fault, and double line-to-ground fault. The data available are used for proper relay setting and phase relay, while the line-to-ground fault is used for ground relay [2,11,14]. For the purpose of fault studies, the generator behavior can be divided into three periods which are subtransient period, lasting only for the first few cycles, the transient period, covering a relatively longer time, and finally, the steady state period. Balanced fault is defined as the simultaneous short circuit across all three phases. It occurs infrequently, but it is the most severe type of fault encountered. Because the network is balanced, it is solved on a per- phase basis. The other two phases carry identical currents except for the phase shift. It is different with unbalanced fault which is also known as unsymmetrical fault, which contains of three types of faults where examples are[1]:• Line-to-line - a short circuit between lines, caused by ionization of air, or when lines come into physical contact, for example due to a broken insulator [2].
• Line-to-ground - a short circuit between one line and ground, very often caused by physical contact, for example due to lightning or other storm damage [2].
Traditionally, these faults can be isolated by using relays and circuit breakers which are used to separate the network from the high current. In fault analysis, value of this current is calculated for the different types of faults at various locations in the system. There is a simple worked to measure a fault when it happens in a small circuit rather than in a network [2]. All the techniques embody an accurate location by measuring
only one local end data. The method provides an automatic determination of fault location, rather than requires engineer to specify them.
II.TECHNIQUES APPROACH
A. The ABC Classification
[image:1.612.311.562.486.751.2]The ABC classification distinguishes between seven types of three phase unbalanced voltage sag. Expressions for the complex voltages for these seven types are given in Table I. The complex prefault voltage in phase a is indicated by
E
1. The voltage in the faulted phase or between the faulted phases is indicated by V* while Ua, Ub, Uc are the phase voltage.TABLE I
SEVEN TYPES OF THREE PHASE UNBALANCED VOLTAGE SAG ACCORDING TO ABC CLASSIFICATION
A Detailed Comparative Study of ABC and
Symmetrical Component Classification for Fault
Analysis
Muhammad Saufi Kamarudin, Shamsul Aizam Zulkifli, Erwan Sulaiman, Nur Hidayah Mokhtar
Voltage Phasors Voltage Phasors
A
* V a U =
3 * 2 1 * 2 1
jV V Ub=− −
3 * 2 1 * 2 1
jV V c
U =− +
E
1 E Ua=
3 * 2 1 * 2 1
jV V Ub=− −
3 * 2 1 * 2 1
jV V Uc=− +
B
* V Ua=
3 2 1 2 1
1 1 jE E Ub=− −
3 2 1 2 1
1 1 jE E Uc=− +
F
* V Ua=
3 * 6 1 3 1 * 2 1
1 V j E
V
Ub ⎟⎟
⎠ ⎞ ⎜⎜
⎝
⎛ +
− − =
3 * 6 1 3 1 * 2 1
1 V j E
V
Uc ⎟⎟
⎠ ⎞ ⎜⎜
⎝
⎛ +
+ − =
C
1 E Ua=
3 * 2 1 2 1
1 jV E Ub=− −
3 * 2 1 2 1
1 jV E Uc=− +
G
* 3 1 3 2
1 V
E
Ua= +
3 * 2 1 * 6 1 3 1
1 V jV
E
Ub ⎟⎟−
⎠ ⎞ ⎜⎜
⎝
⎛ +
− =
3 * 1 * 1 1
1 V jV
E
Uc ⎟⎟+
⎠ ⎞ ⎜⎜
⎝
⎛ +
− =
Figure 1 to 7 show the graph for each type indicate by the Table 1
Fig. 1. Voltage sag type A: voltage waveform half-cycle [13]
Fig. 2. Voltage sag type B: voltage waveform (left) half-cycle [13]
Fig. 3. Voltage sag type C: voltage waveform (left) half-cycle [13]
Fig. 4. Voltage sag type D: voltage waveform (left) half-cycle [13]
Fig. 5. Voltage sag type E: voltage waveform (left) half-cycle [13]
Fig. 6. Voltage sag type F: voltage waveform (left) half-cycle [13]
Fig. 7. Voltage sag type G: voltage waveform (left) half-cycle [13]
B. The Symmetrical Component Classification
The symmetrical-component classification does not suffer from the same limitation as the ABC Classification. The symmetrical-component classification distinguishes between dips with the main voltage drop in one phase and dips with the main voltage drop between two phases. Fig 8 shows the voltage divider model for three-phase unbalanced voltage sag.
Fig. 8 . Voltage divider model for three-phase unbalanced voltage sag
Fig 9: The simulink model of the 3 busbar network system
load
da
yah4
da
yah
1
A B C
Thr
ee-Ph
as
e Sou
rc
e1
A B C
A B C
Thr
ee-Ph
as
e F
aul
t
bc Abc Ba bC c
Th
ree
-Phas
e
V-I M
eas
ur
em
en
t4
bc Abc Ba bC c
Th
re
e-Ph
as
e
V-I M
eas
ur
em
ent
2
bcA bc Ba b Cc
Th
ree
-Phas
e
V-I M
eas
ur
em
en
t1
A B C Thr
ee-Ph
as
e
Ser
ies
R
LC
Lo
ad
In
1Ou
t1
Su
bs
ys
te
m
A B C a b c
A B C a b c D
* V
Ua= , 3
2 1 * 2 1
1 jE V
Ub=− − ,
3 2 1 * 2 1
Table II. System Data System Quantities Values Source Voltage 11 kV System frequency 50 Hz Source impedance 1+8jΩ
Load power 666.5kW+ 1154kVarj Fault impedance 1000+0.1jΩ
Fault time 0.5s
Rated transformer 11/33kV Transmission Lines L= 0.766Ω/km
R= 0.5613Ω/km
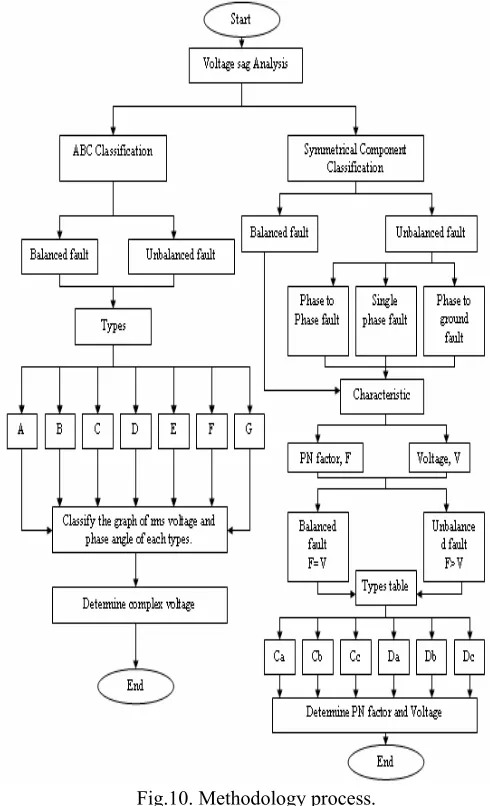
The process flow in determining the faults sequential by using both methods is shown in Fig. 10
Fig.10. Methodology process.
The simulation of the network in fault condition was conducted based on balanced and unbalanced faults where the simulink model network system of the 3 busbar is shown in Fig 9. The data used in the simulation shown in Table II. In single line ground fault analysis, phase A is the faulted phase shown in Fig 12 and three phase fault at Fig 11.
Fig. 11. Balanced three phase fault
Fig. 12. Single line-to-ground fault
III RESULTS
A. Balanced Three Phase Fault
ABC Clasification
In order to analyze by using ABC classification method, the value of voltage in the faulted phase at the PCC (point of common coupling between the customer and the user must be calculated using Eq. (1)
⎟⎟ ⎠ ⎞ ⎜⎜
⎝ ⎛
+ + + + +
+ + −
=
2 1 0 0 2 1
2 1 0
1 *
F F F S S S
S S S
Z Z Z Z Z Z
Z Z Z
V E1 (1)
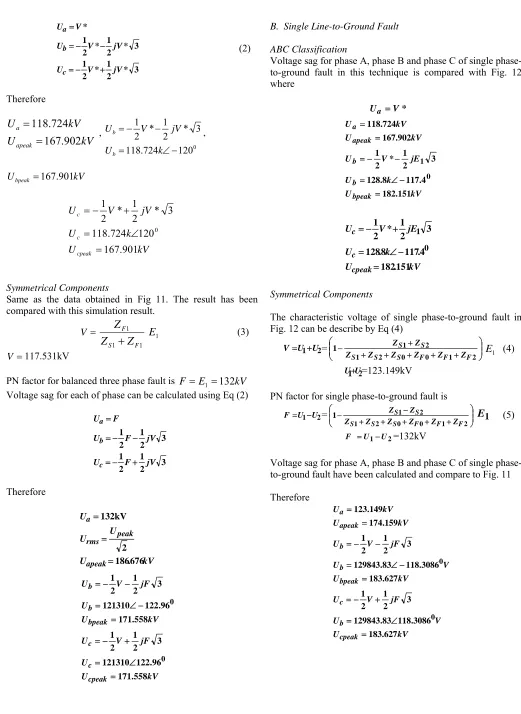
V* = 118.724kV
[image:3.612.75.281.57.196.2] [image:3.612.52.297.239.642.2]3 * 2 1 * 2 1 3 * 2 1 * 2 1 * jV V U jV V U V U c b a + − = − − = = (2) Therefore
kV
U
kV
U
apeak a902
.
167
724
.
118
=
=
, 0 120 724 . 118 3 * 2 1 * 2 1 − ∠ = − − = k U jV V U b b , kVUbpeak=167.901
kV U k U jV V U cpeak c c 901 . 167 120 724 . 118 3 * 2 1 * 2 1 0 = ∠ = + − = Symmetrical Components
Same as the data obtained in Fig 11. The result has been compared with this simulation result.
= V 1 1 1 F S F
Z
Z
Z
+
E1 (3)=
V 117.531kV
PN factor for balanced three phase fault is F=E1=132kV Voltage sag for each of phase can be calculated using Eq (2)
3 2 1 2 1 3 2 1 2 1 jV F U jV F U F U c b a + − = − − = = Therefore kV U U U U apeak peak rms a 676 . 186 2 132kV = = = kV U U jF V U kV U U jF V U cpeak c c bpeak b b 558 . 171 96 . 122 121310 3 2 1 2 1 558 . 171 96 . 122 121310 3 2 1 2 1 0 0 = ∠ = + − = = − ∠ = − − =
B. Single Line-to-Ground Fault
ABC Classification
Voltage sag for phase A, phase B and phase C of single phase-to-ground fault in this technique is compared with Fig. 12 where
*
V Ua =
kV U k U jE V U kV U kV U bpeak b b apeak a 151 . 182 4 . 117 8 . 128 3 2 1 * 2 1 902 . 167 724 . 118 0 1 = − ∠ = − − = = = kV U k U jE V U cpeak c c 151 . 182 4 . 117 8 . 128 3 2 1 * 2 1 0 1 = − ∠ = + − = Symmetrical Components
[image:4.612.42.563.28.742.2]The characteristic voltage of single phase-to-ground fault in Fig. 12 can be describe by Eq (4)
2 1 U U
V= + = ⎟⎟
⎠ ⎞ ⎜⎜ ⎝ ⎛ + + + + + + − 2 1 0 0 2 1 2 1 1 F F F S S S S S Z Z Z Z Z Z Z Z 1
E (4)
2 1 U
U+ =123.149kV
PN factor for single phase-to-ground fault is
2 1 U
U
F= − = ⎟⎟
⎠ ⎞ ⎜⎜ ⎝ ⎛ + + + + + − − 2 1 0 0 2 1 2 1 1 F F F S S S S S Z Z Z Z Z Z Z Z 1
E (5)
2 1 U
U
F = − =132kV
Voltage sag for phase A, phase B and phase C of single phase-to-ground fault have been calculated and compare to Fig. 11
IV. CONCLUSION
Systematic approach covers all cases and is therefore preferable above the ABC classification, which is a more intuitive approach [1-9,11,13,14]. The symmetrical component classification does not suffer from the same limitation as the ABC classification. The symmetrical component classification distinguishes between dips with the main voltage drop between two phases. This paper only considered in findings of the two other characteristics which are characteristic voltage V and the PN factor F. The value of fault impedance is set to 1000
Ω
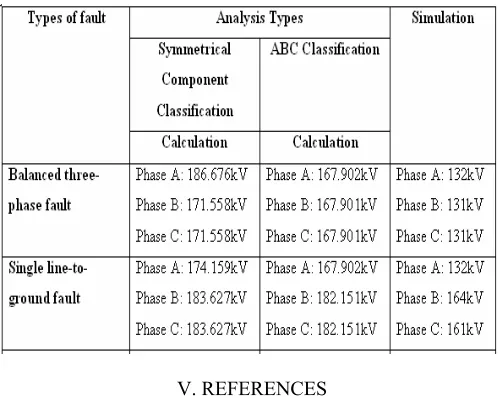
in order to get better picture of the voltage sag itself. The bigger value of fault impedance, the nearly value will be gained when compared to the theory. Therefore, the better choice is to use symmetrical component analysis in order to gain the types of fault in network analysis. The comparison study is shown in Table III. [image:5.612.48.297.303.502.2]
TABLE III
COMPARISON BETWEEN CALCULATION AND SIMULATION VALUE OF SYMMETRICAL COMPONENT CLASSIFICATION AND
ABC CLASSIFICATION ANALYSIS
V. REFERENCES
[1] P. K. Satpathy, D. Das, and P. B. Dutta Gupta, ‘A novel fuzzy index for steady state voltage stability analysis and identification of critical busbars,’ Elect. Power Syst. Res., vol. 63, no. 2, pp. 127–140, Sept. 2002.
[2] H. Saadat(2002). “Power System Analysis.” New York: Milwaukee School of Engineering. 400 – 425.
[3] S.H. Horowitz, A.G.Phadke, “Power System Relaying”, John Wiley and Sons INC, New York, 1992.
[4] R. Hughes, E. Legrand, “Numerical Busbar Protection Benefits of Numerical Technology in Electrical Substation”, International Conference on Developments in Power System Protection, 2001, IEEE Pub. No. 479, pp. 463–466.
[5] R.M. Rifitat, Considerations in applying power bus protection schemes to industrial and IPP systems, Industry Applications Conference, 2002. 37th IAS Annual Meeting. Conference Record of the Industry Application, vol. 3, 2002, pp. 2231–2237.
[6] H. Haug, M. Forster, Electronic bus zone protection, in: THE Proceedings of CIGRE, Paris, June 10–20, 1968.
[7] T. Forford, J.R. Linders, Application of a high speed differential relay for buses, machines and cables, in presented at the 3rd Annual Western Protective Relay Conference, Spokane, WA, October 18, 1976.
[8] Sung-Min Woo, Dae-Wook Kang, Woo-Chol Lee, Dong Seok Hyun.’ The Distribution for Reducing the Effect of Voltage Sag and Swell’. IEEE 2001. pp A4-1 – A4-7 (Rural Electric Power Conference 1996) April 1996
[9] IEEE Std 1159-1195 on Power Quality. “IEEE Recommended Practice for Monitoring Electric Power Quality.” (IEEE
Standard 1995)
[10] S. A. Zulkifli. “Design and Simulation of A 24-Pulse D-Statcom for Voltage Sag Mitigation.” (Degree Thesis, Department of Electrical and Electronic Engineering,Faculty of Engineering, Universiti Putra Malaysia) April 2003.
[11] J.Duncan, S.Sarma, Power System Analysis and Design,Bookd/Cole Thompson Learning,United States,2002.
[12] Asmarashid, Erwan, B.C. Kok, S.Aizam, Md. Zarafi. “Electric Power Systems”, 1st Ed.Kuittho, December, 2006. pp 167 -204.
[13] H.J.Bollen, Y.H Irene, Signal Processing of Power Quality Disturbances, Wiley-Interscience, United State, 2006.
[14] C. Dugan, F. McGranaghan, H.Wayne, Electrical Power Systems Quality, McGraw-Hill’s, New York, 1995-4569
VII. BIOGRAPHIES
Muhammad Saufi Kamarudin obtained his B.Eng degree in Electrical$ Engineering and M Eng at UTM, Malaysia in 2003 and 2005, repectively. Currently he is a lecturer and researcher in Universiti Tun Hussein Onn Malaysia. His interest areas are high voltage engineering and electric motors.
Shamsul Aizam Zulkifli obtained his B.Eng degree in Electrical & Electronic Engineering and Msc at University Putra Malaysia, Malaysia in 2003 and 2006, repectively. Currently he is a lecturer and researcher in Universiti Tun Hussein Onn Malaysia. His interest areas are power quality problems, custom power devices and power system studies.
Erwan Sulaiman obtained his B.Eng degree in Electrical & Electronic Engineering and M Eng. at UM and UTHM respectively. Currently he is a lecturer and researcher in Universiti Tun Hussein Onn Malaysia. His interest areas are renewable energy and power system applications.