INSTRUMENTED PHYSICAL MODEL STUDIES OF THE PEAT SOIL- ENGINEERING STRUCTURE INTERACTION
SITI NOORAIIN BT MOHD RAZALI
A thesis submitted in
fullfillment of the requirement for the award of The Master Degree of Civil Engineering
Faculty of Civil and Environmental Engineering Universiti Tun Hussein Onn Malaysia
vi
ABSTRACT
vii
ABSTRAK
viii
CONTENTS
TITLE i
DECLARATION ii
DEDICATION iv
ACKNOWLEDGEMENT v
ABSTRACT vi
CONTENTS viii
LIST OF TABLES xiii
LIST OF FIGURES xiv
LIST OF SYMBOLS AND ABBREVIATIONS xix
LIST OF EQUATIONS xx
LIST OF APPENDIX xxi
CHAPTER 1INTRODUCTION 1
1.1 Preamble 1
1.2 Description of Problems 3
1.3 Objectives 6
1.4 Scope of Study 6
1.5 Importance and Contribution of Study 9
1.6 Organization of Thesis 9
1.7 Tests Schedule 11
CHAPTER 2LITERATURE REVIEW 12
2.1 Introduction 12
2.2 Peat Soil 13
2.2.1Definition of Peat 13
2.2.2Classification 14
2.2.3Peat Characteristics and Properties 18
2.3 Sand 20
2.3.1Definition and Formation 20
ix
2.4 Behaviour of Soil under Static Loading 22
2.4.1Settlements 22
2.4.1.1General 22
2.4.1.2Sand 24
2.4.1.3 Peat 26
2.4.2Stresses due to external load 29
2.4.3 Pore Water Pressure 32
2.5 Challenges on Peat 32
2.6 Modes of Failure 33
2.7 Case Studies 36
2.7.1The Bereng Bengkel Trial Embankment 37
2.7.2Physical Modelling of Railway Embankments on Peat
Foundations 38
2.7.3Instrumentation and Analysis of a Railway Embankment
Failure Experiment 40
2.7.4Construction on Soft Soil with “Akar Foundation” 44 2.7.5Surcharging as a Method of Road Embankment Construction on
Organic Soils 45
2.8 Indicator 48
CHAPTER 3MARDI-IPRS PEAT 50
3.1 Introduction 50
3.2 Site Sampling 50
3.3 Sample Preparation 54
3.4 Method for Peat Identification 56
3.4.1Index Properties Tests 57
3.4.1.1Von Post Scale of Humification 57
3.4.1.2Moisture Content 58
3.4.1.3Specific Gravity 59
3.4.1.4Organic Content 60
3.4.1.5pH 61
x
3.5 Pontian Peat Soil Characteristics 62
3.5.1Index Properties 63
3.6 Chapter Summary 66
CHAPTER 4PRE- MODEL STUDY (PMS) 67
4.1 Introduction 67
4.2 Experimental Apparatus 67
4.2.1Model Container 67
4.2.2Model Design and Load 69
4.2.3Model Construction and Testing Procedure 71
4.2.3.1Indicator 71
4.2.3.1.1 Coal and Laterite 72
4.2.3.1.2Polystyrene and Sand 75
(a) Polystyrene 76
(b)Sand 77
(c)Comparison of Polystyrene and Sand 78
4.2.3.2DT Plate Size 81
4.3 Evaluation of Apparatus (results) 82
4.3.1Indicator 82
4.3.1.1Sand 82
4.3.1.2Peat 84
4.3.1.3Comparison of Failure in Sand and Peat 91
4.3.1.4Displacement Transducer‟s Plate Size 93
4.3.1.5Pre Model Study Setup 94
4.4 Chapter Summary 95
CHAPTER 5PLANE STRAIN STUDY (PSS) 97
5.1 Introduction 97
5.2 Description of the 2D Small Scale Model 98
5.2.1Model Design 98
5.2.1.1Instrumented Section 100
xi
5.2.3Instrumentations 106
5.2.3.1Types of Instrumentations 106
5.2.3.2Procedure of Calibration 108
(a) Displacement Transducer (DT) 108
(b) Soil Pressure Gauge (SPG) 109
(c) Pore Pressure Gauge (PPT) 110
5.2.3.3Installation of Instrumentations 110
(a) Displacement Transducer (DT) 110
(b) Soil Pressure Gauge (SPG) 111
(c) Pore Pressure Transducer (PPT) 112
5.3 Model Construction and Testing Procedure 114
5.3.1Introduction 114
5.3.2Plane Strain Study for Peat 117
5.3.3Plane Strain Study for Sand 118
5.3.3.1 Dry Sand 118
5.3.3.2Wet Sand 119
5.3.4Loading 120
5.3.5Maintenance 121
5.4 Evaluation of Apparatus (Results) 122
5.4.1Calibrations Data 123
5.4.1.1Displacement Transducers 123
5.4.1.2Soil Pressure Gauges 123
5.4.1.3Pore Pressure Transducers 124
5.4.2Plane Strain Study for Peat 124
5.4.3Plane Strain Study for Sand 125
5.4.3.1Dry Sand 125
5.4.3.2Wet Sand 126
xii
CHAPTER 6RESULTS AND ANALYSIS 128
6.1 Introduction 128
6.2 Settlements 129
6.2.1Calculated Settlements 129
6.2.2 Measured Settlements using Gridlines Marker 131 6.2.3Measured Settlements using Instrumentations 134
(a) DT 1 134
(b)DT 2 135
(c)DT 3 136
(d)DT 4 137
(e)DT 5 138
(f)DT 6 139
(g)Summary 140
6.2.4Settlements: Calculated, Measured by instruments and by
Gridlines 143
6.3 Stresses 145
6.3.1Calculated Stresses 145
6.3.2Measured Stresses 151
6.3.3Stress: Calculated and Measured 159
6.4 Summary 161
CHAPTER 7CONCLUSIONS AND RECOMMENDATIONS 162
7.1 Conclusions 162
7.2 Critical Overview of Study 163
7.3 Assumptions and Limitations 165
7.4 Precaution during the Experiments 165
7.5 Significance of Study 166
7.6 Recommendations for Further Study 167
xiii
LIST OF TABLES
Table 1. 1: Characteristics of Peat Swamps in Malaysia 2
Table 1.2: Schedule of Tests Conducted 11
Table 2. 1: Different Descriptions of Peat 14
Table 2. 2: Classification of Peat 15
Table 2. 3: The Von Post Scale of Humification 17
Table 2. 4: Index Properties of Peat 19
Table 2. 5: Properties of Peat Soil in Malaysia 20
Table 2. 6: Soil Classification System 21
Table 2. 7: Challenges on Peat 33
Table 2. 8: Physical Properties of Organic Soils at Antoniny Site 46
Table 2.9: Types of indicator used by past researchers 48
Table 3.1: Testing and Standard Methods 56
Table 3.2: Classification of Peat 63
Table 3. 3: Properties of Peat Soil Compared to Past Researchers 65
Table 4.1: Box Dimensions 68
Table 4. 2: Sand Size Selection 87
Table 4. 3: Conclusion for the indicator of peat 90
Table 6. 1: Summarize of Maximum Settlement 140
Table 6. 2: Settlement from Calculated, Measured and Gridlines Marker 143
Table 6. 3: Example of Stress Calculation 147
xiv
LIST OF FIGURES
Figure 1. 1: The distribution of Peat in Malaysia 2
Figure 1.2: Settlement in the Housing Area, Sibu, Sarawak 4
Figure 1.3: Settlement for (a) pipeline and (b) lamp post near Salim-Airport Road
By-Pass, Sibu, Sarawak 5
Figure 1.4: Settlement on Peat Soil, Parit Nipah, Johor 6
Figure 1. 5: Flow Chart 8
Figure 2.1: Summary of Literature Review 13
Figure 2. 2: Compression Index versus Consolidation Pressure 15
Figure 2. 3: Distribution of Pressure 29
Figure 2. 4: Vertical stress below the corner of a uniformly loaded flexible rectangular area 30
Figure 2. 5: Increase of stress below a rectangular loaded flexible area 31
Figure 2.6: General Shear Failure 34
Figure 2.7: Local Shear Foundation Failure 35
Figure 2.8: Punching Shear Failure 35
Figure 2. 9: The Results of Compression Tests of Peat 39
Figure 2. 10: View of Models and Prototypes with Stages of Deforming 40
Figure 2.11: Car Numbering 41
Figure 2.12: The Embankment Failure 42
Figure 2. 13: Selected Transverse Displacement Measured with Total Stations 43
Figure 2. 14: Selected Settlement Tube Measurements 43
Figure 2. 15: Settlement Tube Readings under the Embankment 43
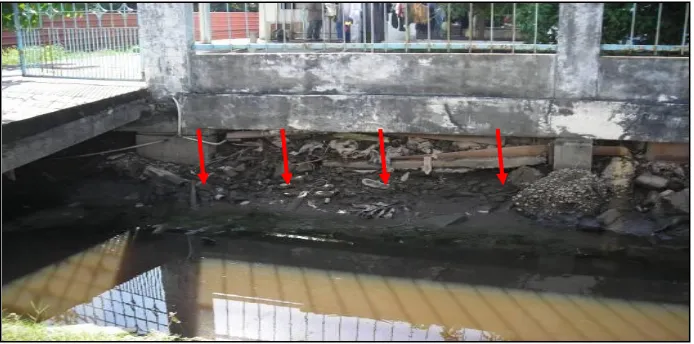
Figure 2. 16: Load Test of the Foundation System: The arrow marker indicated the soil bed level (settlement) under different loads 45
Figure 2.17: Vertical Settlements in the Organic Subsoils at Antoniny Site 47
Figure 2. 18: Horizontal Displacement at Antoniny Site 47
xv
Figure 3.1: Site Study 51
Figure 3.2: Site for Sampling 51
Figure 3.3: Soil Profiling using Peat Auger 52
Figure 3.4: Soil Profile 53
Figure 3.5: Peat Sampling Process 53
Figure 3.6: Peat with Large Woody Fragments 54
Figure 3.7: Sample Preparation 55
Figure 3. 8: Squeezed Peat 57
Figure 3. 9: Moisture Content 58
Figure 3. 10: Specific Gravity Apparatus 59
Figure 3.11: Organic Content 60
Figure 3.12: pH 61
Figure 4.1: Model for Pre-Model Study 70 Figure 4.2: Indicator for Sand 73
Figure 4.3: Construction Steps for Small Model 74
Figure 4.4: Set up for Square Box 75
Figure 4.5: Polystyrene as an Indicator 76
Figure 4.6: Construction Process 77
Figure 4.7: Testing for Size of Sand as an Indicator 78
Figure 4.8: Test to Identify the Suitable Indicator 79
Figure 4.9: The Different Indicators Test 80
Figure 4.10: Loading Process 81
Figure 4.11: Suitable Plate Sizes 81
Figure 4.12: Indicator for Sand 83
Figure 4. 13: Settlement Pattern with the Increasing of Load 84
Figure 4. 14: Polystyrene as an Indicator 85
Figure 4.15: Sand as an Indicator 86
xvi
Figure 4.17: Result for the Most Visible 89
Figure 4.18: Sand Absorb the Water and Affect the Settlement of Peat 91
Figure 4. 19: Failure Pattern 92
Figure 4.20: Tests to Determine the Plate Size 93
Figure 4.21: Setup for PMS 95
Figure 5.1: Overview of Test (a) Peat and (b) Sand 99
Figure 5.2: Location of DT (Plan View) 100
Figure 5.3: Location of Soil Pressure Gauge (Plan View) 101
Figure 5.4: Location of Pore Pressure Transducers (Front View) 102
Figure 5.5: Setting for Environment 103
Figure 5.6: File Name 103
Figure 5.7: Steps to Set the Interval Time 104
Figure 5.8: MEAS Setting 105
Figure 5.9: Instrumentations for Monitoring 107
Figure 5.10: Calibration for DT 109
Figure 5.11: Different Load Applied to SPG 109
Figure 5.12: PPT at Different Depth 110
Figure 5.13: Installation of DT 111
Figure 5.14: Installation of SPG into Holder 111
Figure 5. 15: Installation of PPT into the Wall Box 112
Figure 5.16: Location of Instrumentations 113
Figure 5.17: Data Logger Connection 113
Figure 5.18: Plastic Sheeting to Minimize Friction 114
Figure 5.19: Grid Paper as Settlement Marker 115
Figure 5.20: Detailed of Large Box 116
Figure 5.21: The Construction of Physical Model Study on Peat Soil 117
Figure 5.22: The Construction of Physical Model Study on Dry Sand 118
xvii
Figure 5.24: Location of Load and DT in (a) Peat and (b) Sand 120
Figure 5.25: Maintenance Process 122
Figure 5. 26: Displacement Pattern in Peat 124
Figure 5. 27: Displacement Pattern in Dry Sand 125
Figure 5. 28: Displacement Pattern in Wet Sand 126
Figure 6. 1: Calculated Settlement on Sand and Peat 130
Figure 6. 2: Deformation Patterns 131
Figure 6.3: Maximum Settlement (Gridlines) 133
Figure 6.4: Settlement for Dry Sand, Wet Sand and Peat at DT1 134
Figure 6. 5: Settlement for Dry Sand, Wet Sand and Peat at DT2 135
Figure 6. 6: Settlement for Dry Sand, Wet Sand and Peat at DT3 136
Figure 6. 7: Settlement for Dry Sand, Wet Sand and Peat at DT4 137
Figure 6. 8: Settlement for Dry Sand, Wet Sand and Peat at DT5 138
Figure 6.9: Settlement for Dry Sand, Wet Sand and Peat at DT6 139
Figure 6. 10: Maximum Settlement (Instrumentations) 141
Figure 6. 11: Settlement Increases with Load Increases for Dry Sand 142
Figure 6. 12: Calculated versus Measured Settlement 144
Figure 6. 13: Area Divided into Four Rectangles 146
Figure 6. 14: Different Depth, Same Distance (76 cm c-c) 147
Figure 6. 15: Different Depth, Same Distance (38 cm c-c) 148
Figure 6. 16: Different Depth, Same Distance (0 cm c-c) 148
Figure 6. 17: Different Distance, Same depth (H=20 cm) 149
Figure 6. 18: Different Distance, Same depth (H=40 cm) 149
Figure 6. 19: Different Distance, Same depth (H=60 cm) 150
Figure 6. 20: Stress Isobars 150
Figure 6. 21: Measured Stress at Different Depth, Same Distance (76 cm) 152
Figure 6. 22: Measured Stress at Different Depth, Same Distance (38 cm) 152
xviii
xix
LIST OF SYMBOLS AND ABBREVIATIONS ∆σ Increase of stress
σ′0 Effective overburden pressure ∆σ′ Effective pressure
µs Poisson‟s ratio of soil
B Width of loading plate
C’α Secondary compression index
Cc Compression index DS Dry sand
DT Displacement transducer
E Young Modulus
Eu Undrained modulus
Es Modulus of elasticity of the soil under the foundation
e0 Initial void ratio
Gs Specific Gravity H Thickness of the soil Is Shape factor
If Depth factor
L Length of loading plate LL Liquid Limit
PL Plastic Limit
PPT Pore pressure transducer PT Peat
q Uniformly distributed load per unit area SPG Soil pressure gauge
Sc Primary settlement Si Immediate settlement Ss Secondary compression St Total settlement
t1, t2 Time
xx
LIST OF EQUATIONS
NO. EQUATION PAGE
2.1 St = Si + Sc + Ss 25
2.2 Si = ∆σ (αB′)1−µs2
Es IsIf
25
2.3
Sc = CcH
1+e0 log σ′0+∆σ′
σ′0
27
2.4
Ss = C′αH logt2
t1
28 2.5
dq = q dx dy 30
2.6 ∆σz = 3p
2π z3 L5 =
3P 2π
z3
(r2+z2)52
30
2.7
σ
z=
3q dx dy z32π(x2+y2+z2)52
31
2.8
∆σz = dσz = 3qz3(dx dy )
2π(x2+y2+z2)52 = qI3
L x=0 B
y=0 31
2.9 I3 = 1
4π
2mn m2+n2+1
m2+n2+m2n2+1
m2+n2+2
m2+n2+1 + tan
−1 2mn m2+n2+1
m2+n2−m2n2+1 31
2.10 m =B
z, n = L
z 31
2.11 ∆σz = q I3(1)+ I3(2) + I3(3)+ I3(4) 31
3.1 w =W2−W3
W3−W1× 100% 58
3.2 Gs =
γk m2−m1
m4−m3 − m3−m2 59
3.3 OC = m2−m3
xxi
LIST OF APPENDIX
APPENDIX TITLE PAGE
A Calibration for Displacement Transducers 175
B Calibration for Soil Pressure Gauges 176
C Calibration for Pore Pressure Transducers 178
D Values of Z, B and L 179
CHAPTER 1
INTRODUCTION
1.1 Preamble
2
[image:19.595.116.525.86.294.2]Peat in Malaysia can be categorized as a tropical peat with unique characteristics. Thus, this makes it significantly different from other peat. In its natural state, this soil is normally dark reddish brown to black in colour and consists of partly decomposed leaves, branches, twigs and tree trunks with a low mineral content (Zainorabidin and Wijeyesekera, 2007). Table 1.1 shows the characteristics of peat in Malaysia.
Table 1. 1: Characteristics of Peat Swamps in Malaysia (Muttalib, 1991). (Cited by Zainorabidin and Wijeyesekera, 2007)
Region Location Topography Total Area Characteristics
Peninsular West Johore,
Kuantan, Pekan, Selangor, Perak.
Peat land is flat. Approximately 80,
000 km2 with 89% of its having deep peat (> 1m).
Normally found in the coastal areas of the east and west coasts.
Sarawak Kuching,
Samarahan, Sri Aman, Sibu, Sarikei, Bintulu, Miri and Lambang.
The basin peat swamps are dome-shaped.
16500 km2 with 89% of its having deep peat ( > 1m)
Peat occurs mainly between the lower stretches of the main river courses (basin peats) and in poorly drained interior valleys (valley peats).
Sabah Kota Belud,
Sugut, Labuk, Kinabatangan.
Peat land is flat. 86 km2. There were no estimates on the depths.
[image:19.595.111.531.525.708.2]Peat soils are found on the coastal areas. Figure 1. 1: The distribution of Peat in Malaysia (Andriesse, 1974)
KALIMANTAN EAST MALAYSIA
SOUTH CHINA SEA BRUNEI
3
Road construction over peat presents great challenges to road builder not only in the construction process but also in the management of the engineering properties of peat which have high water content (>200%), high compressibility (0.9 to 1.5), high organic content (>75%) low shear strength (5-20kPa) and low bearing capacity (<8kN/m2), large deformation and high magnitude and rates of creep (Zainorabidin and Wijeyesekera, 2007; Haan and Kurse, 2006). This unique characteristic of peat has led to the problems of the construction become challenging in Malaysia (Zainorabidin and Bakar, 2003; Hashim and Islam, 2008a).
The peat which was formerly considered unsuitable foundation for the construction had to be used because of the land use or demand. The challenges faced by engineers in road/building construction over peat include limited accessibility, drainage problem and stability problems. Hence, construction process on peat soil has become more complex. In order to construct a safe, stable and serviceable road, a road engineer has to overcome this engineering problem by using suitable solutions to construct roads on peat soil. It is also important for engineers to know the nature of the distribution of stress along a given cross section of the soil profile that is, what fraction of the normal stress at a given depth in a soil mass to analyse the problems such as compressibility of soils, bearing capacity of foundations, stability of embankment, and lateral pressure on earth-retaining structures (Das, 2011).
1.2 Description of Problems
4
samples of hemic and fibrous peat using conventional undisturbed samplers and the different method of sampling for the different depth of peat soil.
Staley (2007) stated that the impact of settlement can be significant, particularly where the differential settlement occurs due to a peat deposit having variable thickness, groundwater flow direction, slopes, differential loading or previous compressions. Because of settlement occurs gradually, it is important to give more attention on impacts of additional loading and water level against the settlement. In this study the effect of additional loading was observed and the water level was maintained.
Ferguson (as cited in Wartman 2006) stated that physical models have served important functions in engineering research, practice and education for hundreds of years. In additional, the full scale experiments are very expensive, difficult to run, and are hard to repeat (Meguid, 2008). Hence, because of this reason, this study focussed on physical models in the laboratory.
[image:21.595.141.488.542.714.2]One of the case studies in Malaysia was in Sibu, Sarawak. The peat formations in some parts of Sibu are well over 10 meters in depth (Vincent, 2009). Figure 1.2 shows the settlement in a housing area in Sibu town, which cause a serious problem. This problem caused high risk to occupant in terms of safety. Duraisamy and Huat (2008) highlighted that ground subsidence on peat generally resulted in negative gradients to drainage. This scenario resulting of unhealthy water stagnation in many parts of the town and it is also prone to flooding (Kolay et al, 2011).
5
Figure 1.3 shows the settlement near Salim-Airport Road By-pass, Sibu, Sarawak. The figure 1.3 (a) shows the gap between the pipeline with the ground surface and Figure 1.3 (b) show the settlement under a lamp post. According to Duraisamy and Huat (2008), the problem of this settlement is mainly caused by either uncontrolled land filling or ground water lowering due to over drainage or due to both of the activities.
Figure 1.4 was taken during a site investigation in Parit Nipah, Johor, which is in the housing area. This house has been built on peat soil. The author observed that the settlement occurred and this can clearly see in the columns that support the house. It is dangerous to the occupants. The owner needs to place an object like a rock or wooden block between column and foundation because of some columns appear hanging as shown in Figure 1.4 (a).
The interaction between structure and foundation is important especially to distribute the loading of the structure uniformly into the foundation. Sekhar (2002) stated that the force quantities and the settlement at the finally adjusted condition can only be obtained through interactive analysis of the soil-structure analysis. Figure 1.4 (b) shows higher settlement value in the peat. Loading from a small wooden house have been distributed to the ground and resulted in the settlement. The settlement in this area was in the range of 150 mm. Peat is not suitable to support higher loads because of the high compressibility.
[image:22.595.124.520.231.424.2](b) (a)
6
1.3 Objectives
The objectives of this study are:
a) To identify the engineering properties of the tested peat,
b) To investigate and analyse the deformation behaviour in peat soil based on physical modelling,
c) To investigate and analyse using physical model the stress distribution beneath the structure in peat soil and,
d) To compare and analyse the peat behaviour with sand.
1.4 Scope of Study
[image:23.595.120.527.113.324.2]Physical modelling is considered as a prime method to study the peat soil – structure Figure 1.4: Settlement on Peat Soil, Parit Nipah, Johor (Author, 2011)
(a) Rock between column and foundation and (b) Settlement Value
(a) (b)
150 mm Rock
Column
7
interaction. The purpose of this physical model study is to acquire basic understanding of the behaviour and stress of peat soil when load is applied to it. This physical model study has been conducted on peat soils obtained from the Malaysian Agricultural Research and Development Institute-Integration Peat Research Station (MARDI-IPRS) in Pontian, Johor. Index properties of peat soil were determined by conducting site investigation and experiments on disturbed peat obtained from the site.
Three different sizes of the box for the physical modelling have been used in this study. The small box with a size 35cm x 2cm x35cm and the square box with size 30cm x30cm x 30cm have been used in Pre-Model Study (PMS). This PMS is important because the author can control the variable before implement it into the Plane Strain Study (PSS) model. For proper monitoring and instrumentations purpose, the large box with dimensions of 200cm x 50cm x 90cm with a transparent perspex plate as a wall has been used. Three types of instrumentations have been used which is displacement transducers (DT), soil pressure gauge (SPG) and pore pressure transducers (PPT). To minimize friction between soil and the box, plastic sheeting was attached to the inner sides of the box. Grid paper has been installed in the outer side of the box for manual monitoring of settlement.
8
Figure 1. 5: Flow Chart
INSTALLATIONS
(Wrapper, Grid Paper & Label, Sand (filter), Instrumentations & Data Logger Connection)
PROBLEM IDENTIFICATION
(Identify Research Problems, Scope & Objective)
SAMPLE COLLECTION
(Disturbed Sample, Von Post of Humification)
DESIGN FOR PLANE STRAIN STUDY (PSS)
(To Identify Numbers of Instruments, Location of Instruments & load)
SAMPLE PREPARATION
(Sieve Peat Sample)
DESIGN FOR PRE-MODEL STUDY (PMS) (To Identify the Types of Indicator, Location of
Indicator)
INSTRUMENTATIONS & DATA LOGGER PRACTICES
(Displacement Transducer (DT), Soil Pressure Gauge (SPG), Pore Pressure Transducer (PPT)
MAINTENANCE & CALIBRATIONS
(Box & Instrumentations)
SOIL IDENTIFICATION
(Moisture Content, pH, Specific Gravity, Organic Content, Unit Weight, LL)
PRE- MODEL STUDY (PMS)
(35cm x 2cm x 35cm)& (30cm x30cm x 30cm) (Check the Failure Indicator, Failure Pattern, Plate
Footing for DT)
PLANE STRAIN STUDY (PSS)
(200cm x 50cm x90cm)
(Check Displacement, Stress and Pore Pressure)
SAND
PEAT
DRY SAND
WET SAND
PEAT RESULTS & ANALYSIS
9
1.5 Importance and Contribution of Study
Currently, the study of physical modelling sees an increasing use in geotechnical engineering (Wartman, 2006). The finding from this study can give benefit to engineers, contractor, academician and other in this area for better understanding on the concept of settlement on peat soils. Physical models can clearly portray the geotechnical mechanism and also the phenomena that are difficult to visualize (Wartman, 2006). The physical model study generally used as complements to the laboratory testing. This physical model is important because it can test the theory or the process before implement it into the full scale test.
1.6 Organization of Thesis
This thesis consists of seven chapters including the first introductory chapter. The contents of the chapters are as summarized below:
(1) Chapter 1: Introduction
This chapter presented the proposal of this study that included problem statements, objectives, scope of study and the contribution of this study. The author has included some of the settlement problems occurred in Malaysia especially in Johor and Sarawak.
(2) Chapter 2: Literature Review
10
(3) Chapter 3: Sample Preparation
This chapter described the location of peat soil used in this study. The method to produce the uniform sample also elaborated in this chapter. The author identified the physical properties of Pontian peat soil by conducting the von post scale humification, moisture content, specific gravity, organic content and pH. Hence, the methods used and the results obtained were described in the last parts of this chapter.
(4) Chapter 4: Pre-Model Study (PMS)
This chapter presented the methods of construction the pre-model study included the model design. This PMS is used to identify the suitable indicator to detect the deformation behaviour in peat and sand. Four materials (coal, laterite, sand and polystyrene) have been tested its effectiveness as an indicator and the results obtained are also included in this chapter.
(5) Chapter 5: Plane Strain Study (PSS)
This chapter consists of the procedure in the plane strain study. The PSS was used with advanced instrumentations such as displacement transducers, soil pressure gauges and pore pressure transducers to investigate and observed the settlement, stress and pore pressure in peat and sand. The installation of displacement transducers, soil pressure gauges and pore pressure transducers were also discussed including information towards the calibration for each instrument. The model design, model construction, model testing and the results obtained based on these tests were elaborated in this chapter.
(6) Chapter 6: Results and Analysis
The data obtained from the PSS then were analysed. Three types of measurements that have been collected which are settlements, stresses and pore pressures. The analysis and early conclusion were discussed in this chapter.
(7) Chapter 7: Conclusions
11
1.7 Tests Schedule
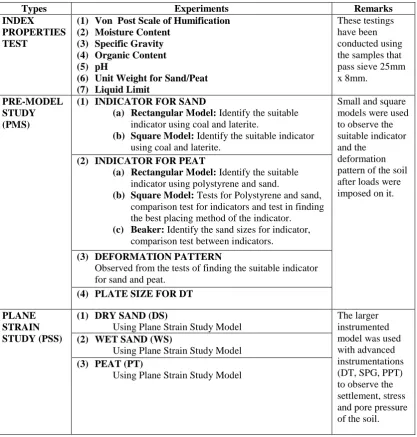
[image:28.595.113.531.183.621.2]The schedule of the test conducted in this study is as shown in Table 3.1.
Table 1.2: Schedule of Tests Conducted
Types Experiments Remarks
INDEX PROPERTIES TEST
(1) Von Post Scale of Humification (2) Moisture Content
(3) Specific Gravity (4) Organic Content (5) pH
(6) Unit Weight for Sand/Peat (7) Liquid Limit
These testings have been conducted using the samples that pass sieve 25mm x 8mm.
PRE-MODEL STUDY (PMS)
(1) INDICATOR FOR SAND
(a) Rectangular Model: Identify the suitable indicator using coal and laterite.
(b) Square Model: Identify the suitable indicator using coal and laterite.
Small and square models were used to observe the suitable indicator and the
deformation pattern of the soil after loads were imposed on it. (2) INDICATOR FOR PEAT
(a) Rectangular Model: Identify the suitable indicator using polystyrene and sand.
(b) Square Model: Tests for Polystyrene and sand, comparison test for indicators and test in finding the best placing method of the indicator. (c) Beaker: Identify the sand sizes for indicator,
comparison test between indicators.
(3) DEFORMATION PATTERN
Observed from the tests of finding the suitable indicator for sand and peat.
(4) PLATE SIZE FOR DT
PLANE STRAIN STUDY (PSS)
(1) DRY SAND (DS)
Using Plane Strain Study Model
The larger instrumented model was used with advanced instrumentations (DT, SPG, PPT) to observe the settlement, stress and pore pressure of the soil. (2) WET SAND (WS)
Using Plane Strain Study Model (3) PEAT (PT)
12
CHAPTER 2
LITERATURE REVIEW
2.1 Introduction
Soil composed of a varying ratio of mineral, air, water and organic material. It is consists about 40% mineral, 23% water, 23% air, 6% organic material and 8% living organisms. There are many types of problematic soil. Some of the most noteworthy being swelling or shrinking clay, collapsible soils, frozen soils and peat (Culshaw, 2001).
13
This chapter starts with the introduction to the peat and sand which is covered about the properties of the soils itself. Then the review based on the behaviour of peat and sand under static loading was highlighted. This behaviour was including the settlements, stresses and pore water pressures. In this chapter also consists of the challenges of peat, the failure pattern, the case studies and also the indicators of the failure that have been used by the past researchers. The literature review is divided into several parts as shown in Figure 2.1.
2.2 Peat Soil
2.2.1 Definition of Peat
According to ASTM D4427-92 (1997), peat is defined as soil that naturally occurring with highly organic substance derived primarily from plant materials. It is
Introduction
Peat
Sand
Behaviour of Soil under Static Loading (Settlements, Stresses & Pore water Pressure)
Failure Pattern
[image:30.595.219.444.254.521.2]Case Studies
Figure 2.1: Summary of Literature Review
Challenges of Peat
14
formed when organic (usually plant) matter accumulates more quickly than it humidifies (decays). This usually occurs when organic matter is preserved below high water table like in swamps or wetlands (Duraisamy and Huat, 2008). The rate of peat accumulation varies in different places depending on the bog plants live and die on the surface (Leong and Chin, 2000).
Geotechnical engineers define peat as soils that organic content is more than 75% and the soil with organic content below 75% was categorized as organic soils. However, in soil sciences, the soils that have an organic content more than 35% are classified as peat. The definitions for peat soil can be summarized as in Table 2.1.
Table 2. 1: Different Descriptions of Peat (Zainorabidin, 2010)
Field Description Standard
Geotechnical engineering
All soils with organic content greater than 75% are known as peat. Soils that have an organic content below 75% are known as organic soils.
ASTM D4427-1997
Soil science All soils with organic content greater than 35% are
categorized as peat.
USDA (Soil Taxonomy)
2.2.2 Classification
Soil classification is important in engineering to describe the properties, texture and grain size of a soil. It is necessary to adopt a formal system of soil description and classification to describe the materials found in ground investigation. The classification also can be made based on the observation on the structure of the system itself. Under the soil classification system, peat was included under the name of muck soil, bog soil and organic soil (Montanarella, 2006).
15
[image:32.595.106.533.176.248.2]can be categorized as hemic and for fibre content less than 33%, can be classified as Sapric.
Table 2. 2: Classification of Peat
Classification Fibre Content Degree of Von Post Humification
Fibric > 66% H4 – less
Hemic 33% - 66% H5 – H6
Sapric <33% H7
Fibric peat will cause highest settlements followed by hemic and sapric when subjected to any load over the time period (Duraisamy et al, 2007). Figure 2.2 shows the compression index (Cc) values of Rowe Cell consolidation test for fibric, hemic and sapric peat. Cc for fibric peat was within the range of 1.878 to 3.627, for hemic peat was recorded as 1.34 to 2.99 and sapric peat was 1.24 to 2.63.
Figure 2. 2: Compression Index versus Consolidation Pressure (Duraisamy et al, 2007)
[image:32.595.123.508.393.618.2]16
This system has only been adopted in Canada (Hobbs 1986). Radforth (1969) stated that peat is considered to fall into three main groups for engineering purposes which are amorphous granular peat, fine fibrous peat and course fibrous peat. The amorphous granular peat consists of peat with a high colloidal mineral component which tends to hold the contained water in an adsorbed state around the grain structure. The two fibrous peat types, „fine-fibrous‟ and „coarse-fibrous‟, are woodier and hold most of their water within the peat mass as free water.
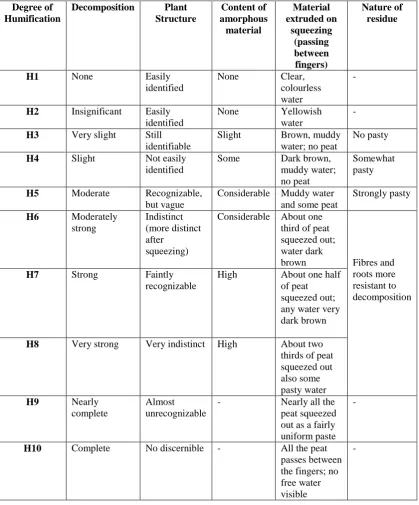
Hendry (2011) stated that the von Post system is a more extensive classification method and forms the basis for the American Society for Testing and Materials (ASTM) standards for the classification and testing of peat and organic soils. The von Post system shows strong correlations of classification of the physical peat properties to the engineering properties. These physical properties include: the extent of humification (decay of plant matter) (ASTM D5715), the predominant plant, the content of fibres (ASTM D1997), the classification of bulk unit weight/density (ASTM D4531), water content (ASTM D2974), specific gravity (ASTM D854), pH (ASTM D2976), Atterberg limits (ASTM D4318) ( Hendry, 2011). The Atterberg limit is not applicable to all types of peat because liquid limit and plastic limits cannot be determined for the more fibrous peats (Hobbs 1986).
17
Table 2. 3: The Von Post Scale of Humification (Von and Granlund, 1926)
Degree of Humification
Decomposition Plant Structure Content of amorphous material Material extruded on squeezing (passing between fingers) Nature of residue
H1 None Easily
identified
None Clear,
colourless water
-
H2 Insignificant Easily
identified
None Yellowish
water
-
H3 Very slight Still
identifiable
Slight Brown, muddy
water; no peat
No pasty
H4 Slight Not easily
identified
Some Dark brown,
muddy water; no peat
Somewhat pasty
H5 Moderate Recognizable,
but vague
Considerable Muddy water and some peat
Strongly pasty
H6 Moderately
strong
Indistinct (more distinct after
squeezing)
Considerable About one third of peat squeezed out; water dark
brown Fibres and
roots more resistant to decomposition
H7 Strong Faintly
recognizable
High About one half
of peat squeezed out; any water very dark brown
H8 Very strong Very indistinct High About two
thirds of peat squeezed out also some pasty water
H9 Nearly
complete
Almost unrecognizable
- Nearly all the
peat squeezed out as a fairly uniform paste
-
H10 Complete No discernible - All the peat
passes between the fingers; no free water visible
18
2.2.3 Peat Characteristics and Properties
The high annual rainfall and poor drainage are the conditions of peat formation (Leong and Chin, 2000). Peat deposit generally exists at high natural water content and void ratio. This peat soil deposit at high void ratios because plant matters that constitute peat particle are light and hold a considerable amount of water. The specific gravity of peat is relatively small. Hence, it makes the peat grains, plates, fibres or element is light and the particle of peat is porous (Mesri et al., 1997).
Craig (1992) mentioned that the colour of peat usually dark brown or black and with a distinctive odour. The main component of the peat itself is organic matter (Whitlow, 2001). Hence, peat poses many problems because of it is very spongy, highly compressible and combustible in characteristic. This characteristic also made the peat pose its own distinctive geotechnical properties compared with other inorganic soils which are made up by the soil particle only (Deboucha et al., 2008). Kazemian et al. (2011) also highlighted that the fresher the peat, the more fibrous material contains.
The unique characteristics of peat have led to the problems of the construction (Hashim and Islam, 2008a). Melling (2009) stated that peat is one of the softest and problematic soils and it is subjected to instability and massive primary and long-term consolidation settlements. Huat (2004) stated that peat are commonly occurring as extremely soft, wet unconsolidated surficial deposits that are integral parts of the wetland systems. This peat soil also has the mechanical behaviour which is different from the other mineral soils such as clay which is high porosity, extremely compressible, strong dependence on permeability and porosity, large change in properties under stress, high degree or spatial variability in properties, fibrosity and high strength due to fibre reinforcement. Hence, peat is considered unsuitable for supporting the foundation in its natural state (Hashim and Islam, 2008a). The content of peat soil varies from location to location due to the factor such as origin fibre, temperature and humidity (Huat et al, 2009).
19
different properties. Noto (1991) explained that peat has extremely high water content and the wet density of peat approximates the density of water, as the main constituent of peat is dead vegetable matter.
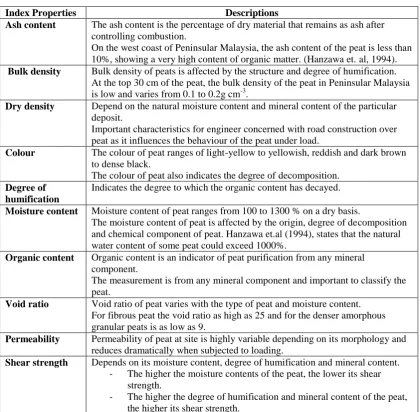
[image:36.595.110.531.335.747.2]Hobbs (1986) and Edil (1997) as cited in Huat (2004) states that the physical characteristics such as colour, degree of humification, water content and organic content should be included in a full description of peat. The physical properties of peat are influenced by main component of its formation such as organic content, moisture and air. When one of these component changes, it will result in the changes of the whole physical properties of the peat soil. Table 2.4 shows the index properties for peat.
Table 2. 4: Index Properties of Peat (Munro, 2004)
Index Properties Descriptions
Ash content The ash content is the percentage of dry material that remains as ash after controlling combustion.
On the west coast of Peninsular Malaysia, the ash content of the peat is less than 10%, showing a very high content of organic matter. (Hanzawa et. al, 1994). Bulk density Bulk density of peats is affected by the structure and degree of humification.
At the top 30 cm of the peat, the bulk density of the peat in Peninsular Malaysia is low and varies from 0.1 to 0.2g cm-3.
Dry density Depend on the natural moisture content and mineral content of the particular deposit.
Important characteristics for engineer concerned with road construction over peat as it influences the behaviour of the peat under load.
Colour The colour of peat ranges of light-yellow to yellowish, reddish and dark brown to dense black.
The colour of peat also indicates the degree of decomposition. Degree of
humification
Indicates the degree to which the organic content has decayed.
Moisture content Moisture content of peat ranges from 100 to 1300 % on a dry basis.
The moisture content of peat is affected by the origin, degree of decomposition and chemical component of peat. Hanzawa et.al (1994), states that the natural water content of some peat could exceed 1000%.
Organic content Organic content is an indicator of peat purification from any mineral component.
The measurement is from any mineral component and important to classify the peat.
Void ratio Void ratio of peat varies with the type of peat and moisture content. For fibrous peat the void ratio as high as 25 and for the denser amorphous granular peats is as low as 9.
Permeability Permeability of peat at site is highly variable depending on its morphology and reduces dramatically when subjected to loading.
Shear strength Depends on its moisture content, degree of humification and mineral content. - The higher the moisture contents of the peat, the lower its shear
strength.
- The higher the degree of humification and mineral content of the peat,
20
[image:37.595.110.533.298.489.2]The water content of peat researched in West Malaysia ranges from 200 to 700 % (Huat et al. 2004). Zainorabidin and Ismail (2003) highlighted that for peat in Johore, the water content can reach up to 500% with the unit weight ranges from 7.5 to 10.2 kN/m3. Unit weight of the peat is typically lower compared to inorganic soils. A range of 8.3 – 11.5kN/m3 is common for a unit weight of fibrous peat in West Malaysia. The organic content in the range of 65 % to 97 % and the Atterberg limit was in the range of 200 % to 500 % as reported by Huat (2004). The detail of the properties of peat soil in Malaysia is as summarized in Table 2.5.
Table 2. 5: Properties of Peat Soil in Malaysia
Soil Deposit West Malaysia Peat and Organic Soil
East Malaysia Peat and Organic Soil
Johore Hemic Peat
Natural Water Content, w (%)
200-700 200-2207 230 – 500
Liquid Limit, LL (%) 190-360 210-550 220- 250
Plastic Limit, PL (%) 100-200 125-297 -
Plasticity Index, PI (%) 90-160 85-297 -
Specific Gravity, (Gs) 1.38-1.70 1.07 – 1.63 1.48 – 1.8
Organic Content (%) 65-97 50-95 80 -96
Unit Weight (kN/m3) 8.3 – 11.5 8.0-12.0 7.5 – 10.2
Undrained Shear Strength (kPa)
8-17 8.0 – 10.0 7- 11
Compression Index, Cc 1.0-2.6 0.5-2.5 0.9 – 1.5
Refs. Huat (2004) Huat (2004) Zainorabidin and
Ismail (2003)
2.3 Sand
2.3.1 Definition and Formation
21
2.3.2 Classification and characterization
Sand classification was based on two major groups which is coarse and fine. Sand is classified as coarse sand because having particle sizes >0.06 mm. Their grains will be rounded or angular and usually consists of fragments of rock or quartz or jasper, with iron oxide, calcite, and mica often present.
[image:38.595.118.521.380.577.2]The British Soil Classification System (BSCS), in BS 5930: 1981 states that sand particles are between 0.06 mm to 2 mm. Unified Soil Classification System (USCS) under ASTM D2487, the grain size of sand would be in the range of 75µm to 4.75µm. The sand feels gritty when rubbed between the fingers. Table 2.6 shows the relationship between the USCS and the BSCS classification system.
Table 2. 6: Soil Classification System
22
allowing free movement of water and air. Therefore, sandy soils are well drained and well aerated.
Terzaghi (1925) stated that sand has a volume of voids about 50 percent of the total volume, did not shrink in drying, has negligible cohesion when clean, not plastic and compress almost immediately when load is applied to the surface.
2.4 Behaviour of Soil under Static Loading 2.4.1 Settlements
The load–deformation relationship for soil is usually complex and varies widely with different soil. This settlement problem plagued engineers and builders for a long time. For example, the tower of Pisa and some structures in Mexico City as the Palace of Fine Arts and the Tower of Latino Americana are known not because of their architectural features but rather for the obvious effect of the settlement. The settlement damages are still occurring, and it has become a continuing challenge to the geotechnical engineers (Cernica, 1995). This load-deformation behaviour is dependent on the interaction between the structure and the soil on which it is founded (Mangal, 1999). Most of the engineering structure was direct contacted with the ground. The process in which the response of the soil influences the motion of the structure and the motion of the structure influences the response of the soil is termed as soil-structure interaction (SSI).
2.4.1.1 General
23
ground movement (Whitlow, 2001). Whitlow (2001) stated that there are several possible causes of settlement which are:
(a) Static loads which are imposed by the weight of a structure or an embankment.
(b) Dynamic or transient loads which are produced by machinery or moving loads on roads or airfield pavements, pile driving, blasting, etc.
(c) Changes in moisture content, for example from seasonal fluctuations in the water table.
(d) Rainfall and evaporation or the absorption of the water by the roots or larger trees.
(e) The effect of nearby construction such as excavation, pile driving, subsidence of mines and dewatering may also be significant.
(f) Ground movement on earth slopes such as erosion, landslide or slow creep.
Cheng (1998) cited that although there are several possible causes of settlement, probably the major causes are compressive deformation of soil beneath a structure. This compressive deformation generally results from the reduction in void volume, accompanied by rearrangement of soil grains and compression of the material in the voids. For the dry soil, it voids are filled with air that is compressible. So, the rearrangement of soil grains can occur rapidly. In the saturated soil, its voids are filled with incompressible water. This water must be extruded from the soil mass before soil grains can rearrange themselves. In soil of high permeability (coarse grained soil), the process requires a short time interval for completion and settlement occurs by the time of construction is complete. In soil with low permeability (fine grained soil), the process requires a long time interval for completion and resulted in settlement occurring very slowly.
For soil, the load – deformation relationship is usually complex, varying widely with different soils and particularly in the plastic range of cohesive soils, where time plays a major role. The settlement increases in magnitude with an increase in load, although not linearly (Cernica, 1995). Settlement is the direct result of reduction of volume of a mass. This reduction could be attributed to the following factors:
24
(b) Compression of the soil particles (c) Compression of air within the voids.
Surface loading results in under soil stresses in horizontal and vertical direction. Consolidation also occurs in both the horizontal and the vertical direction. But, the vertical compression or consolidation is the largest, and it is the most important component (Cernica, 1995).
Kazemian et al., (2011) stated that the compressibility of soil generally consists of three stages namely initial compression, primary settlement, and secondary compression. The total settlement of a foundation can be given as:
S
t= S
i+ S
c+ S
s (2.1)where, St= expected total settlement
Si = immediate settlement Sc = primary settlement
Ss = secondary compression
2.4.1.2 Sand
The immediate settlement or elastic settlement occurs during a fill or a structural loading. It is caused by a static load and occurs essentially at the same time as these loads are applied to the soil (Brennon, 2007). Kazemian et al. (2011) mentioned that this immediate settlement occurs in all types of soil and mainly due the compression of gas within the pore spaces and the elastic compression of soil grains. This immediate settlement is important to granular soil. The settlement may be expressed as:
S
i= ∆
σ
(
α
B
′)
1−µs2168
REFERENCES
Andriesse, J.R. (1974). Tropical lowland peats in Southeast Asia, Kon. Inst. Voor de Tropen, Amsterdam, 63 pp.
Arvidsson, J. And Keller, T. (2007). Soil Stress as Affected by Wheel Load and Tyre Inflation Pressure. Soil & Tilage Research 96, 284-291.ELSEVIER.
Bathurst, R. J. And Jarret, P. M., (1988). Large-Scale Model Tests of Geocomposite Mattresses over Peat Subgrades. 28-36. Transportation Research Record.
Brennon, S. (2007). Best Available Sciences Report for Peat Settlement –Prone Geological Hazard Areas. Draft Best Available Sciences Report.
Cernica N. J. (1995). Geotechnical Engineering Soil Mechanics. John Wiley & Sons, Inc. Singapore.
Chan, C.M., Wong, P. Y., Lee, C. C. (2010). Subsidence Control of Construction on Soft Soils with “Akar Foundation”. Modern Applied Science. Vol. 4, No. 8: August 2010.
Cheng Liu, J. B. (1998). Soil and Foundations. 4th Edition. Upper Saddle River, New Jersey: PRENTICE HALL.
Coduto, D. P. (2001). Second edition foundation design pronciples and practices. Ney Jersey: Prentice Hall.
Colleselli, F., G. Cortellazzo and S.Cola (2000). Laboratory Testing of Italian Peat Soils In Geotechnics of High Water Content Materials, ASTM STP 1374, Edil, T.B. and P.J. Fox (Eds.), American Society for Testing and Materials, West Conshohocken, PA.
Craig, R.F. (1992). Soil Mechanics. 5th Edition. London: Chapman & Hall.
Culshaw, F. B. (2001). Problem soils: a review from a British Perspective. In E. M. I. Jefferson, Problematic soils (p.1). London: Thomas Telford.
Das, M.B. (2010). Principle of Geotechnical Engineering. 7th Edition. CENGAGE Learning.USA.
169
David, M. W., (2004). Geotechnical Modelling. Page 300-304. Spon Press. Taylor & Francis Group. London and New York.
Deboucha S, Hashim R, and Alwi A (2008). Engineering properties of stabilized tropical peat soils. Electron. J. Geotechn. Eng., 13E.
Demir, A., Ornek, M., Laman, M., Yildiz, A., and Misir, G. (2009). Model Studies of Circular Founfations on Soft Soils. Geotechnics of Soft Soils- Focus on Ground Improvement- Karstunen & Leoni (eds). Taylor & Francis Group, London.
Duraisamy, Y. and Huat , B. B.K. (2008). Method of Utilizing Cheap Land for Infrastructure Development, ICCBT.
Duraisamy,Y., Huat, B.B.K. and Aziz, A. A. (2007). Engineering Properties and Compressibility Behavior of Tropical Peat Soil. American Journal of Applied Sciences , 4 (10): 768-773.
Edil, T.B., and Dhowian, A.W., (1980). Consolidation Behaviour of Peats. Geotech. Testing J., 3(3): 105-114.
Edil, T.B. (2003). Recent Advances in Geotechnical Characterization and Construction over Peats and Organic Soils. Proceeding 2nd International Conference on Advances in Soft Soil Engineering and Technology. Putrajaya, Kuala Lumpur, Universiti Putra Malaysia.
Egawa, T., Nishimoto, S., and Tomisawa K. (2004). An Experimental Study on the Seismic Behaviour of Embankments on Peaty Soft Ground through Centrifuge Model Tests. August 1-6.13th World Conference on Earthquake Engineering, Vancouver, B.C., Canada. Paper no. 36.
Forestry Civil Engineering (2010). Floating Roads on Peat. Scottish Natural Heritage. A report to Wind Farm Developments. Scotland.
Gofar, N., (2006). Determination of Coefficient of Rate of Horizontal Consolidation of Peat Soil.Laporan Projek Penyelidikan Fundamental Vot 75210.Fakulti of Civil Engineering, Universiti Teknologi Malaysia.
170
Hashim, R., and H., M. S. Islam,(2008a). A Model Study to Determine Engineering Properties of Peat Soil and Effect on Strength after Stabilisation. European Journal of Scientific Research , ISSN 1450-216X Vol.22 No.2 (2008), pp.205-215.
Hashim, R. and Islam, S. (2008b). Properties of Stabilized Peat by Soil-Cement Column Method. EJGE , Vol. 13, Bund. J.
Hanrahan, E. T. (1954). An Investigation of Some Physical Properties of Peat. Geotechnique, London, England, 4(2): 108-123.Cited in Gofar,N., (2006).
Hanzawa H., Kishida T., Fukasawa T., and Asada H. (1994), A Case Study of the Application of Direct Shear and Cone Penetration Tests to Soil Investigation, Design and Quality Control for Peaty Soils. Soils and Foundations, 1994, Vol. 34, No. 4, pp. 13–22.
Hendry, M.T., (2011). The Geomechanical Behaviour of Peat Foundations below Rail-Track Structure. Thesis Degree of Doctor of Philosophy in Civil Engineering, University of Saskatchewan, Saskatoon, Canada.
Huat, B.B.K., Asadi,A., and Kazemian,S., (2009). Experimental Investigation on Geomechanical Properties of Tropical Organic Soils and Peat. American J. of Engineering and Applied Sciences , 184-188.
Huat, B. B.K. (2004). Organic and Peat Soils Engineering . Universiti Putra Malaysia Press, Serdang, Malaysia, pp. 20-80.
Huat, B.B.K., S. Kazemian, A. Prasad and M. Barghchi (2011). A State of Art Review of Peat: General Perspective. Int. J. Phys. Sci., 6: 1988 -1996.
Ismail, M. A. (2010). Study on Properties of Peat Soil in Pontian, Johor. Degree Thesis. UTHM.
Ismail, A. B. (1984). Characterization of Lowland Organic Soil in Peninsular Malaysia. Pro Workshop on Classification and Management of Peat in Malaysia. Ed. Pushprajah. Mal Soil Sc. So.
Kalantari, B., and Huat B. B.K. (2009). Load- Bearing Capacity Improvement for Peat Soil. European Journal of Scientific Research. Vol. 32 No. 2 pp 252-259.
171
Kirby, J. M. (1999). Soil Stress Measurement. Part II. J. Agric. Eng. Res. 73. 141 - 150
Kolay, P.K., Sii, H. Y and Taib, S.N.L.(2011). Tropical Peat Soil Stabilization using Class F Pond Ash from Coal Fired Power Plant. International Journal of Civil and Environmental Engineering.3:2.
Konstankiewicz, K., and Pytka, J., (1998). Investigations of Stress Deformation in Soil under Different Loading Processes using Mechatronics and Laser Techniques. In : Proceedings of the International Conference on Agricultural Engineering. Oslo, Norway. Pp 932-933.
Kumasari, N., and Miglani, A. (2013). Plane Strain Deformation of a Poroelaastic Half-Space in Welded Contact with an Isotropic Elastic Half Half-Space. International Journal of Sciences and Technology. Volume 2, No.1.
Lea, N., D. and Browner, C. 0. (1963). Highway Design and Construction Over Peat Deposits in the Lower British Colombia. Highway Research Record, (7): 1-32. Cited in Gofar,N., (2006).
Lehtonen, V., (2011). Instrumentation and Analysis of a Railway Embankment Failure Experiment. A general summary. Research reports of the Finnish Transport Agency.29/2011.
Leong, E.C. and Chin, C.Y., (2000). Geotechnical characteristics of peaty soils in Southeast Asia. International Conference on Geotechnical and Geological Engineering, GeoEng 2000, Australia.
Long, M., (2005). Review of Peat Strength, Peat Characterisation and Constitutive Modelling of Peat with Reference to Landslides. Studia Geotechnica et Mechanica, Vol. XXVII, No. 3-4.
Masirin, I. (2007). Encapsulated Road Pavement On Difficult Ground Condition. PhD Thesis. UEL, London.
Mangal, J.K., (1999). Partially–Drained Loading of Shallow Foundation on Sand. Phd Thesis.University of Oxford.
Meguid, M.A., O. Saada, M.A. Nunes , J. Mattar, (2008). Physical modelling of tunnels in soft ground: A review. ELSEVIER , 185–198.
172
Mesri, G, Ajlouni M (2007). Engineering properties of fibrous peats. J. Geotech. Geoenv. Eng., 133(7): 851-866.
Mesri, G. , Stark, T. D., Members, ASCE, Ajlouni,M.A., Student Member ASCE, and Chen, C.S., (1997). Secondary Compression of Peat with or without Surcharging. Journal of Geotechnical and Geoenvironmental Engineering. 411.
Montanarella, L. R. (2006). The distribution of peatland in Europe. International Mire Conservation Group and International Peat Society, (p. 2).
Munro, R., (2004). Dealing With Bearing Capacity Problems on Low Volume Roads Constructed on Peat. Northen Periphery.ROADEX II.p. 5- 29, 34 – 63.
Munro, R., and MacCulloch, F., (2006). Managing Peat Related Problems on Low Volume Roads. ROADEX III Project.
Noto, S. (1991). Peat engineering handbook. Civil Engineering Research Institute.
Pytka, J. (2001). Load Effect upon Soil Stress and Deformation State in Structured and Disturbed Sandy Load for Two Tillage Treatments. Soil & Tillage Research 59, 13-25. ELSEVIER.
Radforth, N.W., (1969), The Muskeg Engineering Handbook. National Research Council of Canada.
Schuller, H., and Krameter, P. (2009). Construction of a Lighweight dam on Organic Soils – FE – Analyses and Practical Experiences. Geotechnics of Soft Soils- Focus on Ground Improvement – Karstunen & Leoni (eds). Taylor & Francis Group, London. ISBN 978-0-415-47591-4.
Sekhar C., D. R. (2002). A critical Review on Idealization and Modeling for Interaction among Soil- Foundation – Structure System. Elsevier , 1579 - 1594.
Shahin, M. A., Jaksa, M. B., and Maier, H. R., (2000). Predicting the Settlement of Shallow Foundation on Cohesionless Soils using Back-Propagation Neural Networks. Research Report. Department of Civil & Environmental Engineering. University of Adelaide.
Schmertmann, J. H. (1970). Static cone to compute static settlement over sand. J. Soil Mech. & Found. Div., ASCE, 96(SM3), 7302-1043.
173
Tauuffic, R., D. Moeljani, D. Suhaimi (2002). The Bereng Bengkel Test Site. Embankments and creep problems. Final report.
Terzaghi, C., (1925). Principles of Soil Mechanics: V-Physical Difference Between Sand and Clay. Vol. 95, No.23.Geotechnical Special Publication NO. 118Volume one. A History of Progress. Selected U.S. Papers in Geotechnical Engineering.ed. Marr,W.A.
US Army Corps of Engineers (1995).Engineering and Design: Instrumentation of Embankment Dams and Leeves.Engineer Manual. EM1110-2-1908.
Vincent, T.C.K., (2009). Sustainable Construction on Soft Soil in Sibu: A Practical Perspective. ESP. Sibu, Sarawak.
Vinogradov, V.V., Yakovleva, T.G., Frolovsky, Y.K., and Zaitsev, A.A. (2006). Physical Modelling of Railway Embankments on Peat Foundations. Physical Modelling in Geotechnics- 6th ICPMG‟06- Ng, Zhang & Wang (eds). Taylor & Francis Group, London.
Whitlow, R. (2001). Basic Soil Mechanics. 4th Edition. England: Pearson Education Ltd.
Wartman, J. (2006). Geotechnical Physical Modeling for Education: Learning Theory Approach. Journal of Professional Issues in Engineering Education and Practice @ ASCE.
Witkowska, W., B., Bieganowski, A. and Rovdan, E., (2002). Water- Air Properties in Peat, Sand and Their Mixtures. 313-318. International Agrophysics.
Wojciech, S., and Malinowska, E., (2006). Surcharging as a Method of Road Embankment Construction on Organic Soils. IAEG2006. Paper number 403. The Geological Society of London.
Wong, L.S., Hashim, R., and Ali F. H. (2009). A Review on Hydraulic Conductivity and Compressibility of Peat. Journal of Applied Sciences 9 (18): 3207-3218. ISSN 1812-5654
174
Zainorabidin, A., and Wijeyesekera, D. C., (2007). Geotechnical Challenges with Malaysian Peat. Advances in Computing and Technology, The School of Computing and Technology 2nd Annual Conference. Proceedings of the AC&T, pp.252-261.University of East London. London.
Zainorabidin,A. (2010). Static and Dynamic Characteristics of Peat with Macro and Micro Structure Perspective. Thesis PhD. University of East London.
Zhang, L. M. (1999). Settlement patterns of soft soil foundations under embankments. Canadian Geotechnical Journal , 774 - 781.