An Analysis of Eye Movement and Cognitive Load about
the Editorial Design in Elementary Science Textbook
Seong-un Kim, Sung-man Lim, Eun-ae Kim, Il-ho Yang
*Department of Elementary Science Education, Korea National University of Education, South Korea
Copyright©2016 by authors, all rights reserved. Authors agree that this article remains permanently open access under the terms of the Creative Commons Attribution License 4.0 International License
Abstract
This study is for the implication of editorial design in science textbooks which are designed for student-centered instruction, when the elements of the editorial design are different, we focus on how the students’ eye movement and cognitive load change. For this, we produced a new book for 5th grade students in elementary school that is modified by the elements of the editorial design about the visual materials and the alignment of the official textbook. Then we analyzed the eye movement and the cognitive load with an eye-tracker. As a result, first, when the alignment of the body of the textbook was different, there was no significant difference whether it was justified fully or aligned left. Second, the back-up information about the visual materials in the textbook helped students have longer attention span and understand the learning content more.Keywords
Science Textbook, Eye-tracking, Cognitive Load, Editorial Design1. Introduction
Science textbooks have developed refer to the curriculum are an elemental data used for science education to guide the teaching content and the exploratory function prescribed by the curriculum all over the world [8][15]. For this reason, the textbook have to be filled with the content effectively, it needs the design to be effectual to learning [9].
However, the editorial design of the official textbook is decided by the textbook development experts, the discussions about the proper editorial design to the real users of the textbook take place between a few textbook development experts academically [10].
2. Alignment Ways and Caption of
Visual Materials
There are two alignment ways preferred, fully justified and left aligned way. Fully justified way is used at the main body of the text mostly and has highly readable typography
[11]. And left aligned way is used effectively when there are too many texts in a page or lines have narrow widths [11]. In case of oversea researches, time taking to read is no significant difference between two ways [7][17], and preferences for readers also are similar[1]. On the other hand, it is hard to find domestic researches about the display way for readability.
Traditional textbooks need an efficient editorial design. Because images are enlarged too much to fill the space and there are no harmonic proportion and placement between texts and visual materials as a result of the reproduction. Besides sometimes there are no descriptions about images, and it is hard to figure out correlation between texts and images. Resultingly they reduce the effectiveness of learning [9]. Accordingly, it needs to use more caption representing the visual materials for effective use.
Based on these literatures, eye movement and cognitive load will be analyzed to get implications for effective learning according to presentation of detail explanation about the visual materials and alignment.
3. Methods
3.1. Participants
Participants in the experiment were 22 voluntary 5th grade students in elementary school where is in the central district of Korea. Among them, only 16(5 boys and 11 girls) passed the eye-tracking calibration, their eye movements were measured.
3.2. Materials
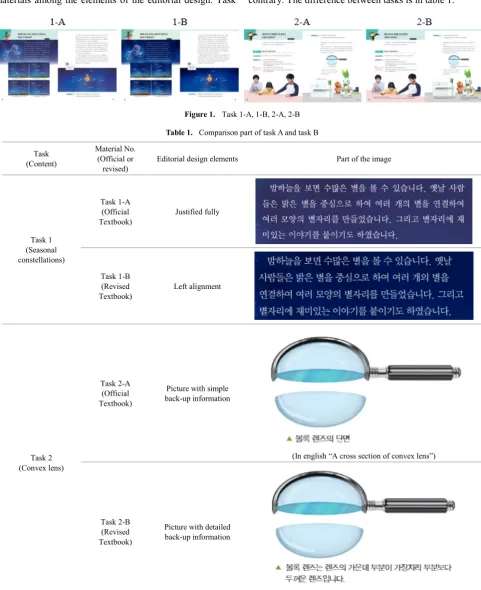
The editorial design elements on tasks are alignment and back-up information of the visual materials. Materials had to contain new content that students had no learning experience before. So Seasonal constellations and Convex lens in textbook for 6 grades were chosen for tasks’ content.
Text images were as follows: 1-A, 1-B, 2-A, 2-B.
The body of the task 1-A fully justified. And task 1-B is the revised textbook image. This image is presented left aligned. Other typography elements are kept as they are.
Task 2 is to change the back-up information of the visual materials among the elements of the editorial design. Task
[image:2.595.62.544.134.725.2]2-A is the official textbook image. In the task 2-A the back-up information had little to no explanation. And task 2-B is the revised textbook image. This image had very detailed back-up information every visual materials on the contrary. The difference between tasks is in table 1.
Figure 1. Task 1-A, 1-B, 2-A, 2-B
Table 1. Comparison part of task A and taskB
Task (Content)
Material No. (Official or
revised) Editorial design elements Part of the image
Task 1 (Seasonal constellations)
Task 1-A (Official
Textbook) Justified fully
Task 1-B (Revised
Textbook) Left alignment
Task 2 (Convex lens)
Task 2-A (Official Textbook)
Picture with simple back-up information
(In english “A cross section of convex lens”)
Task 2-B (Revised Textbook)
Picture with detailed back-up information
3.3. Procedure
An eye tracker X2-60 made by Tobii was used to record participants’ eye-movements. Participants were divided into two groups. Each group is participated in one official textbook images and one revised textbook images. That is, 8 participants showed the 1-A, 2-B and other 8 participants showed 1-B, 2-A.
Experiments order was as follows: calibration → collecting baseline to measure pupil diameter → Task 1 → Task 2 → collecting RVP (Retrospective verbal protocol) → preference survey. Each task didn’t fix the limit time, students read freely. After doing task, students were checked for understanding of the task and collected RVP presenting gaze plot. At last, they were interviewed about preference between official textbook and revised textbook.
3.4. Analysis
This study was to analyze how to read the text in the science textbook, therefore fixation minimum duration was set at 80ms. The eye-tracking equipment, tobii studio 3.2.3 allowed analysis of eye movement. Data collected with this equipment included Relative duration heatmap, Gaze plot,
AOI Total visit duration and Relative duration gaze opacity. For analysis of cognitive load, experiments instructional time and pupil diameter were compared and analyzed. Task performance time was used as indirect measure of cognitive load [3], reading speed was used as performance index in the study of text readability[6]. And pupillometrics, neurophysiological method were used to measure cognitive load [13]. Lastly reliability was improved by analyzing task understanding test, RVP data and interviewing participants.
4. Results
4.1. Task 1– Analysis of eye movement and cognitive load according to alignment
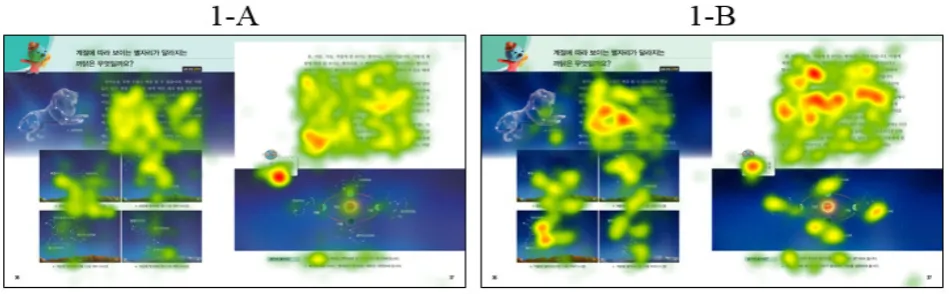
4.1.1. Relative duration heatmap comparison analysis Figures 2 provides relative duration heatmap for how students attended to the text. 1-A shows yellow and green overall. It means that participants spend similar time all over the text. Participants in 1-B fixated on the visual materials more than 1-A, and spend more time on the text.
Figure 2. Relative duration heatmap of task 1
4.1.2. Cognitive load comparison analysis
Text part was put as AOI in order to find a significant difference statistically in reading time according to the alignment. A Mann-Whitney U test was computed to compare an AOI Total visit duration on the task of 1-A and 1-B.
Table 2. Mann-Whitney U test about reading time of task 1
N mean standard deviation Z approximate significant level correct significant level
1-A 8 0.60 0.1340
-.945 .345 .382
1-B 8 0.53 0.1501
AOI Total visit duration according to the alignment is not significant. Result of RVP also shows that it is easy for participants to read the text. They paid more attention to a main concept regardless of alignment.
[image:3.595.67.542.348.495.2]Secondly, the Mann-Whitney U test was computed to find a significant difference in a pupil diameter while participants execute the task of the alignment.
Table 3. Mann-Whitney U test about pupil diameter of task 1
N mean standard deviation Z approximate significant level correct significant level
left pupil 1-A 8 1.194676 0.145237 .210 .834 .878
1-B 8 1.190027 0.079303
right pupil 1-A 8 1.199264 0.147381 -.210 .834 .878
[image:3.595.67.547.675.742.2]No significant effect was found in either different alignment or task understanding test. In the result of analysis about RVP data and preference, every participant could not recognize the difference of the alignment, and they showed opposed preferences (5 prefer fully justified way, 7 prefer left aligned way.).
To sum up, it did not greatly influence students’ eye movement and cognitive load to perform the task according to the alignment fully justified or left aligned.
Carter et al.[5] said that too many soft hyphens in fully justified way disrupt reading, they thought left aligned way helps to read naturally. However, this phenomenon appears in English reading, Korean words don’t use the hyphens and spacing between letters won’t be wide excessively in fully justified way. Consequently the body of the textbook with Korean words, there is no big difference of readability whether it is fully justified or left aligned. It is supported by another study like that the style of printing make no
difference for readers of reading speed[7][17] and preference[1].
4.2. Task 2– Analysis of eye movement according to back-up information about visual materials
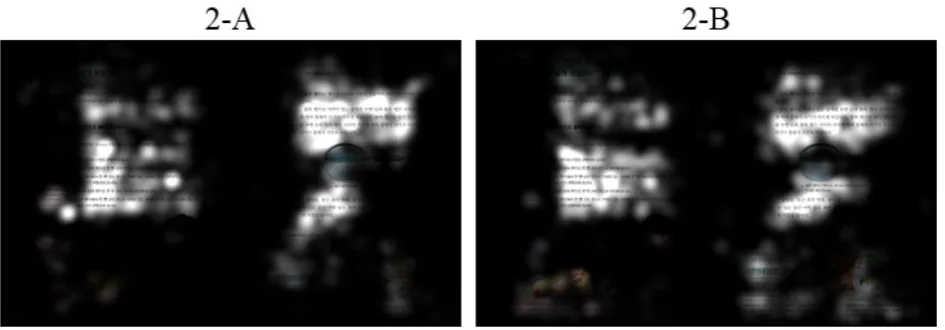
4.2.1. Relative duration gaze opacity comparison analysis Figure 3 provides relative duration gaze opacity for how students attended to the text.
[image:4.595.70.543.307.472.2]2-A shows that most of the participants spend more time reading the text, bright part and less time to look at the visual materials, dark right-lower part. Participants in 2-B spend more time looking at the visual materials reading the back-up information as compared with 2-A participants. Because visual material parts, left-lower and right-lower part are bright relatively.
Figure 3. Relative duration gaze opacity of task 2
4.2.2. AOI Total visit duration comparison analysis
[image:4.595.63.548.575.649.2]Visual material parts were put as AOI in order to find a significant difference statistically in fixation duration depending on back-up information about visual materials. The Mann-Whitney U test was computed to compare an AOI Total visit duration on the visual materials of 2-A and 2-B.
Table 4. Mann-Whitney U test about AOI Total visit duration of visual materials of task 2
N mean deviation standard Z approximate significant level significant level correct
2-A 8 0.1261 0.064723
2.415 .015 .015*
2-B 8 0.2388 0.084758
*p<.05
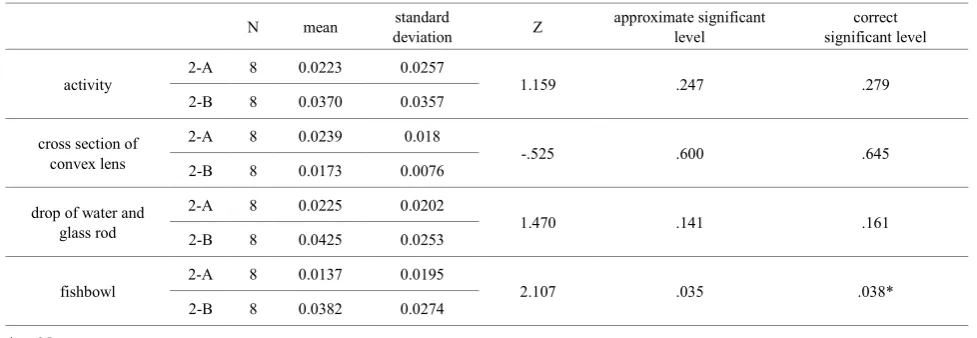
Table 5. Mann-Whitney U test about AOI Total visit duration of each visual material of task 2
N mean deviation standard Z approximate significant level significant level correct
activity 2-A 8 0.0223 0.0257 1.159 .247 .279
2-B 8 0.0370 0.0357
cross section of convex lens
2-A 8 0.0239 0.018
-.525 .600 .645
2-B 8 0.0173 0.0076
drop of water and glass rod
2-A 8 0.0225 0.0202
1.470 .141 .161
2-B 8 0.0425 0.0253
fishbowl 2-A 8 0.0137 0.0195 2.107 .035 .038*
2-B 8 0.0382 0.0274
*p<.05
The result of analysis showed that a significant effect was found: p<.05. It means students pay more attention to the revised image and added back-up information than official textbook and this explanation helps students to learn about scientific phenomenon.
In the result of analysis about RVP data and preference, ratio of that participants in 2-A, official textbook, connect visual materials to learning content syntagmatically is low, and they are not very interested in visual materials but cross section of convex lens. However, participants in 2-B connect visual materials to learning content syntagmatically, they try to understand about scientific phenomenon in visual materials. Finally, nevertheless the result of understanding test has no significant difference, mean value of 2-B participants is higher.
Sweller et al.[16] insisted that the schemas associated with high element interactivity material make students understand the material, feel low cognitive load and finish quickly. And illustrations can help readers to focus their attention on explanative information in text. They lead to high learning achievement, reduction in cognitive load and fast task execution[4][12]. In addition, Mwangi and Sweller[14] contrasted split-attention and integrated work examples and investigated the influence of generating self-explanations. Children presented with integrated work examples outperformed those presented with split-source examples. Consequently, it is very important to help students understand the science content because using visual materials are integrated with learning content is very efficient detailed explanation is located closely with visual materials.
5. Conclusions
Students’ eye movement and cognitive load of editorial design elements are compared and analyzed. First, alignment does not influence eye movement and cognitive load. Unlike oversea research, left aligned way helps readability[2], Korean words have no big difference which fully justified
and left aligned. English words use hyphens and have sesquipedalian, it makes hard to read. It needs further research for science textbook for middle school because contain it lots of content.
Second, students pay more attention to visual materials with detailed explanation, back-up information helps students to understand learning content. Therefore visual materials in the textbook have to contain further elucidation. It can reduce cognitive load and make students learn visual materials integrated with concept description
There is a limitation in the present study. Elements of editorial design that influence on students’ cognitive load are various. However, in this study just alignment and back-up information were analyzed. For development of efficient textbook, another editorial design element that reduces cognitive load has to be cautiously researched. Also, future studies need to investigate the issue with positivistic case studies, because learning has relevancy not only to external structure like textbook but also to internal structure.
REFERENCES
[1] Becker, D., Heinrich, J., von Sichowsky, R., & Wendt, D. 1970. Reader preferences for typeface and leading. Journal of Typographic Research, 4, 61–66.
[2] Carter, R., Day, B., & Meggs, P. B. 1993. Typographic design: Form and communication. (2nd edn). New York: John Wiley & Sons.
[3] Chandler, P., & Sweller, J. 1992. The split-attention effect as a factor in the design of instruction. The British Journal of Educational Psychology, 62, 233-246.
[4] Cierniak, G., Scheiter, K., & Gerjets, P. 2009. Explaining the split-attention effect: Is the reduction of extraneous cognitive load accompanied by an increase in germane cognitive load?. Computers in Human Behavior, 25, 315-324.
[image:5.595.61.550.91.260.2]Journal of Educational Multimedia and Hypermedia, 20(1), 21-42.
[6] van Gog, T., & Scheiter, K. 2010. Eye tracking as a tool to study and enhance multimedia learning. Learning and Instruction, 20(2). 95-99.
[7] Gregory, M., & Poulton, E.C. 1970. Even versus uneven right-hand margins and the rate of comprehension in reading. Ergonomics, 13(4), 427–434.
[8] Hubisz, J. 2003. Middle-school texts don't make the grade. Physics Today, May 2003, 50-54.
[9] Im, H. H., & Choi, J. H. 2012. How to share visual-perceptual concepts of the editorial design in school textbooks. Journal of Brand design Association of Korea, 10(4), 285-302. [10]Lee, J. S., & Shin, D. H. 2012. The unit-introduction
development of Korean textbook in the elementary school through the eye tracking method. Journal of Elementary Korean Education, 49, 133-159.
[11]Lee, K. B., & Hong, Y. I. 2010. Practical study for developing graphic design adopting systematic theories of typography. Journal of Korea Contents Society, 10(11), 80-91.
[12]Mayer, R. E. 1989. Systematic thinking fostered by illustrations in scientific text. Journal of Educational Psychology, 81, 240-246.
[13]Megaw, T. 2005. The definition and measurement of mental workload. Evaluation of human work: A practical ergonomics methodology, 525-551. London: Taylor and Francis. [14]Mwangi, W., & Sweller, J. 1998. Learning to solve compare
word problems: the effect of example format and generating self-explanations. Cognitive and Instruction, 16, 173-199. [15]Stoffels, N. T. 2005. "There is a worksheet to be followed": A
case study of a science teacher's use of learning support texts for practical work. African Journal of Research in Mathematics, Science and Technology Education, 9, pp.147-157.
[16]Sweller, J., Chandler, P., Tierney, P., & Cooper, M. 1990. Cognitive load as a factor in the structuring of technical material. Journal of Experimental Psychology: General, 119, 176-192.