TRANSFORMER LIFE PREDICTION USING DATA FROM UNITS REMOVED FROM SERVICE
UMMU UMAIRAH BTE MOHAMAD ALI
A project report submitted in partial fulfillment of the
requirement for the award of the degree
Master of Electrical Engineering
Faculty of Electrical and Electronic Engineering
University Tun Hussein Onn Malaysia
vi
ABSTRACT
ABSTRAK
viii
CONTENTS
TITLE i
DECLARATION iii
DEDICATION iv
ACKNOLEDGEMENT v
ABSTRACT vi
ABSTRAK vii TABLE OF CONTENTS viii
LIST OF FIGURES xii
LIST OF TABLES xiv
LIST OF SYMBOLS AND ABBREVIATIONS xv
CHAPTER 1 INTRODUCTION 1.1 Introduction 1
1.2 Problem Statement 2 1.3 Objective 2 1.4 Scope 3
CHAPTER 2 LITERATURE REVIEW 2.1 Transformer background 4 2.2 Literature review of insulation 5 2.2.1 Cellulose structure 5 2.2.2 Mineral oil 7 2.3 Acidation factor 7 2.3.1 Moisture-Water in oil 8 2.3.2 Moisture-Water in paper 8 2.3.3 Oxygen in insulation 8
2.5 Aging of insulation 9 2.6 Transformer winding hot spot determination 12 2.7 Thermal model and life loss equations 14 2.8 Description of Previous Methods in Transformer Life
Estimation 17
2.8.1 Thermal Aging of Distribution Transformers 17 2.8.2 Thermal Aging of Distribution Transformers 18
CHAPTER 3 METHODOLOGY
3.1 Introduction 19
3.2 Loss of life calculation 20
3.3 Mathematical equations explanation 21
3.3.1 Derivation of 𝛩0 21
3.3.2 Derivation of ΔΘΗ 22
3.3.3 Relative ageing rate (V) calculation 24
3.4 Matlab software development 25
CHAPTER 4 DATA ANALYSIS AND RESULTS
4.1 Load and ambient temperature data manipulation 26
4.2 Case study 29
4.2.1 Base scenario investigation 29 4.2.2 Scenario 1 (Peak load day and peak temperature day) 31 4.2.3 Scenario 2 (Highest average load day and highest
average temperature day) 34
4.2.4 Scenario 3 (Highest average load day and same day
average temperature) 38
x
4.3.1.1 Hot-spot factor value 1.5 43
4.3.1.2 Hot-spot factor value 1.7 44
4.3.1.3 Hot-spot factor value 1.9 45
4.3.1.4 Hot-spot factor value 2.1 46
4.3.2 Scenario 3 hot-spot factor investigation 47
4.3.2.1 Hot-spot factor value 1.5 47
4.3.2.2 Hot-spot factor value 1.7 48
4.3.2.3 Hot-spot factor value 1.9 49
4.3.2.4 Hot-spot factor value 2.1 50
4.3.3 Hot-spot factor investigation conclusion 51 4.4 Secondary factors investigation 52 4.4.1 Investigation and derivation of A-factors 53 4.4.2 Derivation of Acidation factor 56 4.4.3 Calculation of Acidation factor 57 4.4.4 Application of Acidation factor 58
CHAPTER 5 CONCLUSION
5.1 Conclusion 61
5.2 Future Work Recommendation 63
REFERENCES 64
APPENDIX 1: Matlab Code 67
APPENDIX 2: Load Data Analysis 70
APPENDIX 3: Ambient temperature data analysis 73
APPENDIX 4: Base scenario results 77
APPENDIX 5: Peak load days table for year 2007 79
APPENDIX 6: Scenario 1 results 81
xii
LIST OF FIGURES
2.1 Cellulose molecular decomposition 6
2.2 Mineral oil structure 7
2.3 Hot-spot of a power transformer is calculated by first
measuring the top-oil temperature. 9
2.4 Transformer Insulation Life 10
2.5 Aging Accelerator Factor 11
2.6 Effect of temperature on paper aging rate 13 2.7 Aging rate (p.u) depending on the hot spot temperature
according to IEEE and IEC. 17
4.1 Ambient Temperature recorded on January 2007 27
4.2 Load recorded on January 2007 27
4.3 Load recorded on December 2007 28
4.4 Loss Of Life - January 2007 30
4.5 Loss Of Life – December 2007 31
4.6 Loss of Life Jan 07 Scenario 1 34
3.7 Ambient temperature recorded March 07 35 3.8 Peak and highest average value of March 2007 35 3.9 Loss-Of-Life vs time Jan 07 Scenario 2 37
4.10 Loss-Of-Life Jan 07 Scenario 3 40
4.11 Results of various scenarios 41
4.12 LOL H.F: 1.5 - Jan 07 Base scenario 43 4.13 LOL H.F: 1.7 - Jan 07 Base scenario 44 4.14 LOL H.F: 1.9 - Jan 07 Base scenario 45 4.15 LOL H.F: 2.1 - Jan 07 Base scenario 46
4.17 LOL H.F: 1.7 - Jan 07 Scenario 3 48
4.18 LOL H.F: 1.9 - Jan 07 Scenario 3 49
4.19 LOL H.F: 2.1 - Jan 07 Scenario 3 50
4.20 Hot-spot factor Vs LOL 52
xiv
LIST OF TABLES
2.1 250MVA Transformer Parameters 16
2.2 Loss of life determined according to IEEE and IEC at same
input data 18
4.1 Results-Base scenario 30
4.2 Representative days for peak ambient temperature 32
4.3 Results – Scenario 1 33
4.4 Representative days for highest average ambient temperature 36
4.5 Results-Scenario 2 37
4.6 Representative days for paired average ambient temperature 39
4.7 Results – Scenario 3 40
4.8 Results – Base scenario H.F:1.5 43
4.9 Results – Base scenario H.F:1.7 44
4.10 Results – Base scenario H.F:1.9 45
4.11 Results – Base scenario H.F:2.1 46
4.12 Results – Scenario 3 H.F:1.5 47
4.13 Results – Scenario 3 H.F:1.7 48
4.14 Results – Scenario 3 H.F:1.9 49
4.15 Results – Scenario 3 H.F:2.1 50
4.16 Hot-spot factor investigation results 51 4.17 A-factor estimated for activation energy of 111 kJ/mole 55 4.18 Decrease in DP value according to a specific type of acid 56 4.19 Acidation factor investigation results 59
LIST OF SYMBOLS AND ABBREVIATIONS
A - Constant
B - Ageing rate constant 𝜽H - Hot spot temperature
F𝐴𝐴 - Ageing acceleration factor
pu - Per unit
IEEE - The Institute of Electrical and Electronics Engineers IEC - International Electrotechnical Commission
θ𝑜𝑖𝑙 - Top oil temperature
Δθ𝐻𝑅 - Rated hot-spot temperature rise above top oil
I - Load current
IR - Rated current
𝐼𝑝𝑢 - Load current per unit θ𝐴 - Ambient temperature
𝛽 - Ratio of load to no-load losses 𝜏𝑜𝑖𝑙 - Top oil time constant
Δθ𝑜𝑖𝑙 −𝑅 - Rated top oil rise over ambient
P𝐸𝐶−𝑅 𝑝𝑢 - Rated eddy current loss at the hot spot location Δθ𝐻−𝑅 - Rated hot spot rise over ambient
𝜏𝐻 - Winding time constant at the hot spot location
L - Loss of life
FEQA - Per unit loss of life factor
m - Winding exponent
CHAPTER 1
INTRODUCTION
1.1 Introduction
The lifetime of transformers is usually considered to be around 30-50 years. A substantial number of transformers were installed worldwide around the 1950s [1]. Some of them are still in use and most of them were recycled. The reason that some of them are still in use is the cost and the most important of all, good maintenance. According to the guide for loading mineral oil immerse transformers, the life expectancy of a transformer operating at 110°C are at a maximum of 180.000 hours or 7500 days, with a normal percentage loss of life at 110°C for 24h at 0.0133% [2]. This of course varies, depended on the type of the transformer.
connected to the transformer. Multiple transformers where is essential to perform the estimation separately for each transformer.
The condition that limits the transformer loading capabilities is the
temperature of the winding and the insulation [3] or more specific, is depended on the average temperature on the hottest spot of the insulation system [4].
1.2 Problem Statement
.
Most UK transmissions transformer which is currently in service has been installed for
40 or even more years. They are approaching the end of their normal operating lifetime.
Ageing equipment is a serious contributing factor to poor system reliability and high
operating costs in many utilities. Moreover, simultaneous transformer installation will
probably lead to simultaneous failure and replacement in the future. The replacement
requires a lot of capital investment and it represents a financial burden for utilities over
coming years. Therefore it is important for utilities to know when to replace ageing
transformers so that the replacement could be scheduled in a manner to lower the cost
and give minimize impact on customers.
1.3 Objective
The main objective of this research is to determine the factors that affect the power transformer life span and to come up with a method of estimating the remaining life of the transformer. Its measureable objectives are as follows:
Calculate the lifetime of transformer base on their actual loading profiles and ambient temperature data.
Study the ageing factors which can affect the operation of transformers
3 1.4Scope
These scopes of this study are:
Literature review of lifetime estimation for transmission transformers; (IEEE & IEC website, searching through key words like “transformer”, “thermal modelling” and “lifetime estimation”).
Understand ageing factors, loss of life equation of cellulose, transformer thermal design, and loading / ambient conditions.
Compile data for operation and specifications of transformer.
Create Matlab programme to calculate the age /loss of life and the temperature critical points monthly and yearly. This will be done with the help of IEC standard equations.
LITERATURE REVIEW
2.1 Transformer background
A transformer consists of the core which provides the path for the magnetic lines of flux, the primary winding which receives energy from the source, the secondary winding which receives energy from the primary and transmits it to the system and finally the enclosure which protects the above from dirt, moisture and mechanical damage [1]. Each winding has a number of turns N which is responsible for the ratio of current and voltage. Equation (2.1) shows the relationship between N, current and voltage.
𝑁1 𝑁2 =
𝑉1 𝑉2 =
𝐼2
𝐼1 (2.1)
Transmission transformers are considered to be the most important apparatus in a power system since without them transmission cannot be achieved.
5 Other methods were examined in the past regarding the calculation of the loss of life of the transformer. However, ageing models in current international standards, such as IEC and IEEE, do not consider the effect of secondary ageing factor such as moisture and oxygen because of limited data. As a result, the models might not accurately predict the lifetime of the transformer. The high cost and the tremendous consequences, in the case of failure, of the transformer are considered to be the main reasons to predict their lifetime. Engineers are trying to develop an approximation which will allow companies to use the transformer until the end of its life. In the case where a wrong estimation is made and a transformer fails during operation, major problems may occur to the grid and other apparatus of the power system. This is the main reason why transformers are divided into categories according to their characteristics and their operating conditions [3, 4].
2.2 Literature review of insulation
Transformer insulation consists mainly of paper and mineral oil. When talk about “loss of life” of a transformer, is actually mean the loss of life of its insulation. Transformer insulation degrades as a function of time and temperature. Due to the fact that temperature distribution is non-uniform throughout the transformer, in our calculations we are going to use the winding hottest spot temperature which is located at the top middle of it. The main component that composes the insulation from the beginning of the transformer’s birth is cellulose which composes the Kraft paper.
2.2.1 Cellulose structure
“Cellulose (C6H10O5) is one of many polymers found in nature” [5]. Wood, paper
clear idea of what cellulose paper is. In Figure 2.1 we can observe the molecular structure and some of its decomposition products.
Figure 2.1: Cellulose molecular decomposition [6]
7 2.2.2 Mineral oil
[image:18.612.251.422.281.372.2]Mineral oil in transformers can be used as insulating and cooling medium. In oil filled transformers water, heat and oxygen are considered to be the catalyst, the accelerator and the active reagent in the oxidation of oil. From the oxidation of oil we have products such as acids, esters and metallic soaps that speed up the decomposition of cellulose insulation, therefore decreasing the lifetime of the transformer [7]. In order to minimize the effect of oxidation, the design of the transformer allows the oil to be renewed during maintenance. In figure 1.2 we can observe the structure of mineral oil.
Figure 2.2: Mineral oil structure [8]
2.3 Acidation factor
2.3.1 Moisture-Water in oil
Transformer’s insulating oil has a low comprehensiveness of water. Despite that, with the rise of temperature we can see that the solubility of it increases, making it a large factor that affects the lifetime of the insulation. We can identify the presence of water in three states. Mostly we can found it in a dissolved state, but several measurement techniques have shown that water also exists in the oil firmly bound to the oil molecules. However, the second state has driven to the third. When moisture level in oil exceeds the saturation value, there will be free water in the tank in the form of drops [10].
2.3.2 Moisture-Water in paper
Water and moisture in paper can be found in four forms. “It can be found as vapour, as free water in capillaries, as imbibed free water and it can be absorbed to surfaces”[10]. When compared to oil, paper has larger concentration in moisture therefore the effect in paper is more severe.
2.3.3 Oxygen in insulation
9 2.4 Hot-spot Temperature
Knowing the precise temperature of the winding hot spot is the single most critical measurement one can make within a transformer. The common winding temperature indicator does not measure winding hot spot or any winding temperature.
[image:20.612.128.560.329.495.2]The top oil temperature is measured and has an additional temperature gradient added to it which is proportional to the square of the winding load. This additional heat is added with a heater coil wrapped around the top oil temperature probe that adds heat with current set up by a current transformer placed on the transformer bushing. This is defined as the winding hot spot gradient or copper rise and is shown in plot below;
Fig. 2.3: Hot-spot of a power transformer is calculated by first measuring the top-oil temperature.
2.5 Aging of insulation
becomes brittle and loses its mechanical strength. If the elevated temperatures are severe, the insulation will no longer be able to maintain its properties, resulting in insulation failure and ending the useful life of the transformer. Side effects of insulation aging include the formation of water and oxygen. However, with new oil preservation systems, these formations can be minimized, leaving the insulation temperature exposure as the controlling parameter for control personnel. In the late 1940’s, it was discovered that the aging of insulation is part of a chemical process. Its reactions vary with temperature according to the Arrhenius equation.
Ko = AeB/(𝜽+273) (2.2)
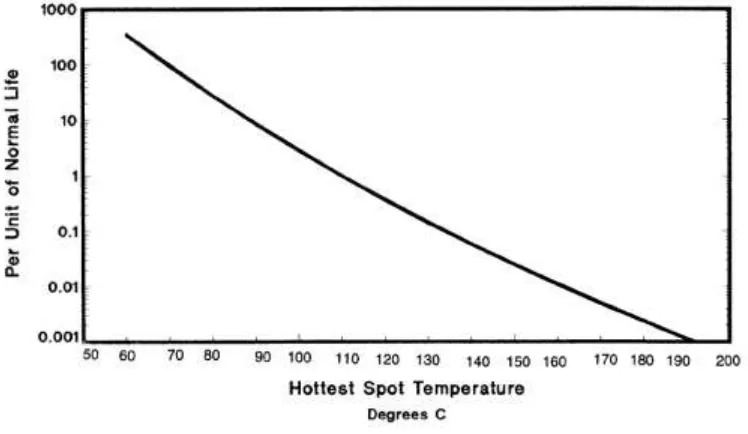
[image:21.612.140.514.368.585.2]The IEEE standard C57.91-1995 translates this equation on a per unit life basis indicated by the curve in Figure 2.3.
11 The equation for per unit life curve is shown below:
Per Unit Life =
9.80 * 10
-18e
[15000 / (𝜽H+273)] (2.3)
[image:22.612.142.504.259.477.2]Where 𝜽H is the hot spot temperature.
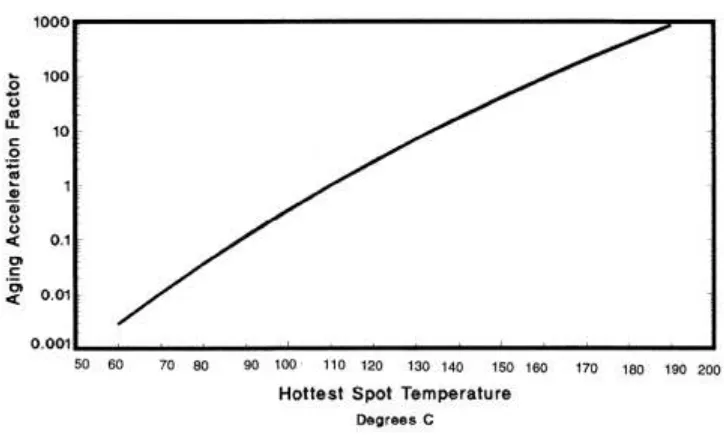
Figure 2.5: Aging Accelerator Factor.
The aging accelerating factor is calculated using the following equation:
F
𝐴𝐴 =𝑒
[ 𝐵 383 −𝐵
θ𝐻 +273]pu (2.4)
2.6 Transformer winding hot spot determination
Loading capability of power transformers is limited mainly by winding temperature. As part of acceptance tests on new units, the temperature rise test is intended to demonstrate that, at full load and rated ambient temperature, the average winding temperature will not exceed the limits set by industry standards. However the temperature of the winding is not uniform and the real limiting factor is actually the hottest section of the winding commonly called winding hot spot. This hot spot area is located somewhere toward the top of the transformer, and not accessible fordirect measurement with conventional methods.
The temperature of solid insulation is the main factor of transformer aging. With temperature and time, the cellulose insulation undergoes a depolymerization process. As the cellulose chain gets shorter, the mechanical properties of paper such as tensile strength and elasticity degrade. Eventually the paper becomes brittle and is not capable of withstanding short circuit forces and even normal vibrations that are part of transformer life. This situation characterizes the end of life of the solid insulation. Since it is not reversible, it also defines the transformer end of life.
13
Figure 2.6: Effect of temperature on paper aging rate
For several decades IEEE and IEC loading guides have been providing guidelines for the calculation of the winding hottest spot temperature from data that can be conveniently measured and parameters derived from temperature rise test or manufacturer calculations. The basic calculation method relies on the measurement of oil temperature at the top of the transformer tank and a calculation of the temperature difference between the winding hottest spot and the top oil. This temperature rise is provided by the manufacturer, based on his modeling of oil flow and losses distribution in the winding. Thereafter the hot-spot temperature can be computed for any load using the standard relation:
θ𝐻 = θ𝑜𝑖𝑙 + Δθ𝐻𝑅( 𝐼 𝐼𝑅)
2𝑚 (2.5)
Where:
θ𝐻 = Hot-spot temperature θ𝑜𝑖𝑙 = Top-oil temperature
I = Load current IR = Rated current
m = Winding exponent
This simple formula was completed with an exponential function to account for the thermal inertia of the winding when a sudden load increment is applied.
2.7 Thermal model and life loss equations
The top oil thermal model is based on the equivalent thermal circuit theory proposed by G.Swift. The differential equation for the equivalent circuit is;
𝐼2𝛽+1
𝛽 +1 . [Δθ𝑜𝑖𝑙 −𝑅] 1
𝑛 =𝜏𝑜𝑖𝑙 𝑑θ𝑜𝑖𝑙
𝑑𝑡 + [θ𝑜𝑖𝑙 − θ𝐴] 1
𝑛 (2.6)
Where,
𝐼𝑝𝑢 is the load current per unit. θ𝐴 is the ambient temperature, ˚C. θ𝑜𝑖𝑙 is the top oil temperature, ˚C. 𝛽 is the ratio of load to no-load losses. 𝜏𝑜𝑖𝑙 is the top oil time constant, min.
15 As the same mentioned method, the differential equation used to calculate the hot spot temperature is;
𝐼2 1+P𝐸𝐶 −𝑅 𝑝𝑢
1+P𝐸𝐶 −𝑅 𝑝𝑢 Δθ𝐻−𝑅 1
𝑚 = 𝜏𝐻𝑑θ𝐻
𝑑𝑡 + [θ𝐻 −θ𝑜𝑖𝑙] 1
𝑚 (2.7)
Where,
θ𝐻 is the hot spot temperature, ˚C.
P𝐸𝐶−𝑅 𝑝𝑢 is the rated eddy current loss at the hot spot location Δθ𝐻−𝑅 is the rated hot spot rise over ambient, K.
𝜏𝐻 is the winding time constant at the hot spot location, min.
It is assumed that insulation deterioration can be modelled as a per unit quantity for a reference temperature of 110˚C, the equation for accelerated aging is;
Accelerated Ageing = 𝑒[ 𝐵 383 −
𝐵
θ𝐻 +273]pu (2.8)
where B is the ageing rate constant.
The loss of life over the given load cycle can be calculated by;
L = 𝐹𝐴𝐴𝑑𝑡 (2.9)
The per unit loss of life factor is;
FEQA = 𝐹𝐴𝐴 ,𝑛 𝑁
𝑛 =1 Δ𝑡𝑛
Δ𝑡𝑛 𝑁
Percentage loss of life is;
% Loss of Life = 𝐹𝐸𝑄𝐴 𝑋 24 𝑋 100
𝑁𝑜𝑟𝑚𝑎𝑙 𝐼𝑛𝑠𝑢𝑙𝑎𝑡𝑖𝑜𝑛 𝐿𝑖𝑓𝑒 (2.11)
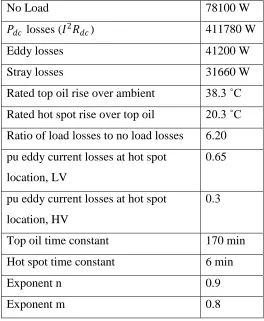
[image:27.612.210.474.279.600.2]The model created for oil-immersed power transformer has the following specifications. (ONAF – 250MVA). Parameters of the power transformer were taken in the IEEE Loading Guide and are shown in Table 2.1.
Table 2.1: 250MVA Transformer Parameters
No Load 78100 W
𝑃𝑑𝑐 losses (𝐼2𝑅𝑑𝑐) 411780 W
Eddy losses 41200 W
Stray losses 31660 W
Rated top oil rise over ambient 38.3 ˚C Rated hot spot rise over top oil 20.3 ˚C Ratio of load losses to no load losses 6.20 pu eddy current losses at hot spot
location, LV
0.65
pu eddy current losses at hot spot location, HV
0.3
Top oil time constant 170 min Hot spot time constant 6 min
Exponent n 0.9
17 2.8 Description of Previous Methods in Transformer Life Estimation
2.8.1 Thermal Aging of Distribution Transformers
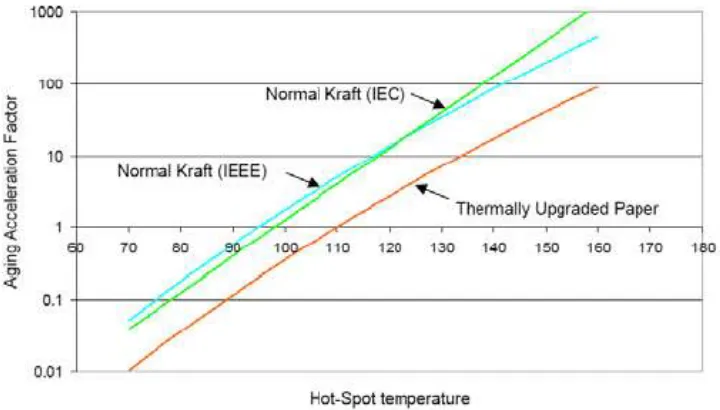
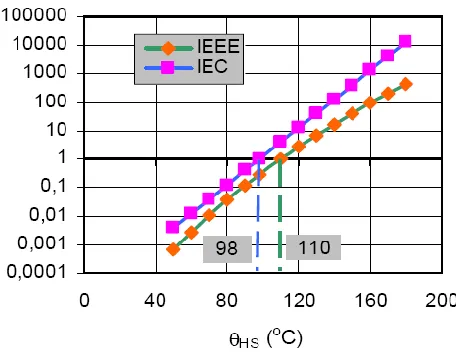
[image:28.612.212.440.315.492.2]There are two standards in which a power transformers thermal aging can be measured, IEEE Standard and IEC Standard. IEEE states that a power transformer would normally have 180000 hours of life, whereas IEC has no defined total transformer life, though it is most often mentioned that the transformer life is 30 years. The difference between these two standards is mainly caused by the hot spot temperature at which there is normal aging (110˚C according to IEEE and 98˚C according to IEC).
Figure 2.7: Aging rate (p.u) depending on the hot spot temperature according to IEEE and IEC.
Comparing the two standards for determining loss of life requires the following assumptions be made:
The transformer has a normal aging rate at 98˚C,
The normal ambient temperature is 20˚C,
Normal aging rate is 30 years,
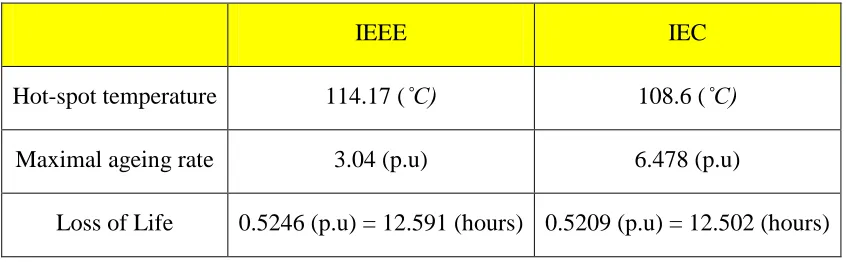
Table 2.3: Loss of life determined according to IEEE and IEC at same input data.
IEEE IEC
Hot-spot temperature 114.17 (˚C) 108.6 (˚C)
Maximal ageing rate 3.04 (p.u) 6.478 (p.u)
Loss of Life 0.5246 (p.u) = 12.591 (hours) 0.5209 (p.u) = 12.502 (hours)
The analysis shows that the loss of life of the transformer when using IEEE and IEC standards is not that different.
2.8.2 Loading of transformers beyond nameplate rating
The rating of a distribution transformer is usually assigned for continuous operation at that value. However, extraordinary events, such as overvoltages, short-circuit in the system and emergency loading can affect the life of a transformer to a high degree [9].
Consequences of loading a transformer beyond name-plate rating can be as follows:
1) The temperatures of windings, insulation, oil etc. increase and can reach unacceptable levels.
2) The leakage flux density outside the core increases, causing additional eddy current heating in metallic parts linked by the flux.
3) The moisture and gas content in the insulation and in the oil increase with the temperature increase.
CHAPTER 3
METHODOLOGY
3.1 Introduction
Life consumption of insulation in transformers is governed by several factors. The main factors are load and the ambient temperature. In order to assess the life consumed in an interval due to the loading and ambient conditions that have to identify from historical data, the present and the future load and ambient profile.
If the hourly load and ambient values are known, then the IEEE models in [5] can be used to calculate the consumed life at any point in time. The first challenge therefore is the accurate prediction of the load profile and the ambient temperature profile. The output current and ambient temperature data from a GSU transformer are showcased below to illustrate our method.
3.2 Loss of life calculation
The calculation of the loss of life is based on an ageing model taken from the IEC standard “Loading guide for oil-immersed power transformers” which has as main parameter the winding hot-spot temperature. As mentioned in the introduction the main factors that can affect the lifetime of the transformer are ambient temperature and load. We consider that these two factors affect a specific temperature point in the transformer which is called “winding hot-spot” (θH). According to the IEC standard, that temperature
point controls the loss of life through the following equation:
𝑉 = 2(𝛩𝛨 − 98)/6 (3.1)
Where,
V = Relative ageing rate
ΘΗ = Winding hot spot temperature
98°C = Temperature point where the IEC standard considers V to be 1.0
6°C = It represents the rate of deterioration of mechanical properties that is doubled for each 5-10°C increase in temperature. The doubling factor is not a constant. Is considered to be 6°C and 8°C for temperature range of 100-110°C and above 120°C respectively [7]. For the scope of the project is considering it to be constant at 6°C.
By calculating V can use the equation shown below in order to find the loss of life of a transformer over a certain period of time:
𝐿𝑂𝐿 = 𝑉𝑑𝑡 𝑡1𝑡2 (3.2)
ΘΗ is not a direct measurement but in order to be able to estimate the loss of life
of a transformer ΘH have to be calculate. ΘH is considered to be a temperature point
21
3.3 Mathematical equations explanation
In order to be able to calculate the loss of life the equation (3.1) will be use and moreover have to be able to calculate the winding hot-spot temperature ΘΗ. ΘΗ is
considered to be the sum of the top-oil temperature (in the tank) at a certain load (Θ0)
and the hot-spot to top-oil (in tank) gradient at a certain load (ΔΘΗ) [11].
𝛩𝛨 = 𝛩0+ 𝛥𝛩𝛨 (3.3)
From the above equation we can therefore deduce that in order for ΘH to be
calculated first the two other factors that compose equation (3.3).
3.3.1 Derivation of 𝜣𝟎
In order to avoid complexity need to make an approximation that the non-linear relationship affects only the final value of any temperature change that occurs, and that the time function is still exponential whatever cooling system use [11]. The following differential equation shows the relationship between inputs K, ΘA and output Θ0.
( 1+𝐾2𝑅 1+𝑅 )
𝑥× 𝛥𝛩
𝑜𝑟 = 𝑘11𝜏0× 𝑑𝜃0
𝑑𝑡 + [𝜃0 − 𝜃𝛼] (3.4)
Where:
K = Load factor
R = Ratio of load losses
ΔΘor = Top-oil temperature rise in steady state at rated losses
k11 = Thermal model constant
το = Average oil time constant
θa = Ambient temperature
The differential equation (4) can be written as the following difference equation:
𝐷𝜃𝜊 = 𝐷𝑡 𝑘11𝜏0× (
1+𝐾2𝑅 1+𝑅 )
𝑥 × [𝛥𝛩
𝑜𝑟 − 𝜃0− 𝜃𝛼 ] (3.5)
“The “D” operator implies a difference in the associated variable that corresponds to each time step Dt. Therefore at each time step the nth value of Dθ0 is
calculated from the (n-1)th value using”[11]:
𝜃0 𝑛 = 𝜃0 𝑛 − 1 + 𝐷𝜃𝜊(𝑛) (3.6)
From the equations (3.4), (3.5), (3.6) therefore can calculate the top-oil temperature.
3.3.2 Derivation of ΔΘΗ
The remaining factor of equation (3.3) is ΔΘΗ which is defined as the hot spot to top oil
gradient (in tank) at a certain load [11]. ΔΘΗ is considered to be the difference of ΔΘΗ1
and ΔΘΗ2 [11].
ΔΘ𝐻 = ΔΘ𝐻1−ΔΘ𝐻2 (3.7) ΔΘΗ1 and ΔΘΗ2 are considered to be two differential equations where the sum of
23 The two differential equations that are related with ΔΘΗ1 and ΔΘΗ2 are the
following:
For ΔΘΗ1 [11]:
𝑘21× 𝐾𝑦 × ΔΘ𝐻𝑟 = 𝑘22× 𝜏𝑤 × 𝑑𝛥𝛩𝛨1
𝑑𝑡 + 𝛥𝛩𝛨1 (3.8) Where:
K21, k22= Thermal model constant
y = Winding exponent
ΔΘΗr= Hot-spot to top oil gradient at rated current
τw= Winding time constant
For ΔΘΗ2 we have [11]:
𝑘21 − 1 × 𝐾𝑦 × ΔΘ𝐻𝑟 = [𝜏𝑜 𝑘22×
𝑑𝛥𝛩𝛨2
𝑑𝑡 ] + 𝛥𝛩𝛨2 (3.9)
All the variables of equation (9) are defined above. Next, in order to derive an equation that we can use throughout the process we must therefore convert them into difference equations. After the conversion of equations (8), (9) we came up with the following difference equations:
𝐷𝛥𝛩𝛨1 = 𝐷𝑡
𝑘22𝜏𝑤× [𝑘21 × ΔΘ𝐻𝑟𝐾
𝑦 − 𝛥𝛩
𝛨1] (3.10)
𝐷𝛥𝛩𝛨2 = 𝐷𝑡
(1 𝑘22)𝜏0× [(𝑘21− 1) × ΔΘ𝐻𝑟𝐾
𝑦 − 𝛥𝛩
𝛨2] (3.11)
ΔΘ𝐻(𝑛) = ΔΘ𝐻1(𝑛)−ΔΘ𝐻2 𝑛 (3.12)
From sections 3.2.1 and 3.2.2 have derived and illustrated the equations that are associated with the estimation of θΗ (winding hot-spot temperature). Values for the
variables in the equations are taken from test reports [12] and from the manufacturer of the specific transformer.
3.3.3 Relative ageing rate (V) calculation
As mentioned at the chapter 2 the relative ageing rate is:
𝑉 = 2(𝛩𝛨 − 98)/6 (3.13)
The only variable in equation (3.13) is θΗ which is derived in sections 3.2.1 and 3.2.2. In
order now to find V, have to enter the estimated value of θΗ in Celsius and find a value
of V. Then use: 𝐿𝑂𝐿 = 𝑁 𝑉𝑛 × 𝑡𝑛
𝑛=1 (3.14) or
𝐿𝑂𝐿 = 𝑉𝑑𝑡 𝑡1𝑡2 (3.15)
Where:
N = total number of intervals during the period considered tn = the nth time interval
n = number of each time interval
65
References
[1] Sayed Saad Amin. (2005) Electrical Power Systems and Transmission Network website. http://www.sayedsaad.com/fundmental/index_transformer.htm
[2] IEC 60076-2 (2005). “Power Transformers- Part 7 :Loading Guide for oil-Immersed Power Transformers”.
[3] M. Heathcote, D. Franklin, and A. Franklin, The J & P Transformer Book: A Practical Technology of the Power Transformer: Newnes, 1998
[4] W. Fu, J. D. McCalley, and V. Vittal, "Risk assessment for transformer loading,"
Power Systems, IEEE Transactions on, vol. 16, pp. 346-353, 2001.
[5] University of Southern Mississippi. (2005) Polymer Sience Learning Center. http://pslc.ws/mactest/cell.htm 17/03/09
[6] Nazar Hussain Malik. (1997) Electrical insulation in power systems -Technology & Engineering p.230-onwards
[7] IEEE Standard C57.19 (1995).” Guide for loading Mineral Oil Immersed Transformers”.
[8] T.V. Oommen, and T.Prevost (2006). “Cellulose Insulation in Oil-Filled Power Transformers: Part II – Maintaining Insulation Integrity and Life.”
[9] Susa D., Lehtonen M., and Nordman H., (2005)" Dynamic Thermal Modelling of Power Transformers", IEEE Transactions on Power Delivery, Vol. 20, Iss. 1, January 2005, pp. 197 – 204.
[10] V.G Davydov and O. Roizman (2002). “Moisture Assessment in Power Transformers:
Lessons Learned”, in VAISALA News.
[12] M.J. Heathcote, J&P Transformer Book (1998). 12th ed. London, Reed Education and Professional Publishing Ltd, 1998.
[13] John J. Winders (2002). Power transformers: principles and applications. [14] IEE (NOVEMBER 1992)Numerical of heat run test results (PROCEEDINGS-C,
Vol.139, No 6,)
[15] Blume L. F., Boyajian A., Camilli G., Lennox T. C., Minneci S., and Montsinger V. M.,(1951) "Transformer Engineering – 1
st
[16] IEEE Standard 1538 (2000). “Guide for determination of maximum winding temperature rise in liquid-filled transformers”.
[17] L.E Lundgaard, W. Hansen, T.J. Painter and D. Linhjell (2004). “Aging of Oil-
Impregnated Paper in Power Transformers”, IEEE Transaction on Power
Delivery. Vol.19.
[18] IEEE (1994) “Review of chemical indicators of degradation of cellulosic electrical paper insulation in oil-filled transformers”. IEEE proc. Sci. Meas. Technol. Vol 141,
No 5.
![Figure 2.1: Cellulose molecular decomposition [6]](https://thumb-us.123doks.com/thumbv2/123dok_us/8773972.900366/17.612.217.464.113.309/figure-cellulose-molecular-decomposition.webp)
![Figure 2.2: Mineral oil structure [8]](https://thumb-us.123doks.com/thumbv2/123dok_us/8773972.900366/18.612.251.422.281.372/figure-mineral-oil-structure.webp)