The Indicators of the Quality and Changes of
Teachers’ Work
Beatrix Fűzi
*, Sándor Suplicz
Trefort Centre for Engineering Education, Obuda University, Hungary
Copyright©2016 by authors, all rights reserved. Authors agree that this article remains permanently open access under the terms of the Creative Commons Attribution License 4.0 international License.
Abstract
We present the indicators chosen for the determination of the quality of teacher’s work: their popularity, effectiveness and disposition. As part of an empirical research project, their suitability as indicators was examined. It was discussed if a significant change can occur in the teachers’ quality spontaneously or as a result of mentoring. To determine the popularity and effectiveness of the 71 teachers involved, we relied on the opinions of 4,150 students, gathered by questionnaires. The teachers’ disposition was examined by the help of questionnaires. Interviews were conducted and lessons were observed. The quantitative and the individual, qualitative analyses of the teachers were combined. Based on factor analysis, it can be stated that popularity, effectiveness and positive disposition jointly characterize teachers performing high quality work. On the basis of the factor scores, the teachers examined were broken into three groups of different quality levels of work: good, medium and weak. The reliability and validity of the indicators could also be examined due to the longitudinal research. Reliability was characterised by the proportion of data that remained unchanged after 4 and 8 years. The changes of the quality of teachers’ work were shown by the way of the sensitivity of the indicators. Spontaneous changes, as well as those induced by mentoring, were perceivable in the indicators.Keywords
Quality of Teachers’ Work, Teachers’ Personality Traits, Change, Mentoring1. Introduction
In the past twenty-five years there has been a series of reforms one after the other, concerning both the form and the substance of public education. The institutional structure, the content of the curriculum, as well as the system of secondary school leaving examination have all been overhauled. No significant changes were brought, however, concerning the efficiency of the education system, including the efficiency of teachers, and the performance of students
did not improve either.
Research in Hungary and internationally in the past decade has clearly shown that the enhancement of the quality of education can be primarily achieved through the quality of the teaching. [4, 15, 25] As a result, there’s an increased emphasis on research aimed at determining and improving the quality of the work of teachers. As the authors of this paper are professionals in charge of the education and in-service training of teachers, the questions of what the secret of good teaching is and how we can best help teacher trainees and practicing teachers in achieving this aim have come to the center of our attention.
Our primary aim was to determine what indicators enable us to draw relevant conclusions on the quality of the work of teachers. We were looking for indicators on the basis of which the necessity to develop a teacher can be decided. Secondly, we intended to explore the factors influencing the quality of teachers’ work, so that we could identify the obstacles to the development of teacher trainees and practicing teachers, as well as to identify possible areas for development. Thirdly, we set as an objective the elaboration of methods with the use of which the quality of teachers’ work can be developed significantly, in a way also measurable from the perspective of students.
In the present paper, we will discuss how we chose the indicators that can be used for measuring the quality of teachers’ work and how we can prove that these are suitable as indicators.
We analyzed the available literature and collected the indicators that earlier research had found as relevant to determining the quality of teachers’ work. We provide a brief summary below of the thoughts and results most inspiring and serving as foundations for our research.
In reviewing the available literature and the results of our earlier research projects, we discovered that the factors identified as virtues of the best and as criticism of the worst teachers can be put in three groups.
In the following, we will review some of the relevant findings and results as related to each group.
1.1. Cognitive Elements and Good Teaching
In the middle of the 20th century it was believed that the learning and perfection of the skills to be used in classrooms, such as the number of connective words and the order in which rules and examples are presented, can significantly improve the efficiency of teachers. [2, 14]
Others considered the way of thinking and the decisions of the teacher [35] as the conditions of the efficient work and results achieved by teachers.
Many believe that the preparation of teachers for their lessons and the methods they use are very important for the success of their activity. [22-24]
It was hoped that reflective, or self–reflective thinking would result in teachers’ permanent self-development [20, 34], which would help with their effectiveness and ability to maintain their propensity to innovation, and would make it possible to develop their activities as teachers throughout their careers.
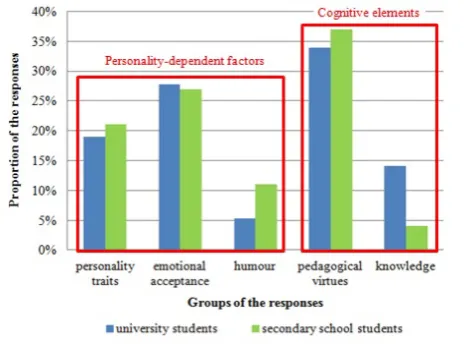
[image:2.595.58.291.493.665.2]From the characteristics of the individuals that 360 students surveyed identified as the best and worst of their teachers’, the group of the cognitive elements was also taking shape. Their frequency of occurrence in the characterizations of good teachers was 44.5%, which can be subdivided into two subgroups: pedagogical virtues (35.5%) and knowledge of the specialized subject matter (9%). In 42% of the cases, it is a factor in one of these two groups of cognitive factors to which we can trace back why students consider an individual a bad teacher. [37] The figure below shows that the students assign significance to these factors. (Figure 1.)
Figure 1. The causes of the excellence of teachers according to students
1.2. The Significance of Personality
Early research projects examining the work of teachers already emphasized that it was the function of the personal characteristics of teachers whether they were able to raise
the interest of their students and improve their performance. The importance of personality was also emphasized by Rogers [29], who considered congruence, the acceptance of ourselves and others as having outstanding importance.
According to Allport [3], the teacher is a mature personality only with sufficient self-knowledge, humor, as well as own aims, and the capability of performing different tasks, accepting the opinions of others and maintaining a close rapport with them. Other important components also include trust and a tolerance of frustration.
The paper by Hamachek [17], based on the opinions of students, found that in terms of good teachers, 51% of students underlined helpfulness and 40% emphasized humor. In addition, they also considered humanity as an important characteristic feature. Bad teachers, by contrast, were seen as withdrawn, having difficulties with explaining things and abusing their power.
Also on the basis of students’ opinions, Clark [5] highlighted four indispensable characteristics of teachers: knowing and respecting students, encouraging and leading.
The students involved in our earlier research projects attributed a 56% importance to personality in determining who becomes a good or a bad teacher. Within the above, moral elements, cultural dominance, humor and emotional acceptance play the main roles, and in case of teachers considered as bad also emotional rejection. [37] Emotional acceptance and rejection represent a significant weight, accounting for 50% of the personality-dependent factors, and therefore, we will treat this as a separate group in the following.
1.3. Affective Factors and the Quality of Teachers We must note that research projects as well as authors emphasizing the significance of personality often refer to the strength of the teacher’s personality for creating relationships and for accepting students as factors making cooperation possible There are also researchers according to whom the effectiveness of such cognitive elements as educational methods are established by the positive teacher-student relationship. [1, 6, 28, 31, 40]
The school of affective psychology and pedagogy, which has been gaining strength in recent years, places the emotional elements determining the effectiveness of the teaching and learning, and of the cooperation between teacher and student, in the center of attention. [16]
Although most experts do not dispute the importance of the teacher-student relationship, little attention is devoted to its development, for example, in teacher training. One of the reasons may be the determination of this relationship by affective elements that are hard to access and to change. An attempt to interfere with affective elements results in strong averting mechanisms. [36]
nearly 30% in the background of good teaching (Figure 1.) and 13% in the background of becoming a bad teacher. [37] Its importance is inherent in the fact that this is a basic condition of human relationships, including teacher-student relationships.
1.4. The Indicators of Teacher Quality and the Influencing Factors
Summarizing the indicators of teaching quality is defined in the following.
The purpose of most research projects is to understand how the teacher and his/her activities contribute to the development of students and the improvement of their knowledge. It is a social expectation toward teachers that they should induce a positive change, development in knowledge, attitudes and degree of socialization of their students. Therefore, the quality of teachers’ work is partly revealed by the performance of their students.
Teachers’ profiles show that the characteristics of outstanding teachers – with the exception of humor, moral and cultural dominance [7, 37] – as well as their pedagogical virtues can be so diverse that those aspects cannot be used as indicators. For example, teachers rated professionally the highest include strict and lenient teachers, as well as both those maintaining a close relationship with students and those keeping an objective, work-focused distance. Some great teachers use frontal instructions, others use cooperative methods; some use info-communication devices in the classroom, while others
do not, etc. Therefore, we narrowed the number of possible indicators to as few as possible, and strove to define indicators that do not force teachers to adopt behaviors or methods alien to their character in order to appear good.
It is important to note that a common feature shared by all teachers considered to be good was that their relationship with their students is positive, in some cases objective, but never negative or offensive. (Figure 2.) Teachers considered to be bad by students, however, were not able to establish a positive relationship with their students. [11, 37]
It is beyond doubt today that an accepting, positive teacher-student relationship is one of the preconditions of efficient teaching and learning [8, 18, 27, 30, 32, 38]; therefore, we considered teachers’ popularity by students as an indicator of the quality of their work.
A sense of success, experienced from time to time, and the accompanying good disposition are conditions of the efficient work from the point of view of the teachers and of successful learning from the point of view of the students [8-10, 21, 26]. Therefore,, we assumed that the quality of teachers’ work is also manifested in the fact if the teachers and their students experience flow during classroom activities.
The popularity, efficiency of the teacher, as well as the students’ and the teachers’ disposition were, therefore, defined as indicators of the quality of the teacher’s work.
[image:3.595.105.505.453.684.2]The factors influencing teacher quality were selected from the above mentioned cognitive elements, characteristic traits and affective factors.
Figure 3. The concept of the research project: the indicators of the quality of the work of teachers, as well as its influencing factors
Cognitive elements included preparedness, the teaching methods used, as well as self-reflection. From among the personality traits, we endeavored to examine the factors highlighted by the students: moral, humor and cultural dominance. From the affective factors, we intended to examine the special characteristics of the teacher-student relationship, such as the inspiring nature of cooperation with the students, the extent of identification with the students, the mutual acts of occasional meanness between teachers and students, and consistency. (Figure 3.)
The hypotheses and the tools of the research project are built on the aspects outlined in the figure. In the present paper we only focused on the indicators, and will report on our findings related to the influencing factors later.
2. Hypotheses, Methods and the Sample
In the course of the research project, we aimed to examine the hypotheses and answer the question below:
There is a positive link between the popularity, efficiency and disposition of teachers.
The popularity, efficiency and disposition of the teachers are jointly suitable to determine the quality of the work of teachers.
On the basis of the indicators, marked difference may be found between teachers.
Are the indicators suitable to detect changes in the quality of teachers’ work, which are either spontaneous or the result of conscious improvement?
In order to determine the level of acceptance and efficiency, as well as the disposition of students related to the classes taught by the teacher, primarily students’ opinions, but also their academic results were needed. The teachers also had to be asked in order to obtain information on their own disposition. We found it important to conduct personal interviews with the teachers examined and also to see the actual classroom activities of at least some of them. As a result, we were able to examine the teachers from three
points of view: the perspective of the students, their own perspective, and the independent point of view of the researcher/mentor.
We have developed and tested the questionnaires and the interview draft used for surveying the students and the teachers. [12, 13, 38] The questionnaires were completed by the participants in a printed version.
We made an effort to get to know the opinions of all students taught by the teachers examined. We used anonymous questionnaires to obtain the opinions of the large number of students, and supervised the completion of these questionnaires personally.
The student questionnaire contained questions pertaining to the popularity, as well as the effectiveness of the teacher. The effectiveness of the teachers was measured by several factors:
grades received in the subject; the classroom activity of the students; the attitudes of the teachers to the subjects.
Since we recorded the above data in the first and the third quarters of the year as well, the effectiveness could also be characterized by the changes that occurred in the course of the teacher-student cooperation, including:
the changes in the grades earned in the subject; the changes in the classroom activity of the
students;
the changes in the attitudes to the subjects of the teacher examined.
Students had to evaluate their teachers on a five-grade scale, where five was the best and one was the worst grade.
In addition, the questionnaire included a flow questionnaire consisting of nine items to determine the extent of flow, apathy and anxiety experienced by the students taught by a given teacher. [26]
[image:4.595.146.468.80.257.2]Figure 4. The distribution of the students according to grades The disposition of the teachers was surveyed with the use of a flow questionnaire identical with the one used with students, incorporated into the teachers’ questionnaire that was developed for the examination of the factors influencing the quality of teaching. Thus, it became possible to see the proportions of flow, apathy and anxiety characterizing the classes taught by a teacher from the perspective of both the teacher and his or her students.
The background variables related to teachers included their age, the number of years spent in the profession, their sex, and the type of the subject taught. We entered and analysed the data collected from the teachers and the students ourselves. The data gathered were subjected to descriptive and mathematical statistical analysis by SPSS software.
We did not hope to understand the problems and changes connected to the quality of the teachers’ work from the quantitatively analyzable data, but from a more in-depth knowledge of the teachers.
All of the above was supplemented by lesson observations and their analysis together with the teachers, since the quality of teaching is validly manifested not only in the classroom, but also in the social space consisting of the teacher and the students. Thus we were also able to get an insight into the joint work and mutually formed experiences of the teacher and their students. On the other hand, our observations offered an opportunity to refine and often also to explain what could be learned about the teachers from their self-evaluation and on the basis of their students’ opinions.
We also conducted half-structured interviews with some of the best and worst-performing teachers, as well as some showing significant change. We have subjected the audio recordings prepared at the interviews to an analysis of content, including the use of words, the specific content of the text, the symbols used, as well as the metacommunication observed during the interview.
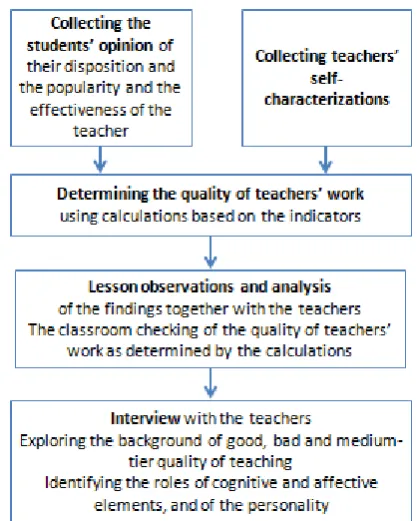
The individual steps of the research project and order in which the data collection tools were used is shown in the figure below. (Figure 5.)
Figure 5. The process of determining the quality of teachers’ work In order to obtain evidence for the reliability and validity of the quality indicators of teachers’ work, we carried out a longitudinal, follow-up survey. For this reason, with the application of the research concept and the set of tools described above, we surveyed the entire teaching faculty of a school in Budapest in 2006, 2010 and 2014. After the data were recorded, there was no intervention in the work of the teachers. On the basis of the data of teachers who participated in the survey two or three times, the spontaneous development of the quality of their work could be examined.
In our center, we are training teachers of engineering, who do their teaching practices in secondary schools affiliated with our university. We offered these six secondary schools the opportunity to have the quality of the work of their teaching faculty examined with the use of the system we have developed. One of these technical secondary schools decided to use this opportunity, where all members of the teaching faculty agreed to participate in the research project.
[image:5.595.69.288.78.253.2]Figure 6. The development of the quality of teaching using mentoring, and the examination of the suitability of the indicators
The changes were monitored for 2 to 5 years with data collection from the students twice a year. The last data
collection took place in April 2015.
[image:6.595.315.549.132.341.2]In the following, the characteristics of the teachers participating in the research programme can be seen. (Figure 7-10.)
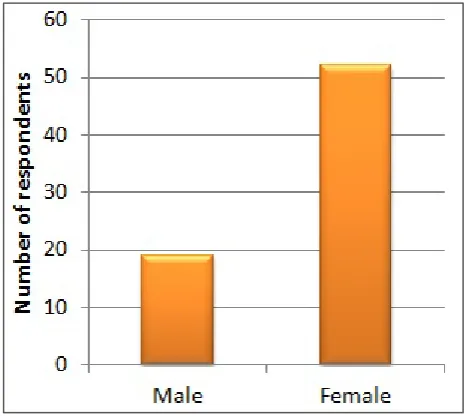
Figure 7. The distribution of the teachers examined according to gender Table 1. The time schedule of the research and the number of persons involved in the survey
[image:6.595.92.519.372.524.2] [image:6.595.119.493.560.722.2]The number of respondents [persons] Students Teachers 2004- 2006 Preliminary surveys 360 -
2006 The survey of the entire faculty of teachers of a specific secondary school
in Budapest based on data collected from all students of the school
There were no development interventions between the individual
surveys.
375 31
2010 409 35
2014 250 41
2010- 2015 Among teachers voluntarily requesting the surveying of the quality of their work and all their students
Intentional, targeted interventions and mentoring was carried out depending on the quality of teaching
measured.
3,116 7
∑ 4,150 71*
*There were teachers who participated in the survey two or three times, but they were only taken into consideration in the summation of the results once.
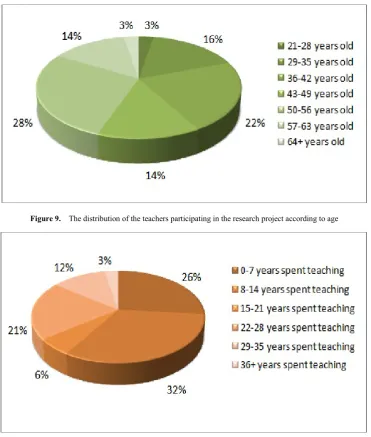
Figure 9. The distribution of the teachers participating in the research project according to age
Figure 10. The distribution of the participating teachers according to the time spent with teaching
3. Findings
Based on our hypotheses, popularity, efficiency and good disposition jointly characterize the good quality work of teachers. The examination of the above was carried out with factor analysis, as well as the examination of interrelationships and differences, as described below.
3.1. Relationships of Indicators
The conditions of the factor analysis were fulfilled inasmuch that the number of cases was at least five times the number of variables and the variables showed an approximately normal distribution (KMO=0.83). The variables in the calculations were the teachers’ popularity, the students’ grades, their classroom activity, attitudes to the subject, the flow indicator of the students, as well as the flow indicator of the teachers. On the basis of the results of
the factor analysis, these variables are concentrated in a single factor, which explains 68.5% of the variance. This means that the hypothesis was correct.
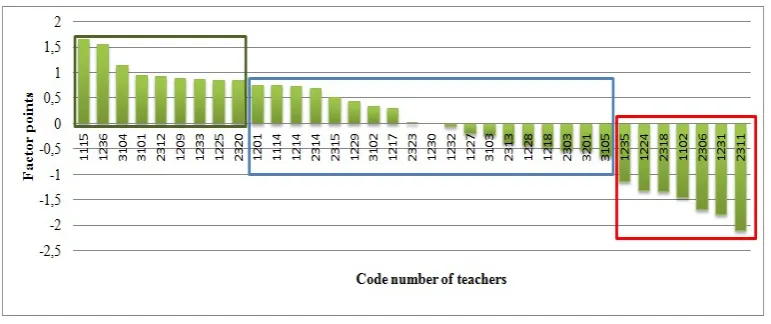
Relying on the results of the factor analysis, on the basis of the factor points belonging to each individual, the teachers examined belong to three, markedly different groups. We will call them here the groups of teachers performing good, average and poor quality work. In the following, when we mention teachers being the good/successful, bad/unsuccessful or middle-range of teachers, we refer to them as a member of one of the above three groups.
Figure 11. The ranking of the teachers according to successfulness on the basis of the factor points
Based on calculations carried out with the Mann–Whitney test, the differences are significant between each indicator of successful and unsuccessful teachers: • students’ latest grades in the subject of the teacher
examined (p=0.0001);
• the change in student-performance (p=0.0001); • students’ classroom activity (p=0.0001);
• the current attitude towards the teacher’s subject (p=0.0001);
• the change in the attitude towards the subject (p=0.001);
• the indicator of students’ sense of flow, apathy and anxiety (p=0.0001).
The indicators showing the results of successful teachers at p<0.05 level are significantly more favorable than the same figures in the middle range in case of the apathy indicator. At p<0.01 level they achieved significantly higher results in terms of students’ most recent grades, their attitudes toward the subject and their flow indicators.
With the exception of the changes in student-performance, measured by the grades and the anxiety of the students, all indicators of the teachers in the middle range were consistently better than those in the group of unsuccessful teachers.
According to the examination of differences (Mann–Whitney test), and based on the data of the flow questionnaire, there is no significant difference in the flow and apathy indicators between teachers performing good and poor quality work. At the same time, anxiety related to the teaching activity was significantly less characteristic among successful teachers than in case of their unsuccessful colleagues (p=0.02) or those in the middle range (p=0.003). The interviews and the lesson observations have made it clear that there is a significant difference between the disposition of unsuccessful and successful teachers. In our opinion, this difference cannot be identified in the dimensions of flow and apathy because the teachers did not have the option to remain anonymous when completing the questionnaires. They knew that the questionnaires would be subjected to individual analysis, and the protection of their
self-image, increased the dissimulation pressure. In such a situation it would be difficult for a teacher to admit that he or she is not enjoying teaching, or is actually bored by it.
Coinciding with the conclusions of research projects [11, 15, 24, 31] finding no links between the age of the teacher and the number of years spent in the profession on the one hand and his or her efficiency and success on the other according to our calculations no connections could be established between the above-mentioned characteristics and popularity or efficiency, or with the teachers’ and students’ disposition, as established on the basis of the flow questionnaire.
Using the method of cross-table analysis, we examined whether there was any connection between the type of the subject taught (i.e. arts and humanities, science, technical or other professional subjects) and the quality of the teacher’s work. According to our findings, no such connection could be established either.
We also attempted to determine with the use of cross-table analysis whether the sex of the teacher plays a role in the quality of teaching. Based on the calculations it cannot be claimed that members of either sex would be more frequent among teachers performing their work in good, bad or average quality.
3.2. The Reliability and Validity of the Indicators
In the present paper we intended to examine if the factors we used to determine the quality of the work of teachers are, in fact, indicators. For this purpose, we had to prove their reliability and validity. The former is best served if we carry out longitudinal and cross-sectional analyses of teacher-quality. Evidence for the latter can be obtained if we explore the causes of the changes in the quality of teachers’ work and examine whether indicators would show a conscious change effecting the quality of teaching.
which is identical in case of lessons taught by a teacher during the same period of time.
In case of teachers who participated in the research project twice it was possible to observe how the quality of their work changed over the period of four to eight years. No conscious development intervention concerning these teachers was made on our part.
According to our results, the quality of teaching measured with the use of our indicators remained stable also over the course of four or eight years, with only minimal strengthening or weakening observed, but with the exception of a single individual, none of the teachers were able to change their original category. For example, there was a very close and significant positive correlation between the popularity of teachers, as determined in the course of the 2006 and 2010 surveys (r=0.734 p<0.01). We came to a similar conclusion in connection with the students’ classroom activity (r2006-2010=0.448 p=0.032) and their attitudes to the subjects concerned (r2006-2010=0.515 p=0.012). [11] According to the Wilcoxon test, the quality of teachers’ work had a very high probability (p<0.01) of being the same in the course of the surveys every four years.
We have also observed that some fundamental changes have taken place in the activities of certain teachers, considered as good or bad, between the various moments in time. Some, for example, introduced new methods, or changed the manner in which they designed their lessons. Still, the overall quality of their work as teachers remained unchanged.
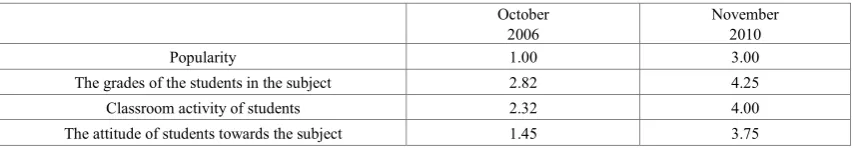
We only measured a significant change in the quality of the work of a single individual. The most rejected teacher characterized by the weakest quality of work improved and came up to the middle range. Her acceptance and effectiveness showed a significant positive change. (Table 2.) She told us in the interview that she had struggled with serious health issues, and these have also significantly changed her outlook on teaching. For a long time she had also filled an administrative role in the school, and after her accident she realized that she had wanted to match up to the expectations in this role so much that she had increasingly thought of teaching as a burden; her attention had turned away from the students, and she had taught her lessons with a minimum level of preparation and investment of energy. After she recovered from her accident, this proportion was reversed, and now teaching and supporting students are in the center of her attention, and she considers her other tasks
as secondary. In our earlier conversation she had said that 20-25% of the students were not even worth dealing with, because due to their lack of interest, they would not develop, despite the efforts of the teacher. In her words: “They are not interested in anything, and this creates a lot of tensions in me. Even though I don’t experience this as a failure, I am extremely upset about it.” By contrast, now she believes: “I know that the development will happen sooner or later, I am just waiting for it very impatiently. And if necessary, I devote the whole class session to it, as well as time outside the classroom. If I had enough time and energy, I am certain that almost everyone could be helped.”
The change of the grades alone in themselves does not prove that a change occurred in the work of the teacher; however, if we also take into consideration that the classroom activity of the students and their attitudes towards the subject also changed in a similar direction and extent, we can believe in the possibility of change.
After data collection, we provided feedback to the seven teachers having joined the research project in 2010: we called their attention to possible problems and offered them the opportunity of individualized mentoring. Two of them could be characterized by outstanding, three with average, and two with weak quality of teaching work.
We identified and clarified the problems while observing lessons and conducting interviews. In the course of these, we aimed to determine whether the root of the problems is on the level of cognitive, affective or personality elements. Subsequently, the teachers received personalized, individual improvement with the use of the mentoring method developed by us [36]. In case of teachers in the successful and the middle-range group, we started the mentoring process with concentrating on the cognitive elements. On the basis of results of the research project not discussed in this paper, in the case of teachers with a weak quality of work the affective factors were placed in the center. Due to averting mechanisms, the change of those teachers required an approach and technique based on the change theory of Lewin [33] and Watzlawick – Weakland – Fisch [39]. The mentoring lasted between 0.5 and 1.5 years, as needed, and the work of the teachers was followed up by data collection for 2 to 5 years.
[image:9.595.92.522.657.732.2]We were curious if a change could be induced that would also be manifested in the indicators, and if there was a possible movement between the groups of good, middle-range and poor quality teachers. (Table 3.)
Table 2. The change in the popularity and efficiency of teacher no. 1233 between 2006 and 2010 (5 is the positive, 1 is the negative endpoint of the scale) October
2006 November 2010
Popularity 1.00 3.00
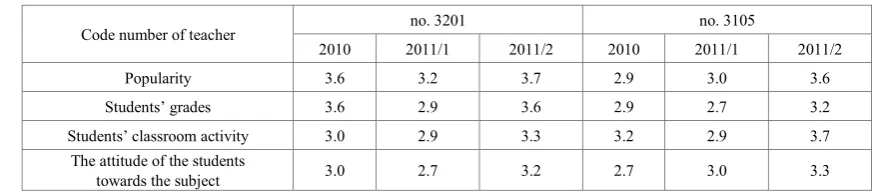
Table 3. The starting indicators of mentored teachers (5 is the positive, 1 is the negative endpoint of the scale) Teachers doing good
quality work Middle range Teachers doing poor quality work Code number of teacher no. 3101 no. 3104 3202 no. no. 3102 no. 3201 no. 3103 no. 3105
Popularity 4.2 4.1 3.8 3.9 3.6 2.7 2.9 Students’ grades 4.1 3.9 3.6 2.5 3.6 3.0 2.9 Students’ classroom activity 3.7 3.9 3.4 3.2 3.0 3.0 3.2
The attitude of the students
towards the subject 4.0 4.2 3.8 3.2 3.0 3.0 2.7
Table 4. The indicators of the mentored teachers after the first development experiment (5 is the positive, 1 is the negative endpoint of the scale) Middle range Teachers doing poor quality work
Code number of teacher no. 3202 ← no. 3102 ← no. 3201 → no. 3103 ← no. 3105 2010 2011/1 2010 2011/1 2010 2011/1 2010 2011/1 2010 2011/1 Popularity 3.8 4.2 3.9 4.3 3.6 3.2 2.7 3.2 2.9 3.0 Students’ grades 3.6 3.4 2.5 2.9 3.6 2.9 3.0 3.2 2.9 2.7 Students’ classroom activity 3.4 3.6 3.2 3.4 3.0 2.9 3.0 3 3.2 2.9
The attitude of the students
towards the subject 3.8 3.9 3.2 3.7 3.0 2.7 3.0 3.4 2.7 3.0
Table 5. The indicators of the mentored teachers after the second development experiment (5 is the positive, 1 is the negative endpoint of the scale)
Code number of teacher no. 3201 no. 3105
2010 2011/1 2011/2 2010 2011/1 2011/2 Popularity 3.6 3.2 3.7 2.9 3.0 3.6 Students’ grades 3.6 2.9 3.6 2.9 2.7 3.2 Students’ classroom activity 3.0 2.9 3.3 3.2 2.9 3.7
The attitude of the students
towards the subject 3.0 2.7 3.2 2.7 3.0 3.3
The first development experiment, focusing on cognitive elements, brought some changes that could be seen in the indicators. Two teachers, initially in the middle range, showed positive development also perceivable in the indicators. In case of one teacher in the middle range, who was struggling with psychological problems during the interview, we measured a significant deterioration of the results despite the cognitive intervention. (Table 4.)
The development of the cognitive elements has brought significant results in case of only one of the teachers whose work was measured as having a poor quality, while the work of the other one (no. 3105) still has poor quality. The mentoring of this teacher, as well as the one whose performance deteriorated from the middle-range (no. 3201), continued for another half year, concentrating on the affective factors, and had the results shown in the Table 5.
Following their work we found that the success of the individual, personalized development of the affective elements could be seen in both the popularity of the teachers and the performance of their students. The changes could only be confirmed by the findings of lesson observations.
Therefore, on the basis of the individual-level analysis of the teachers, the factors used as indicators were sensitive to
changes occurring in the quality of their work.
4. Discussion
Their results confirmed all of the hypotheses. In the following, we briefly summarize these.
1. There is a positive link between the popularity, efficiency and disposition of teachers.
The variables in the factor analysis were the teachers’ popularity, the students’ grades, their classroom activity, attitudes to the subject, flow indicator, as well as the flow indicator of the teachers. On the basis of the results, these variables are concentrated in a single factor, which explains 68.5% of the variance.
2. The popularity, efficiency and disposition of the teachers are jointly suitable for determining the quality of the work of teachers.
[image:10.595.86.521.91.208.2] [image:10.595.86.518.227.339.2] [image:10.595.81.521.356.454.2]on the basis of the results of the calculation. Further, in most cases, they also provided explanations for possible problems and served as starting points for the development. 3. On the basis of the indicators, a marked difference
may be found between teachers.
On the basis of the factor points belonging to each individual, the teachers examined belong to three, markedly different groups: the groups of teachers performing good, average and poor quality work.
4. Are the indicators suitable for sensing changes in the quality of the work of teachers, which are either spontaneous or the result of conscious development? The longitudinal nature of the research project, as well as the in-depth analysis of the activities of the individual teachers made it possible to determine that the indicators used by us are sensitive to the changes in the quality of the teachers’ work. Whether a significant change occurred spontaneously or as the result of conscious, targeted development can be identified in the indicators, and especially in those based on information from the students.
In the course of the research project, we have noticed limitations of the use of certain tools.
On the basis of data received from the pupils, we can clearly outline a group of successful and unsuccessful teachers, as well as a middle-tier group in between; at the same time, the research tools building on teachers’ self-descriptions, and flow questionnaires seem to offer many opportunities for the respondent’s “façade-protecting” behaviour. Consequently, the differences between the teachers seem to be less significant. Also contributing to this fact was that while pupils were able to respond anonymously, the same opportunity was not available in case of teachers.
The data thus collected should be treated with reservations, yet they are necessary in the development process for getting to know the self-image of teachers or the image intended to be conveyed.
The demand for getting an in-depth knowledge of the work of some of the teachers put a higher value on data that can be evaluated with qualitative procedures and the consequences that can be derived from them. When compared against the results of the calculations, the data gained and interpreted though qualitative methods served as reinforcement or refutation. The differences between the results of statistical calculations, the indicators and metaphors, as well as the findings of interviews and lesson observations shed light on the weak points of teachers hidden by defensive mechanisms, and consequently also on the areas to be developed. The combination of the qualitative and quantitative allowed a deeper analysis and understanding of the defining elements of teachers' successfulness.
The surveying of the quality of the teachers’ work and their personalized mentoring are ongoing activities of ours. Thus, the number of teachers and students involved in the
research is continuously increasing. This increase in the number of elements helps us examine the connections identified so far to be examined also on a larger sample. Further, our knowledge of factors hindering the good quality work of teachers, as well as their effect mechanism and the possibilities for efficient development.
5. Conclusions
The aim of our paper was to present the indicators found suitable by our research to describe the quality of teachers’ work and the changes in such quality.
In order to determine the quality of teachers’ work, we primarily relied on the opinions of the students, who participate in the social space created jointly with their teachers, and are thus competent at evaluating the effect that social space has on them. Based on the factor analysis, we were able to prove our hypothesis that popularity, effectiveness and positive disposition jointly characterize teachers performing good quality work. On the basis of the factor points, we placed the teachers examined in three markedly different groups: those who perform excellent quality work, the middle range characterized by average quality, and the group of teachers performing poor quality work.
The reliability of the indicators was supported by the fact that the data recorded simultaneously in different classes showed significant coincidence in case of the same teacher. Furthermore, the characterizations of the teachers and the influence they have on students were also substantially identical when re-examined after a period of 4 or 8 years.
The sensitivity of the indicators was reinforced. The spontaneous changes in the quality of the teachers’ work, as well as those induced by mentoring, appeared in the indicators.
We found that teachers were not able to change the quality of their work fundamentally; by contrast, individualized mentoring was effective. This also confirms that our mentoring method developed for the individualized development of teachers is suitable to achieve fundamental changes in the quality of teachers’ work.
REFERENCES
[1] N. Aksoy. Opinions of Upper Elementary Students about a „Good Teacher”, Case Study in Turkey, 1998. Online available from http://files.eric.ed.gov/fulltext/ED428042.pdf [2] D. W. Allen, K. A. Ryan. Microteaching. Addison – Wesley
Reading, USA, 1969.
[3] G. W. Allport. A személyiség alakulása. Gondolat Kiadó, Budapest, 1980.
[5] M. C. Clark. A jó tanár. Fizikai Szemle, Vol.40, No.9, 262-267, 1990.
[6] J. Cornelius-White. Learner-Centered Teacher-Student Relationships Are Effective: A Meta-Analysis, Review of Educational Research, Vol.77, No.1, 113–143., 2007.
[7] V. Csányi. Oktatáspolitikai problémák egy humánetológiai rendszerszemlélet tükrében, Iskolakultúra, Vol.10, No.1., 3-13, 2010.
[8] M. Csíkszentmihályi, K. Rathunde, S. Whalen. Tehetséges gyerekek. Flow az iskolában, Nyitott Könyvműhely, Budapest, 2010.
[9] M. Csíkszentmihályi. Flow – Az áramlat. A tökéletes élmény pszichológiája. Akadémiai Kiadó, Budapest, 2001.
[10]M. Csíkszentmihályi. A fejlődés útjai. Nyitott Könyvműhely, Budapest, 2007.
[11]B. Fűzi. An examination of the successfulness of teachers’ work in the context of pedagogical attitudes, the relationship between teachers and pupils, and school experiences, Thesis of doctoral dissertation, 2012. Online available from http://nevelestudomany.phd.elte.hu/wp-content/uploads/2012 /02/fuzi_beatrix_tezisfuzet_angol.pdf
[12]B. Fűzi. A sikeres pedagógiai munka néhány összetevője egy vizsgálat tükrében. Pedagógusképzés, Vol.5, No.3, 9-30, 2007.
[13]B. Fűzi. Tanárok iskolai élményeinek szerepe a pedagógiai munka sikerességében. Alkalmazott pszichológia, Vol.9, No3-4, 5-23, 2007.
[14]N. L. Gage. Teacher Effectiveness and Teacher Education. The Search for Scientific Basis. Pacific Books, Palo Alto, USA, 1972.
[15]D. Goldhaber. The Mystery of Good Teaching. Published by the Hoover Institution by the Board of Trustees of Leland Stanford Junior University, 2002. Online available from http://www.educationnext.org/2002/
[16]K. Gombos, É. Bányai, K. Varga (2009): A tanulás affektív pszichológiai nézőpontból. Pedagógusképzés, Vol.7 (36), No.2-3, 103-127, 2009.
[17]D. Hamachek. Characteris of Good Teachers and Implications of Teacher Education. The Phi Delta Kappan, Vol.50, No. 6, 341-345, 1969.
[18]P. A. Jennings, M. Greenberg. The Prosocial Classroom: Teacher Social and Emotional Competence in Relation to Students and Classroom Outcomes. Review of Educational Research, Vol.79, 491-525, 2008. Online available from http://www.prevention.psu.edu/projects/documents/Jennings _Greenberg.pdf
[19]M. Kimmel. A reflektív gyakorlat gyökerei, Pedagógusképzés, No.3, 120–123, 2002.
[20]M. Kimmel. A tanári reflexió korlátai, Pedagógusképzés, No.3-4, 35-49, 2006.
[21]S. Klein. Munkapszichológia. SHL Kiadó, Budapest, 2001.
[22]I. Köcséné Szabó. Milyen tanár leszek? In. Falus Iván (szerk.): A tanárrá válás folyamata. Gondolat Kiadó, Budapest, 121-155., 2007.
[23]L. Malmberg, H. Hagger, K. Burn, T. Mutton, H. Colls. Observed Classroom Quality During Teacher Education and Two Years of Professional Parctice. Journal of Educational Psychology, Vol.102, No.4, 916-932, 2010.
[24]M. Nagy. A tanárok értékelése – politikák és gyakorlatok. In: M. Simon, B. Kósa (szerk.): Minőség – eredményesség – hatékonyság. OKI, Budapest, 2005.
[25]McKinsey. How the world’s best-performing school systems come out on, 2007. Online available from http://www.smhc-cpre.org/wp-content/uploads/2008/07/how -the-worlds-best-performing-school-systems-come-out-on-to p-sept-072.pdf
[26]Oláh. Az optimális élmény mérésének lehetőségei: Egy új szituáció-specifikus Flow-kérdőív tesztkönyve. HI Press, Budapest, 2005.
[27]Olson, J. Wyett. Teachers need affective competencies. 2000. Online available from http://findarticles.com/p/articles/mi_q a3673/is_4_120/ai_n28784024/
[28]J. Ramsey, D. Fitzgibbons. Being in the Classroom. Journal of Management Education, Vol.29, No.2, 333-356, 2005.
[29]C. Rogers. Student-Centered Teaching as Experienced by a Participant. Educational Leadership, Vol.16, No.2, 1959.
[30]C. Rogers. On Becoming a Person. Houghton Mifflin Company, Boston – New York, 1995.
[31]J. Saád. A tanítás minősége. Új Pedagógiai Szemle, Vol.56, No.12, 55-77, 2006. Online available from http://epa.oszk.hu/00000/00035/00109/2006-12-ot-saad-Tani tas.html
[32]H. Sallay. Tanári szerepek percepciója: egy általános iskolai felmérés tanulságai. Magyar Pedagógia, Vol.95, No.3-4, 201-227, 1995
[33]E. H. Schein. Kurt Lewin’s change theory in the field and in the classroom: Notes toward a model of managed learning, 1995. Online available from http://www.a2zpsychology.com /articles/kurt_lewin's_change_theory.htm
[34]D. Schön. The Reflective Practitioner, Temple Smith, London, 1983.
[35]R. J. Shavelson. Teacher’s Decision Making. In: The Psychology of Teaching Methods The Seventy Fifth Yearbook of NSSE, University of Chicago Press,.Chicago, 372-414, 1976.
[36]S. Suplicz, B. Fűzi. Tanárok mentorálásának elmélete és gyakorlata. DSGI Kiadó, Székesfehérvár, 2013.
[38]S. Suplicz. What Makes a Teacher Bad? - Trait and Learnt Factors of Teachers'. Acta Polytechnica Hungarica, Competencies, Vol. 6., No.3, 2009.
[39]P. Watzlawick, J. H. Weakland, R. Fisch. Változás – A problémák keletkezésének és megoldásának elvei. Gondolat Könyvkiadó, Budapest, 1990.