NetGrep: fast network schema searches in interactomes
Eric Banks
*†
, Elena Nabieva
*†
, Ryan Peterson
*‡
and Mona Singh
*†
Addresses: *Department of Computer Science, Princeton University, 35 Olden Street, Princeton, NJ 08540, USA. †Lewis-Sigler Institute for Integrative Genomics, Princeton University, Carl Icahn Lab, Princeton, NJ 08544, USA. ‡Current address: Department of Computer Science, Cornell University, 4130 Upson Hall, Ithaca, NY 14853, USA.
Correspondence: Mona Singh. Email: [email protected]
© 2008 Banks et al.; licensee BioMed Central Ltd.
This is an open access article distributed under the terms of the Creative Commons Attribution License (http://creativecommons.org/licenses/by/2.0), which permits unrestricted use, distribution, and reproduction in any medium, provided the original work is properly cited.
NetGrep
<p>NetGrep is a system for searching protein interaction networks for matches to user-supplied network schemas.</p>
Abstract
NetGrep (http://genomics.princeton.edu/singhlab/netgrep/) is a system for searching protein interaction networks for matches to user-supplied 'network schemas'. Each schema consists of descriptions of proteins (for example, their molecular functions or putative domains) along with the desired topology and types of interactions among them. Schemas can thus describe domain-domain interactions, signaling and regulatory pathways, or more complex network patterns. NetGrep provides an advanced graphical interface for specifying schemas and fast algorithms for extracting their matches.
Rationale
High-throughput experimental and computational approaches to characterize proteins and their interactions have resulted in large-scale biological networks for many organisms. These complex networks are composed of a number of distinct types of interactions: these include inter-actions between proteins that interact physically, that partic-ipate in a synthetic lethal or epistatic relationship, that are coexpressed, or where one phosphorylates or regulates another (for a review, see [1]). Though incomplete and noisy, these networks provide a holistic view of the functioning of the cell, and with appropriate computational analysis and experimental work have significant potential for helping to uncover precisely how complex biological processes are accomplished.
We have developed a network analysis system based on que-rying interactomes using templates corresponding to network patterns of interest. Searching for recurring patterns in bio-logical data has been the backbone of much research in com-putational biology; for example, within the context of
sequence analysis, it has given rise to extensive work on sequence alignments and sequence motif discovery and has resulted in large sequence motif libraries. Not surprisingly, within the burgeoning field of biological network analysis, considerable effort has been focused on uncovering recurring patterns within interactomes. Mapping homologous proteins with conserved interaction patterns in different interactomes has revealed shared modules and complexes recurring across a range of organisms [2-6]. Analysis of the wiring diagrams of interactomes has uncovered network motifs that occur more frequently than expected by chance [7-13]. Additionally, there has been much work on uncovering recurring domain-domain interactions in physical interactomes [14-23], both to suggest a physical basis for known interactions and to help predict new interactions. Most closely related to the work described here are previous attempts to query biological net-works using particular user-supplied subgraphs [24-29].
In this paper, we introduce a system, NetGrep, that integrates the wealth of prior information known about individual pro-teins - for example, their functional annotations, sequence Published: 18 September 2008
Genome Biology 2008, 9:R138 (doi:10.1186/gb-2008-9-9-r138)
Received: 11 May 2008 Revised: 22 August 2008 Accepted: 18 September 2008 The electronic version of this article is the complete one and can be
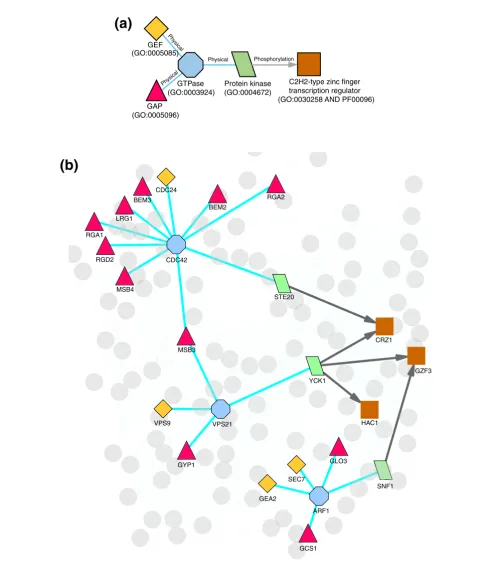
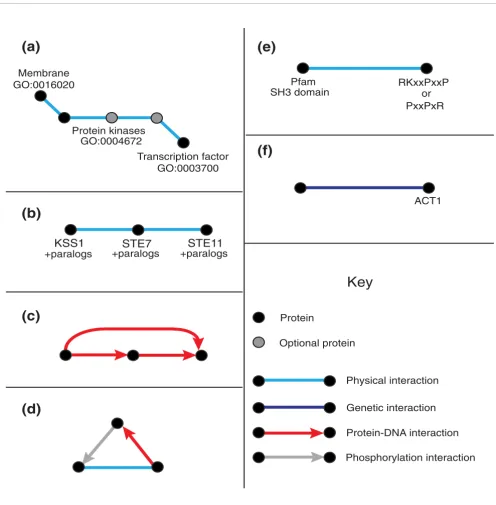
motifs, predicted domain structures, or other attributes -within the context of user-directed network searches. In par-ticular, NetGrep utilizes 'network schemas' to describe pat-terns in interaction networks and incorporates fast algorithms to search for matches of these schemas within net-works. A network schema describes a group of proteins with specific characteristics and with the desired topology and types of interactions connecting them (Figure 1a). A schema's matches, or instances, in an interactome are subgraphs of the interaction network that are made up of proteins having the specified characteristics, which interact with one another as dictated by the schema's topology (Figure 1b). In graph-theo-retic terms, a schema corresponds to a graph with labeled nodes and edges, and finding instances of a schema within an interactome corresponds to solving a subgraph isomorphism problem. The NetGrep system allows querying with schemas described via a diverse set of protein features, including Prosite family [30], Pfam motif [31], SMART domain [32,33], Supfam superfamily [34], and Gene Ontology (GO) [35] annotations. Proteins may also be specified via particular protein IDs, homology to other proteins, regular expressions over amino acids, or with unions or intersections over any of the previously described features. By utilizing these protein attributes in combination with physical, genetic, phosphor-ylation, regulatory, and/or coexpression interactions (as available for the organism of interest via high-throughput experiments), the network schema queries allowed in Net-Grep generalize many previously studied interaction pat-terns. For example, a general network schema relating to signaling is a path of physically interacting proteins, where the first protein is a receptor, and the last protein is a tran-scription factor (Figure 2a); such queries have been used in conjunction with gene expression data to infer signaling path-ways in Saccharomyces cerevisiae [36]. A more specific net-work schema relating to signaling consists of particular proteins making up a pathway that can be used to search for paralogous pathways (Figure 2b), as has been suggested in network alignment approaches [37]. Network motifs have been widely studied [7,8], and can be described by schemas without constraints on protein types but with particular inter-action types specified (Figures 2c,d). Domain-domain or domain-peptide interactions, such as those important for cell signaling and regulatory systems [38], can be represented by two-protein schemas with the proteins appropriately con-strained (Figure 2e). Schemas relating to specific proteins of interest are also easily incorporated (Figure 2f). Finally, net-work schemas can be naturally extended to handle approxi-mate matches by specifying optional nodes (Figure 2a). While these types of network interaction patterns have been studied in a wide-range of contexts, it has not even been possible to use many of them as queries in existing systems. Thus, we have introduced NetGrep to provide a flexible, unified system for interrogating an interactome using a diverse set of que-ries.
In addition to allowing a broad range of network schema que-ries, NetGrep has an easy-to-use graphical interface for input-ting schemas. For each user-input schema, NetGrep finds all of its matches in the chosen interactome. Although the search problem is a case of the computationally difficult subgraph isomorphism problem, we have been able to develop algo-rithms that take advantage of schema characteristics for bio-logical networks. As a result, NetGrep's core algorithms are extremely fast in practice for queries with up to several thou-sand matches in the interactomes studied. Though speed is useful for individual user queries, it also makes it possible to systematically enumerate and query many network interac-tion patterns. For example, here we have systematically tested NetGrep's underlying algorithms by enumerating >100,000 schema queries with proteins described via GO molecular function terms and have found that for schemas with up to tens of thousands of matches, NetGrep can rapidly uncover all instances. Our algorithms can thus enable new analysis that characterizes networks with respect to the types and numbers of interaction patterns found (for example, see [39]).
Relationship to previous work
There are several previously developed tools for querying bio-logical networks. While none of them have the functionality of NetGrep, we briefly review them here. Previous approaches fall broadly into the categories of network alignment, network motif finding, and specific subgraph queries, although these categories overlap.
Network alignment tools [4,5,37,40] align protein-protein interaction networks by combining interaction topology and protein sequence similarity to identify conserved pathways. These tools can be used to identify schemas for which the cri-terion for matching a query protein to a target protein is sequence similarity. Network alignment has also been applied to metabolic networks [24], with proteins characterized by their enzyme classification. Algorithmically, these approaches are designed for aligning entire interactomes, and several of them are based on local alignments based on sim-pler linear or tree topologies. NetGrep in contrast is devel-oped and optimized for general network schema queries, and has faster algorithms for the task at hand.
A sample schema and its instances in yeast
Figure 1
A sample schema and its instances in yeast. (a) An example of a schema. Each protein in the schema has a specific feature description and each edge has a type. In this case, the schema describes Ras GTPase signaling, where small G proteins from the Ras family are regulated by GTPase activating proteins (GAPs) and Guanine nucleotide exchange factors (GEFs), and in turn regulate effector kinases, which may phosphorylate other proteins. (b) Instances of the schema in S. cerevisiae.
GTPase (GO:0003924) GEF
(GO:0005085)
GAP (GO:0005096)
Protein kinase (GO:0004672)
C2H2-type zinc finger transcription regulator (GO:0030258 AND PF00096) Ph
ysical
Physical Phosphorylation
Physical
CDC24 BEM3
LRG1
RGA1
RGD2
STE20 MSB4
MSB3
VPS9 VPS21
GYP1
GEA2
GLO3
SNF1
ARF1
GCS1
HAC1 YCK1
CDC42
RGA2 BEM2
GZF3
(a)
(b)
SEC7
Sample schemas
Figure 2
Sample schemas. Examples of network schemas. Unlabeled schema proteins are considered to be 'wildcards' and can match any protein in the interaction network. (a) A signaling pathway schema. This schema matches all sets of proteins such that a protein in the cell membrane physically interacts with a succession of anywhere between one and three kinases, the last of which physically interacts with a protein that is a transcription factor. (b) A MAP kinase schema, specified by particular yeast proteins making up a canonical MAPK signaling pathway. (c) A feed-forward loop network motif [8] schema. The unlabeled nodes can match any protein in the network. (d) A 'kinate' feedback loop network motif schema [13]. (e) An SH3 domain interaction schema. This schema matches all interacting pairs of proteins such that one contains a Pfam SH3 domain and the other has one of the specified patterns, corresponding to SH3 binding sites, in its underlying amino acid sequence. Amino acids in the pattern are specified by their one letter code, and 'x' denotes a match to any amino acid. (f) A specific protein schema. This schema matches all proteins with a synthetic lethal relationship to yeast protein ACT1.
(a)
Membrane GO:0016020
Protein kinases GO:0004672
Transcription factor GO:0003700
(d)
(f)
ACT1
(b)
KSS1
STE7
STE11
+paralogs +paralogs +paralogs
(e)
Pfam
SH3 domain RKxxPxxP PxxPxR
or
(c)
Key
Physical interaction
Phosphorylation interaction Protein-DNA interaction Genetic interaction Protein
the total number of instances of network motifs [43,44], may be more suitable if network motif queries are desired.
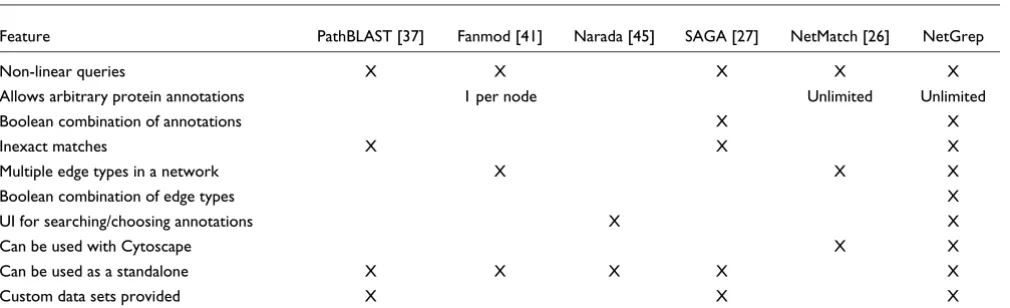
Other more closely related tools have been implemented to query biological networks using subgraphs. Given a linear sequence of GO functional attributes, Narada [45] finds all occurrences of the corresponding linear paths in a network. MOTUS [25] is designed for non-topology constrained sub-graph searches in metabolic networks. Qnet [28] is restricted to tree queries and utilizes only sequence similarity. Net-Match [26], extending ideas of GraphGrep [46], allows users to search for subgraphs within the Cytoscape [47] environ-ment and can be used for simple schema queries. SAGA [27] is a subgraph matching tool for Linux platforms that allows inexact matches to a query in multiple networks, and has built-in support for biological networks where proteins are described via orthologous groups. In contrast to these approaches, NetGrep is a standalone, multi-platform system where schemas may have arbitrary topologies as well as a large set of built-in protein and interaction types. NetGrep schemas allow flexibility via optional nodes (thereby permit-ting inexact matches) and protein and interaction descrip-tions that may consist of boolean conjuncdescrip-tions or disjuncdescrip-tions of features. While NetGrep comes with built-in protein fea-ture and interaction data sets for several model organisms, it also has the ability to incorporate new custom networks and associated feature sets. Furthermore, NetGrep can optionally be used within the Cytoscape environment to visualize schema matches. See Table 1 for a comparison of features available in NetGrep and previous approaches.
Implementation
We have implemented NetGrep in Java so that it is easily portable among different operating systems. Users have the option of running a feature-limited version of the software on
our server [48] or of downloading the fully featured program and running it locally. NetGrep can be used both as a stan-dalone application or in conjunction with Cytoscape as a plugin if visualization of the results in network form is desired. A detailed description of how to use NetGrep is pro-vided online [49]. More formal descriptions of schemas, their instances in the interactome, and the algorithms used to uncover the instances are given in the 'Model and algorithm' section below.
Packaged data files
Data files are provided for the following model organisms to be used with NetGrep: S. cerevisiae, Caenorhabditis elegans, Drosophila melanogaster and Homo sapiens. These files contain all the information necessary to run NetGrep, includ-ing protein information (names and aliases), interaction maps, and protein features.
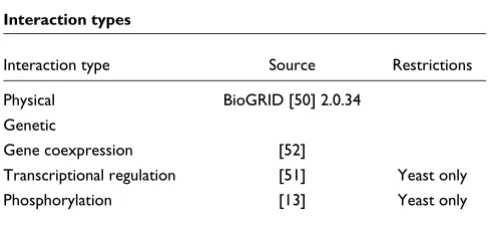
Tables 2 and 3 list the protein features and edge types included in these data files. Physical and genetic interactions for all organisms are obtained from BioGrid [50] (version 2.0.34), and phosphorylation interactions for yeast are obtained from [13]. Regulatory relationships in yeast are obtained from the binding data of [51] using a p-value/cutoff of 1e-5. Gene expression interactions between pairs of pro-teins are taken as those that have linear correlation coefficient >0.8 on the concatenation of all experiments in the gene coexpression data compiled by [52]; we note that this high cutoff and required correlation in all conditions favors expression interactions between housekeeping proteins.
[image:5.612.55.560.559.713.2]One important feature of NetGrep is that none of the data are hard-coded into the program. Users can therefore use any node features or edge types desired when constructing net-works; for example, custom or newly defined interaction
Table 1
Feature comparisons
Feature PathBLAST [37] Fanmod [41] Narada [45] SAGA [27] NetMatch [26] NetGrep
Non-linear queries X X X X X
Allows arbitrary protein annotations 1 per node Unlimited Unlimited Boolean combination of annotations X X
Inexact matches X X X
Multiple edge types in a network X X X
Boolean combination of edge types X
UI for searching/choosing annotations X X
Can be used with Cytoscape X X
Can be used as a standalone X X X X X
Custom data sets provided X X X
types can be added. Additionally, creating data files for other, non-supported organisms is a straightforward process.
Describing proteins and interactions
Nodes, describing proteins, are added to a schema via a visual canvas, and then individual features of the proteins can be selected (Figure 3a). The interactome to be queried is speci-fied via a pull-down menu (Figure 3b). Each of the nodes in a schema can be annotated with any combination of protein features; multiple features are related by boolean combina-tions via ANDs or ORs. A node in a schema can be connected to any other, corresponding to a desired interaction, also by specifying this in the visual canvas. These edges between nodes can be described as having one or more types (Figure 3c). As with protein features, edge types may be combined with logical ANDs or ORs. For example, one might require that two given proteins physically interact AND that the first is a transcription factor regulating the second. Note that a schema must be a connected graph.
Specifying inexact matches
The schemas described thus far are rigid in their structure. Occasionally, a user might prefer to specify that any number of proteins with a particular feature set interact in a cascade or that a given node in the schema not be absolutely required. NetGrep achieves this flexibility by allowing nodes in the
schema to be designated as optional. When a schema contains an optional node, NetGrep will find matches both with and without the given protein. For example, to represent a signal-ing pathway as 'a protein in the membrane, which interacts with a succession of between one and three kinases, the last of which interacts with a transcription factor', one would build the given linear five-node pathway and designate two of the kinases as optional (Figure 2a). NetGrep would then find all three-, four-, and five-node matches within the network. Note that single nodes with more than two interactions cannot be designated as optional. When an optional node has two inter-actions, the interaction types are logically ORed for instances of the schema that have the optional node excluded.
Similarly, a significant problem with current interaction data-sets is that they are incomplete. NetGrep provides a solution to this difficulty by also allowing interactions in a schema to be designated as optional. When a schema contains an optional interaction, NetGrep will allow matches even if the given interaction is not found in the network.
Matches and reliabilities
NetGrep has a user-set threshold that limits the number of matches reported for an input schema (Figure 3b). As a typi-cal user is not expected to look through tens of thousands of matches, this threshold can be as low as 100 and as high as 50,000. For faster run times, a lower threshold is recom-mended; additionally, the threshold limits memory usage. Alternatively, if the total number of instances is greater than the highest allowed threshold, there is an advanced (some-what slower) option that computes the total number of instances but does not explicitly enumerate them.
The instances of a query schema are returned by NetGrep, up to the user-defined threshold, and are sorted according to how confident we are of the underlying interactions. In par-ticular, for each pair of proteins, we have a single precom-puted reliability value between 0 and 1 that assesses how likely these two proteins are to interact (see 'Interaction reli-abilities' section below). For each of the matches found by NetGrep, its overall reliability is computed by multiplying together the reliabilities corresponding to protein pairs that have interactions in the matches. The matches are sorted based on the negative log of this value, beginning with the most reliable (Figure 3d).
Performance
We have found NetGrep to run extremely fast in practice. We illustrate the performance of NetGrep in two ways. First, we report how long NetGrep takes for each of the schemas shown in Figure 2. As a comparison, whenever possible, we have also run these schemas on the same network using other tools. For each system, the software is downloaded and run on a laptop running Windows XP with 1 GB RAM and a 1.66 GHz Intel processor. All queries are run on our S. cerevisiae network Table 2
Protein features
Protein feature Source
Gene names and aliases BioGRID [50] 2.0.34 Amino acid sequences Biomart [58]
Paralogs COG [59], Biomart [58] Pfam A/B motifs Pfam [31] 21.0 SMART [32,33] motifs InterPro [60] 15.0 Prosite [30] motifs
SCOP [34] superfamilies
GO functional annotations GO [35] 05/2007 download
[image:6.612.53.297.623.735.2]Protein features used to annotate proteins in the built-in data sets provided with NetGrep.
Table 3
Interaction types
Interaction type Source Restrictions
Physical BioGRID [50] 2.0.34 Genetic
Gene coexpression [52]
data, described above. All timings include the times for both the search and output of the results. Default settings for all programs are used. While we have NetGrep print out its wall clock time to standard output, the timings for the other sys-tems are estimated via a handheld timer and rounded down to the nearest second. We have chosen this process as some of the systems must be run within a graphical interface and strict system timing calls are not possible. Each query is repeated ten times and the reported running times are the averages over these runs. Table 4 shows the performances for each sample query. Note that table entries are left blank for
schemas that cannot be run on a given system and two of these queries can currently be run only on NetGrep. NetGrep has considerably faster query times for all sample queries, and is often more than an order of magnitude faster than pre-vious approaches.
[image:7.612.56.555.86.521.2]Second, we have run NetGrep in a systematic fashion on sche-mas consisting of physical interactions in triangular, 4-node linear 'quad,' and 4-node branched (that is, a central node interacting with three others) 'Y-star' topologies. We consider all possible ways to annotate the proteins in these topologies NetGrep screenshot
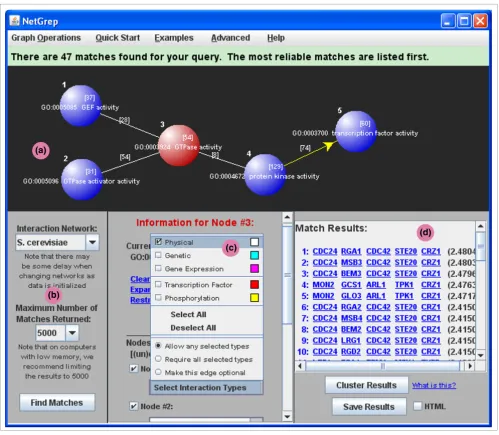
Figure 3
NetGrep screenshot. A detailed screenshot of the NetGrep display showing a sample query schema. (a) The graph panel area used to describe schemas. The Ras GTPase signaling schema from Figure 1 is shown in the panel with the Ras GTPase node highlighted. (b) The panel used to designate which interaction network to use, to choose the maximum number of matches desired, and to initiate a search. (c) The panel used to annotate nodes in the schema and to create or modify edges. The information for the highlighted node (node 3) is currently displayed in the panel; the edge between the first and third nodes is being modified. (d) The results panel in which the matches found from the search are displayed. Each row lists the proteins that make up a particular match along with its reliability score.
(b) (a)
using GO molecular function slim [53] terms (see Additional data file 1 for terms used). We have chosen these types of schemas because of their linear, branched, and cyclical topol-ogies, and because we are easily able to exhaustively enumer-ate over all possible schemas of this type on a standard laptop. Additionally, GO annotations can be utilized with queries in two previous systems, NetMatch and Narada (though Narada is limited to the linear schemas). There are 1,771 triangular
[image:8.612.51.556.477.705.2]schemas, 101,871 quad schemas, and 37,191 Y-star GO molec-ular function slim schemas. Since each GO slim term is gen-eral and can annotate many proteins, we set the threshold for the maximum number of matches allowed to 80,000. Of the schemas, almost all have fewer than 80,000 instances in S. cerevisiae (all triangular schemas, 97,170 quad schemas and 37,129 Y-star schemas). Statistics about how long NetGrep takes to retrieve all instances for each query that has between Table 4
Running time comparisons
Running time (s)
Sample query PathBLAST Fanmod Narada NetMatch NetGrep
Signaling pathway 1 28 4.2
Signaling pathway 2 26.9
MAPK pathway 90 0.02
Feed-forward motif 32 5.2 1.4
Kinate motif 32 5 0.5
SH3 domain interaction 0.5
ACT1 genetic interaction 15 0.1
Running times (in seconds) for several sample queries on the S. cerevisiae interaction network, using PathBLAST, Fanmod, Narada, NetMatch and NetGrep. All reported running times are for search and output only. As in Table 1, PathBLAST is used as a prototypical example of a network alignment tool and Fanmod represents network motif finders. Note that SAGA is excluded here because it cannot be run on Windows. The sample schemas correspond to those provided in Figure 2, except that two distinct queries are used for Figure 2a. In the first, all three kinases in the pathway are required. In the second, two of the kinases are designated as optional (as in Figure 2a). Each query is run ten times and the average computation time is provided. Row entries are left blank for any tool that is unable to find instances of a particular schema because of feature limitations.
Table 5
GO MF running time comparisons
Running time (s)
Topology Query Narada NetMatch NetGrep
Triangle GO:0003677, GO:0004386, GO:0004672 15 0.1 Triangle GO:0004386, GO:0004672, GO:0030528 16 0.2 Triangle GO:0003723, GO:0003723, GO:0003723 15 1.9 Quad GO:0004386, GO:0003677, GO:0016874, GO:0016829 1 14 0.2 Quad GO:0016787, GO:0030234, GO:0005515, GO:0008233 2.3 17 1.2 Quad GO:0003677, GO:0003723, GO:0005515, GO:0005198 4 16 1.9 Quad GO:0016787, GO:0005198, GO:0003677, GO:0016779 2.2 17 1.7 Quad GO:0016787, GO:0016740, GO:0016779, GO:0030528 4.8 16 2.9 Y-star GO:0008233, GO:0016874, GO:0030234, GO:0005215 15 0.2 Y-star GO:0005515, GO:0004721, GO:0008233, GO:0016740 17 0.8 Y-star GO:0005515, GO:0008233, GO:0005198, GO:0005215 17 3.9 Y-star GO:0030528, GO:0005515, GO:0016740, GO:0005215 14 1.5 Y-star GO:0016740, GO:0005515, GO:0030528, GO:0005215 14 5.2
A comparison of running times (in seconds) for several sample schemas annotated with GO molecular function slim terms on the S. cerevisiae
5 and 80,000 instances in yeast are given in Figure 4; we exclude schemas with fewer than 5 matches as they typically take less time. As can be seen, matches for each of these que-ries are found within 100 seconds, but the vast majority in fact take less than even 10 seconds. We are not able to time NetMatch and Narada in a systematic manner; thus, we have arbitrarily chosen three triangle, five quad, and five Y-star molecular function queries, to give a sampling of run times for these previous approaches on these types of schemas. The schemas and their timings are shown in Table 5.
Model and algorithm
Graph modelWe give a formal specification of the problem. Let L be the set of possible protein labels (for example, Pfam motifs, protein IDs, and so on) and let T be the set of possible edge types (for example, physical, regulatory, and so on). An interaction net-work is represented as a mixed graph G = (VN,EN,AN). VN is the set of vertices, with a vertex v ∈VN for each protein. EN ⊆
VN × VN is the set of undirected edges, and AN ⊆VN × VN is the
set of arcs or directed edges. Vertices correspond to proteins and edges and arcs correspond to interactions. Each vertex v in the interaction network is associated with a set of features l(v) ⊂L (specifying protein features), each edge (u,v) is asso-ciated with a set of types te(u,v) ∈T (specifying the undirected interactions between the proteins), and each arc (u,v) is asso-ciated with a set of types ta(u,v) ∈T (specifying the directed interactions between the proteins). If there is no edge between u and v, te(u,v) = ∅, and if there is no arc between u and v, ta(u,v) = ∅.
A network schema is a mixed graph H = (VS,ES,AS) such that: (1) each vertex v ∈VS is associated with description set Dv such that each d ∈Dv is a subset of L (in NetGrep, the set Dv is constructed via individual protein features in L and utiliz-ing either intersections or unions over these features; for example, for a particular vertex v ∈VS, if a union is taken over individual feature types, Dv consists of singleton sets consist-ing of each of these features; note that Dv can consist of one set, the emptyset, in the case of a wildcard vertex); (2) for every pair of vertices u and v such that (u,v) ∈ES ∪AS, there is an associated description set D'u,v ⊂T (in NetGrep, the set D'u,v is constructed via individual interaction types, and requiring either all of them, or just one of them; for example, for a particular pair of vertices u and v with desired edges or arcs between them, if all interactions are required, then D'u,v consists of a single set consisting of all desired interaction types).
An instance of a network schema H in an interaction network G (that is, a match in the network for the schema) is a sub-graph (VI,EI,AI) where VI ⊂VN, EI ⊂EN, and AI ⊂AN such that there is a one-to-one mapping f:VS→VI where: (1) for each v
∈VS, there exists a d ∈Dv such that d ⊂l(f(v)); (2) for each pair of vertices u,v ∈VS with (u,v) ∈ES ∪AS, there exists a d'
∈D'u,v such that d' ⊂ (te(f(u),f(v)) ∪ta(f(u),f(v))). Note that two distinct instances of a schema may share proteins and/or interactions; however, any two instances must differ in at least one protein. Network schemas are used to interrogate the interaction network for sets of proteins that match this description.
Interaction reliability
[image:9.612.55.297.85.366.2]For each pair of proteins, we estimate the reliability of their having any interaction between them. In particular, we first partition all the observed underlying interactions in the inter-actome into several experimental groups. The reliability of each experimental group i is then evaluated as follows. For experiments determining non-genetic interactions, the relia-bility is estimated based on 'functional coherence' by comput-ing si as the fraction of interactions in that group that are between proteins sharing a high-level GO biological process slim term [53] (only pairs of interacting proteins that both have GO slim annotations are considered). We note that we do not use the functional coherence measure to assess genetic interaction experiments, as these types of interactions can Yeast GO molecular function schema timings
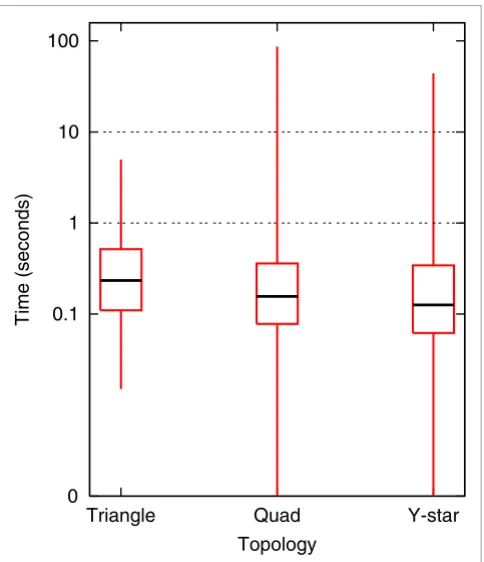
Figure 4
Yeast GO molecular function schema timings. All possible triangular, 4-node linear, and 4-4-node branched schemas ('Y-star') with 4-nodes described via GO molecular function slim terms were run systematically on NetGrep. Results are reported for those schemas with at least 5 but no more than 80,000 instances in S. cerevisiae: 780 triangular schemas; 80,719 4-node linear schemas; and 30,642 4-node branched schemas. Boxplots of the running times for each topology are given; boxplots are a convenient way of depicting the smallest observation, second quartile, median, third quartile, and largest observation in the data.
0 0.1 1 10 100
Triangle Quad Y-star
Time (seconds)
bridge between pathways [54]. Instead, for these experi-ments, the reliability is estimated based on a '2-hop' topolog-ical measure that has been shown to be highly predictive of genetic interactions [55]. In particular, the reliability si for an experimental group determining genetic interactions is esti-mated by computing the fraction of interactions in that group that additionally have paths of length two between them in the full interactome where either both interactions are genetic interactions or where one is a genetic interaction and the other is a physical interaction. Then, for a pair of proteins u and v, we consider all interactions j found between them, and treat them as independent events. The reliability r(u,v) between u and v is then computed as:
r(u,v) = 1 - Πj(1 - sg(j))
where j ranges over all interactions linking proteins u and v, and g(j) gives the experimental group of interaction j. If no interactions exist between the two proteins, r(u,v) = 0. This noisy-or scheme is similar to the one used for reliability esti-mation in [56,57].
We partition our interactions into the following experimental groups. For physical and genetic interactions, there is one group for each individual high-throughput physical and genetic interaction experiment (defined as those that discover at least 50 interactions). All small-scale physical interaction experiments (defined as those that discover fewer than 50 interactions) are considered as belonging to a single group. Similarly, small-scale genetic interaction experiments are considered a single group. Experiments are identified by the combination of 'Experimental System' and 'PubMed ID' as reported by the BioGRID [50]. All phosphorylation interac-tions in [13] are considered in one group. In the case of inter-actions that are associated with continuous numerical data, such as coexpression interactions (associated with the corre-lation coefficient) and regulatory interactions [51] (associated with the p-value for the binding), we assign each interaction to one of 20 uniform bins associated with the numerical data, and consider each bin as a separate group.
Searching for schemas
Overview
Finding the matches for a particular schema in a network cor-responds to the computationally difficult subgraph isomor-phism problem. A number of sophisticated algorithmic approaches for closely related problems on biological net-works have been introduced earlier (for example, utilizing color coding [28]). Here, we obtain fast matches in practice utilizing a few key ideas. First, we pre-process the interac-tome to build fast look up tables mapping protein and inter-action type labels to proteins associated with the labels. For each node in a schema, this allows us to quickly enumerate the set of all proteins that match the node's feature set. Sec-ond, we utilize the labeled schema nodes and schema edges to prune the search space. In particular, we constrain the
pro-teins in each node match set by determining interaction matches along each edge in the schema. Finally, these inter-actions are cached for fast lookup in the last step, in which we enumerate the considerably smaller search space, and con-struct the full list of matches. We describe these steps in more detail below.
Algorithm
We first pre-process the interactome to maintain two hashes that map labels to proteins associated with those labels. HASHF maps protein features to sets of vertices described by those features (for example, all kinases), and HASHT maps edge types to pairs of proteins connected by an edge anno-tated with the types (for example, all proteins with physical interactions). For directed edge types, there are two separate entries in HASHT, one for each direction of the edge (for example, one for all kinases and one for all substrates). These hashes are used to quickly build, for any schema, its matches edge by edge.
When searching for instances of a particular schema, we asso-ciate with each node v in the schema a set of node matches NMATCHv, which contains all of the proteins in the interac-tion network that are described by that particular schema node (that is, the proteins that could be a match to that schema node). Specifically, we use HASHF to initialize NMATCHv with all the proteins that match v's feature set. When features are combined with a boolean AND, we take the intersection of the protein sets from HASHF, and when they are combined with a boolean OR, we take the union of the protein sets. For each edge e = (u,v) in the schema that has a single type (that is, is not composed of a boolean combination of types) or for which all edge types are required (that is, types are combined by a logical AND), we use HASHT to trim the proteins in each node match set. For example, if schema node v is connected by a physical edge, then we can remove all pro-teins from NMATCHv that are not found in the set from HASHT corresponding to all proteins in the network con-nected by a physical edge.
neighbor with the smallest node match set. We then consider the node with the next smallest node match set, and so on. Second, as we iterate through the schema edges, we cache the matches for each edge, so that they can be quickly accessed in the next step where we find the actual matches. Note that this pruning step is skipped with optional nodes because edges connected to those nodes are not required. This pruning step is also skipped for edges if their match bins are too large (>1,000).
To find the sets of proteins that match the given schema, we iterate through each of the node match sets from smallest to largest, constructing matches as we go along. We note that this search order over the nodes provides a significant speed-up over a simpler approach that performs depth-first search from an arbitrary starting node in the schema. As we iterate through the nodes, for each protein p in a given match set rep-resenting node v in the schema, we constrain each larger match set representing node u in the schema as follows: if u and v are connected by an edge in the schema, we eliminate all proteins in u's match set that do not interact with p (using the cached matches from the pruning step above). Further-more, we remove p from u's set if it is there (that is, we do not allow the same protein to occur in multiple positions of a match). We then set p as the matching protein at schema node v for this particular set of matches and traverse to the next largest node match set. Once a complete match to a schema is found, we backtrack and continue the search process.
If at any point the number of matches to a schema exceeds the user-defined threshold (Figure 2b), the search is terminated and NetGrep returns just those matches found up to that point. Once all matches to a schema are found, they are sorted by their interaction reliability, as described above.
Symmetric schemas
When a schema displays an inherent symmetry, it is often the case that the same set of proteins redundantly occurs in mul-tiple instances. Consider, for example, the symmetric linear three-node schema A-B-A, where the edges are undirected, and the first and last nodes have identical feature sets and are symmetric around the middle node. One might find among the matches of this schema the proteins p1-p2-p3 and p3-p2-p1. NetGrep is able to determine that a given schema is symmet-ric and excludes these superfluous matches from the results returned by the search. The test for symmetry exploits the fact that for any two given nodes in a schema to be symmetric they need to have the exact same feature set and degree; for all pairs of nodes u and v in the schema for which this is true, the algorithm recursively checks all pairs of nodes connected to these two target nodes (that is, one connected to u and one connected to v) for symmetry, following any given edge just one time. This is equivalent to a depth first search over the schema. The base case in the recursive algorithm occurs when two target nodes are connected to each other or when they are connected to the same node.
If a query is determined to be symmetric, redundant matches are ignored during the search. To accomplish this task, each protein in the interaction network is first assigned an arbi-trary unique ID number, as are each of the nodes in the query schema. Then, for any two symmetric nodes A and B in a query schema where the ID of A is smaller than the ID of B, we require that the ID of any protein matching node A be smaller than the ID of a protein matching node B in any given instance. All instances for which this requirement is not met for each of the symmetric nodes are ignored.
Conclusion
We have introduced NetGrep, a powerful Java system for searching protein interactomes for instances of user-supplied labeled subgraphs, or network schemas, and have provided fully-featured data files for several organisms. NetGrep allows a wide-range of possible queries that supersede many previously studied interaction patterns. Finally, we have described an algorithm for solving the labeled subgraph iso-morphism problem that is fast and effective in practice for biological networks.
Availability and requirements
Project name: NetGrep
Project home page: [48]
Operating systems: Windows, Mac OS, Linux
Programming language: Java
Other requirements: Java 1.5 or higher
License: Open source with GNU General Public License
Abbreviations
GO, Gene Ontology.
Authors' contributions
EB designed and implemented the algorithms and system, performed data analysis, and co-wrote the paper. EN inte-grated interaction data sets, performed data analysis, and co-wrote the paper. RP developed software for the system. MS conceived and supervised the study, performed data analysis, and co-wrote the paper.
Additional data files
The following additional data are available. Additional data file 1 is a table listing the GO molecular function slim terms used in the systematic testing of our program.
Additional data file 1
GO molecular function slim terms used in the systematic testing of our program
GO molecular function slim terms used in the systematic testing of our program.
Acknowledgements
MS thanks the NSF for grants MCB-0093399 and CCF-0542187, and the NIH for grants CA041086 and GM076275. EB is supported by the Quanti-tative and Computational Biology Program NIH grant T32 HG003284. This research has also been supported by the NIH Center of Excellence grant P50 GM071508. The authors thank the members of the Singh group for many helpful discussions.
References
1. Zhu X, Gerstein M, Snyder M: Getting connected: analysis and principles of biological networks. Genes Dev 2007, 21:1010-1024.
2. Kelley BP, Sharan R, Karp RM, Sittler T, Root DE, Stockwell BR, Ideker T: Conserved pathways within bacteria and yeast as revealed by global protein network alignment. Proc Natl Acad Sci USA 2003, 100:11394-11399.
3. Sharan R, Suthram S, Kelley RM, Kuhn T, McCuine S, Uetz P, Sittler T, Karp RM, Ideker T: Conserved patterns of protein interac-tion in multiple species. Proc Natl Acad Sci USA 2005, 102:1974-1979.
4. Koyutürk M, Kim Y, Topkara U, Subramaniam S, Szpankowski W, Grama A: Pairwise alignment of protein interaction networks. J Comput Biol 2006, 13:182-199.
5. Flannick J, Novak A, Srinivasan B, McAdams H, Batzoglou S: Graem-lin: general and robust alignment of multiple large interac-tion networks. Genome Res 2006, 16:1169-1181.
6. Singh R, Xu J, Berger B: Pairwise global alignment of protein interaction networks by matching neighborhood topology. In Proceedings of the 11th International Conference on Research in Com-putational Molecular Biology (RECOMB): Oakland, CA, USA; 21-25 April 2007 Volume 4453. Edited by: Speed TP, Huang H. New York: Springer; 2007:16-31. [Lecture Notes in Computer Science]
7. Shen-Orr SS, Milo R, Mangan S, Alon U: Network motifs in the transcriptional regulation network of Escherichia coli. Nat Genet 2002, 31:64-68.
8. Milo R, Shen-Orr S, Itzkovitz S, Kashtan N, Chklovskii D, Alon U: Network motifs: simple building blocks of complex net-works. Science 2002, 298:824-827.
9. Lee TI, Rinaldi NJ, Robert F, Odom DT, Bar-Joseph Z, Gerber G, Hannett NM, Harbison CT, Thompson CM, Simon I, Zeitlinger J, Jen-nings EG, Murray HL, Gordon DB, Ren B, Wyrick JJ, Tagne JB, Volkert TL, Fraenkel E, Gifford DK, Young RA: Transcriptional regulatory networks in Saccharomyces cerevisiae. Science 2002, 298:799-804.
10. Yeger-Lotem E, Sattath S, Kashtan N, Izkovitz S, Milo R, Pinter RY, Alon U, Margalit H: Network motifs in integrated cellular net-works of transcription-regulation and protein-protein inter-action. Proc Natl Acad Sci USA 2004, 101:5934-5939.
11. Luscombe NM, Babu MM, Yu H, Snyder M, Teichmann SA, Gerstein M: Genomic analysis of regulatory network dynamics reveals large topological changes. Nature 2004, 431:308-312.
12. Zhang LV, King OD, Wong SL, Goldberg DS, Tong AH, Lesage G, Andrews B, Bussey H, Boone C, Roth FP: Motifs, themes and the-matic maps of an integrated Saccharomyces cerevisiae inter-action network. J Biol 2005, 4:6.
13. Ptacek J, Devgan G, Michaud G, Zhu H, Zhu X, Fasolo J, Guo H, Jona G, Breitkreutz A, Sopko R, McCartney RR, Schmidt MC, Rachidi N, Lee SJ, Mah AS, Meng L, Stark MJ, Stern DF, De Virgilio C, Tyers M, Andrews B, Gerstein M, Schweitzer B, Predki PF, Snyder M: Global analysis of protein phosphorylation in yeast. Nature 2005, 438:679-684.
14. Sprinzak E, Margalit H: Correlated sequence-signatures as markers of protein-protein interaction. J Mol Biol 2001, 311:681-692.
15. Gomez SM, Lo SH, Rzhetsky A: Probabilistic prediction of unknown metabolic and signal-transduction networks. Genet-ics 2001, 159:1291-1298.
16. Wojcik J, Schäcter V: Protein-protein interaction map infer-ence using interacting domain profile pairs. Bioinformatics 2001, 17(Suppl 1):S296-S305.
17. Deng M, Mehta S, Sun F, Chen T: Inferring domain-domain inter-actions from protein-protein interinter-actions. Genome Res 2002, 12:1540-1548.
18. Giot L, Bader J, Brouwer C, Chaudhuri A, Kuang B, Li Y, Hao Y, Ooi C, Godwin B, Vitols E, Vijayadamodar G, Pochart P, Machineni H,
Welsh M, Kong Y, Zerhusen B, Malcolm R, Varrone Z, Collis A, Minto M, Burgess S, McDaniel L, Stimpson E, Spriggs F, Williams J, Neurath K, Ioime N, Agee M, Voss E, Furtak K, et al.: A protein interaction map of Drosophila melanogaster. Science 2003, 302:1727-1736. 19. Pagel P, Wong P, Frishman D: A domain interaction map based
on phylogenetic profiling. J Mol Biol 2004, 344:1331-1346. 20. Riley R, Lee C, Sabatti C, Eisenberg D: Inferring protein domain
interactions from databases of interacting proteins. Genome Biol 2005, 6:R89.
21. Nye TM, Berzuini C, Gilks WR, Babu MM, Teichmann SA: Statistical analysis of domains in interacting protein pairs. Bioinformatics 2005, 21:993-1001.
22. Guimarães KS, Jothi R, Zotenko E, Przytycka TM: Predicting domain-domain interactions using a parsimony approach. Genome Biol 2006, 7:R104.
23. Itzhaki Z, Akiva E, Altuvia Y, Margalit H: Evolutionary conserva-tion of domain-domain interacconserva-tions. Genome Biol 2006, 7:R125. 24. Pinter RY, Rokhlenko O, Yeger-Lotem E, Ziv-Ukelson M: Align-ment of metabolic pathways. Bioinformatics 2005, 21:3401-3408. 25. Lacroix V, Fernandes CG, Sagot MF: Motif search in graphs: Application to metabolic networks. IEEE/ACM Trans Comput Biol Bioinform 2006, 3:360-368.
26. Ferro A, Giugno R, Pigola G, Pulvirenti A, Skripin D, Bader GD, Sasha D: NetMatch: a Cytoscape plugin for searching biological networks. Bioinformatics 2007, 23:910-912.
27. Tian Y, McEachin RC, Santos C, States DJ, Patel JM: SAGA: a sub-graph matching tool for biological sub-graphs. Bioinformatics 2007, 23:232-239.
28. Dost B, Shlomi T, Gupta N, Ruppin E, Bafna V, Sharan R: QNet: a tool for querying protein interaction networks. In Proceedings of the 11th International Conference on Research in Computational Molec-ular Biology (RECOMB): Oakland, CA, USA; 21-25 April 2007 Volume 4453. Edited by: Speed TP, Huang H. New York: Springer; 2007:1-15. [Lecture Notes in Computer Science]
29. Cheng Q, Kaur D, Harrison R, Zelikovsky A: Filling metabolic pathways. In Proceedings of the RECOMB Satellite Conference on Sys-tems Biology: University of California, San Diego, CA, USA; 30 November-1 December 2007.
30. Hulo N, Sigrist CJ, Le Saux V, Langendijk-Genevaux PS, Bordoli L, Gattiker A, De Castro E, Bucher P, Bairoch A: Recent improve-ments to the PROSITE database. Nucleic Acids Res 2004, 32(Database issue):D134-D137.
31. Bateman A, Coin L, Durbin R, Finn RD, Hollich V, Griffiths-Jones S, Khanna A, Marshall M, Moxon S, Sonnhammer EL, Studholme DJ, Yeats C, Eddy SR: The Pfam protein familes database. Nucleic Acids Res 2004, 32(Database issue):D138-D141.
32. Schultz J, Milpetz F, Bork P, Ponting CP: SMART, a simple modu-lar architecture research tool: Identification of signaling domains. Proc Natl Acad Sci USA 1998, 95:5857-5864.
33. Letunic I, Copley RR, Schmidt S, Ciccarelli FD, Doerks T, Schultz J, Ponting CP, Bork P: SMART 4.0: towards genomic data integra-tion. Nucleic Acids Res 2004, 32(Database issue):D142-D144. 34. Gough J, Karplus K, Hughey R, Chothia C: Assignment of
homol-ogy to genome sequences using a library of hidden Markov models that represent all proteins of known structure. J Mol Biol 2001, 313:903-919.
35. Ashburner M, Ball CA, Blake JA, Botstein D, Butler H, Cherry JM, Davis AP, Dolinski K, Dwight SS, Eppig JT, Harris MA, Hill DP, Issel-Tarver L, Kasarskis A, Lewis S, Matese JC, Richardson JE, Ringwald M, Rubin GM, Sherlock G: Gene ontology: tool for the unification of biology. The Gene Ontology Consortium. Nat Genet 2000, 25:25-29.
36. Steffen M, Petti A, Aach J, D'haeseleer P, Church G: Automated modeling of signal transduction networks. BMC Bioinformatics 2002, 3:34.
37. Kelley BP, Yuan B, Lewitter F, Sharan R, Stockwell BR, Ideker T: PathBLAST: a tool for alignment of protein interaction net-works. Nucleic Acids Res 2004, 32(Web Server issue):W83-W88. 38. Pawson T, Nash P: Assembly of cell regulatory systems through protein interaction domains. Science 2003, 300:445-452.
39. Banks E, Nabieva E, Chazelle B, Singh M: Organization of physical interactomes as uncovered by network schemas. PLoS Comput Biol in press.
40. Kalaev M, Smoot M, Ideker T, Sharan R: NetworkBLAST: com-parative analysis of protein networks. Bioinformatics 2008, 24:594-596.
detection. Bioinformatics 2006, 22:1152-1153.
42. Schreiber F, Schwöbbermeyer H: MAVisto: a tool for the explo-ration of network motifs. Bioinformatics 2005, 21:3572-3574. 43. Grochow J, Kellis M: Network motif discovery using subgraph
enumeration and symmetry breaking. In Proceedings of the 11th International Conference on Research in Computational Molecular Biology (RECOMB): Oakland, CA, USA; 21-25 April 2007Volume 4453. Edited by: Speed TP, Huang H. New York: Springer; 2007:92-106. [Lecture Notes in Computer Science]
44. Alon N, Dao P, Hajirasouliha I, Hormozdiari F, Sahinalp SC: Biomo-lecular network motif counting and discovery by color cod-ing. Bioinformatics 2008, 24:i241-i249.
45. Pandey J, Koyutürk M, Kim Y, Szpankowski W, Subramanian S, Grama A: Functional annotation of regulatory pathways. Bioinformat-ics 2007, 23:i377-i386.
46. Giugno R, Shasha D: GraphGrep: a fast and universal method for querying graphs. In Proceedings of the International Conference on Pattern Recognition (ICPR): 11-15 August 2002; Quebec, CanadaVolume 2. IEEE Computer Society; 2002:112-115.
47. Shannon P, Markiel A, Ozier O, Baliga NS, Wang JT, Ramage D, Amin N, Schwikowski B, Ideker T: Cytoscape: a software environment for integrated models of biomolecular interaction networks. Genome Res 2003, 13:2498-2504.
48. NetGrep [http://genomics.princeton.edu/singhlab/netgrep/] 49. NetGrep User's Guide [http://genomics.princeton.edu/singhlab/
netgrep/guide.html]
50. Breitkreutz BJ, Stark C, Tyers M: Osprey: a network visualization system. Genome Biol 2003, 4:R22.
51. Harbison CT, Gordon DB, Lee TI, Rinaldi NJ, Macisaac KD, Danford TW, Hannett NM, Tagne JB, Reynolds DB, Yoo J, Jennings EG, Zei-tlinger J, Pokholok DK, Kellis M, Rolfe PA, Takusagawa KT, Lander ES, Gifford DK, Fraenkel E, Young RA: Transcriptional regulatory code of a eukaryotic genome. Nature 2004, 431:99-104. 52. Stuart JM, Segal E, Koller D, Kim SK: A gene-coexpression
net-work for global discovery of conserved genetic modules. Sci-ence 2003, 302:249-255.
53. Harris MA, Clark J, Ireland A, Lomax J, Ashburner M, Foulger R, Eil-beck K, Lewis S, Marshall B, Mungall C, Richter J, Rubin GM, Blake JA, Bult C, Dolan M, Drabkin H, Eppig JT, Hill DP, Ni L, Ringwald M, Balakrishnan R, Cherry JM, Christie KR, Costanzo MC, Dwight SS, Engel S, Fisk DG, Hirschman JE, Hong EL, Nash RS, et al.: The Gene Ontology (GO) database and informatics resource. Nucleic Acids Res 2004, 32(Database issue):D258-D261.
54. Tong A, Lesage G, Bader G, Ding H, Xu H, Xin X, Young J, Berriz G, Brost R, Chang M, Chen Y, Cheng X, Chua G, Friesen H, Goldberg D, Haynes J, Humphries C, He G, Hussein S, Ke L, Krogan N, Li Z, Levinson J, Lu H, Minard P, Munyana C, Parsons A, Ryan O, Tonikian R, Roberts T, et al.: Global mapping of the yeast genetic inter-action network. Science 2004, 303:808-813.
55. Wong SL, Zhang LV, Tong AH, Li Z, Goldberg DS, King OD, Lesage G, Vidal M, Andrews B, Bussey H, Boone C, Roth FP: Combining biological networks to predict genetic interactions. Proc Natl Acad Sci USA 2004, 101:15682-15687.
56. von Mering C, Huynen M, Jaeggi D, Schmidt S, Bork P, Snel B: STRING: a database of predicted functional associations between proteins. Nucleic Acids Res 2003, 31:258-261.
57. Nabieva E, Jim K, Agarwal A, Chazelle B, Singh M: Whole-proteome prediction of protein function via graph-theoretic analysis of interaction maps. Bioinformatics 2005, 21(Suppl 1):i302-i310. 58. Biomart [http://www.ebi.ac.uk/biomart/martview/]
59. Clusters of Orthologous Groups [http://www.ncbi.nlm.nih.gov/ COG/new/]