A Framework for Implementation of IPD Principles in Oil & Gas Projects
Adel Al Subaih
Ph.D. Thesis 2016
P
h.D. The
s
is
A
d
e
l A
l
S
ubai
h
2
0
-
A Framework for Implementation of IPD Principles in Oil & Gas Projects
Adel Al Subaih
School of the Built Environment University of Salford, Salford, UK
i
Contents
Abstract xi
Chapter 1. INTRODUCTION ... 1
Introduction ... 1
Research Problem ... 4
Critical Poor Performance Factors ... 6
Research Questions ... 7
Aims and Objectives ... 8
Research Output ... 8
Scope and Limitations ... 9
Chapter 2. LITERATURE REVIEW ... 12
Introduction ... 12
Scale, Size & complexity of Oil & Gas Projects ... 12
Performance of Oil & Gas Projects ... 16
Summary of Critical Factors Affecting Project Performance ... 23
2.4.1. Introduction ... 23
2.4.2. Poor Project Management ... 23
2.4.3. Insufficient team building ... 26
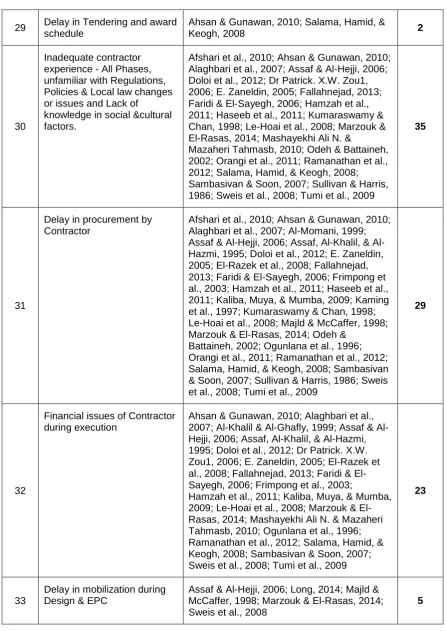
2.4.4. Conflicts / Disputes between stakeholders ... 29
2.4.5. Frequent Owner/client Interference ... 31
2.4.6. Slow Approvals and Slow Decision making by the Client ... 32
2.4.7. Inaccurate Cost Estimate ... 34
2.4.8. Poor Project Planning ... 35
2.4.9. Delay in Documents Approval ... 37
2.4.10. Poor Client Participation and Design Complexity ... 38
2.4.11. Design Changes and Variations ... 38
2.4.12. Poor Scope Definition ... 40
2.4.13. Poor Engineering Team ... 40
2.4.14. Insufficient Design Information from Owner ... 41
2.4.15. Poor Communication Between Stakeholders ... 42
2.4.16. Documents Inconsistency and Outdated Designs ... 44
2.4.17. Delay in Bidding and Poor Contractors Experiences ... 46
2.4.18. Delay in Procurement and Mobilization of Teams ... 48
Stage Gate Project Management Process ... 56
ii
2.5.3. Variants of Stage Gate ... 68
2.5.4. Advantages of Stage Gate ... 68
2.5.5. Limitations of Stage Gate ... 70
Introduction to Project Delivery Methods ... 71
Design – Build Delivery Method ... 75
2.7.1 Advantages of Design Build ... 78
2.7.2 Disadvantages of Design Build Project ... 79
Construction Manager at Risk Delivery Method ... 81
2.8.1 Advantages of Construction Manager at Risk ... 84
2.8.2 Disadvantages of Construction Manager at Risk ... 85
Design-Bid-Build Delivery Method ... 86
2.9.1 Advantages of Design-Bid-Build ... 89
2.9.2 Disadvantages of Design-Bid-Build ... 89
Collaborative Project Delivery Methods ... 90
2.10.1 Partnering Strategy ... 91
2.10.2 Alliancing Strategy ... 91
2.10.3 Difference between Alliancing and Partnering ... 92
Integrated Project Delivery (IPD) ... 93
2.11.1 Introduction ... 93
2.11.2 IPD Role in Addressing Current Problems ... 97
2.11.3 IPD Elements ... 98
2.11.4 IPD Implementation in Construction ... 99
2.11.5 Impact of Contracting Type on Project ... 100
2.11.6 Advantages of Integrated Project Delivery ... 103
2.11.7 Disadvantages of Integrated Project Delivery ... 106
2.11.8 Difference between Alliancing and Integrated Project Delivery (IPD) .... 107
Local Experience Literature ... 107
Literature Review Summery ... 110
Chapter 3. RESEARCH METHODOLOGY ... 112
Introduction ... 112
Research Structure ... 113
Purpose of Research ... 118
Research Design ... 119
Research Philosophy ... 120
3.5.1 Ontology ... 125
3.5.2 Epistemology ... 126
iii
Philosophical Perspectives ... 129
3.6.1 Research Approach ... 130
3.6.2 Mixed Method Approach ... 130
Research Strategy ... 135
3.7.1 Case Study ... 136
3.7.2 Research Methods ... 143
3.7.3 Methods of Data Collection ... 144
3.7.4 Questions ... 145
3.7.5 Questions Design ... 147
3.7.6 Questions Piloting ... 147
3.7.7 Interviews ... 148
3.7.8 Semi-structured Interview ... 148
Method of Data Analysis... 150
3.8.1 Qualitative Data Analysis ... 150
3.8.1.1. Stage one: Preparation ... 151
3.8.1.2. Stage Two: Organisation ... 151
3.8.1.3. Stage Three: Reporting ... 152
3.8.2 Quantitative Data Analysis ... 153
Interpretive Structural Modelling (ISM) approach ... 155
Chapter 4. CRITICAL PROJECT POOR PERFORMANCE FACTORS AND DEVELOPMENT OF INITIAL FRAMEWORK ... 157
Introduction ... 157
Critical project Poor Performance Factors ... 158
4.2.1 Critical Data Analysis Structure ... 158
4.2.2 Data Analysis ... 160
4.2.3 Discipline, Phase or Occurrence ... 162
4.2.4 Responsibility and Accountability ... 165
4.2.5 Occurrence Time ... 168
4.2.6 Factors Description ... 173
4.2.7 Data Analysis Summary ... 177
Initial Framework Development ... 180
4.3.1 Creating a framework based on IPD Principle ... 181
4.3.2 Factors related to communication Design, Project Management and Planning ... 184
4.3.3 Piloting the Questions ... 187
Chapter 5. CASE STUDIES ... 199
Introduction ... 199
iv
Case Study Execution Method ... 200
5.2.1. Case structure... 200
5.2.2. Case Study Selection Criteria (Project Name) ... 202
5.2.3. Case Studies Participants Selection Criteria (Interviewees) ... 204
5.2.4. Interview Process ... 207
5.2.5. Interviews Venue ... 210
Case Study 1 ... 211
5.3.1 Project Experience ... 211
5.3.2 Project Schedule ... 213
5.3.3 Cost ... 213
5.3.4 Key Project Problems (project poor performance factors) ... 214
5.3.5 Interviewees Status and Background/Involvement... 215
5.3.6 Interviewees Feedback and Analysis ... 218
5.3.7 First Case Study Results ... 220
5.3.7.1 Factor (Secondary Data) Validation by Individual Interviewee. ... 222
5.3.7.2 Factor (Secondary Data) Validation by Individual Factor ... 223
5.3.7.3 Design Phase Factors (occurrence & resolvable) by individual Interviewees ... 225
5.3.7.4 Design Phase Delay Factors (occurrence & Resolvable) by Individual Factor 226 5.3.7.5 Tendering Phase Factors (occurrence & resolvable) by individual Interviewees ... 228
5.3.7.6 Tendering Phase Delay Factors (occurrence & Resolvable) by Individual Factor 229 5.3.7.7 EPC Phase Factors (occurrence & resolvable) by individual Interviewees 231 5.3.7.8 EPC Phase Delay Factors (Occurrence & Resolvable Early) by Individual Factor: ... 232
5.3.7.9 Factors Resolvable by Early Stakeholder Engagement (by Individual Interviewees) ... 234
5.3.7.10 Factors Resolvable by Early Stakeholder Engagement (by Individual Factor): 236 5.3.7.11 Factors phase of Occurrence (by individual Interviewees): ... 238
5.3.7.12 Factors phase of Occurrence (by Individual Factor): ... 239
Case Study 2 ... 248
5.4.1 Project Experience ... 248
5.4.2 Project Schedule ... 250
5.4.3 Cost ... 251
5.4.4 Key Project Problems (Project Poor Performance Factors) ... 251
v
5.4.6 Interviewees Feedback and Analysis ... 255
5.4.7 Second Case Study Results ... 257
5.4.7.1 Factor (Secondary Data) Validation by Individual Interviewee ... 259
5.4.7.2 Factor (Secondary Data) Validation by Individual Factor ... 261
5.4.7.3 Design Phase Factors (Occurrence & Resolvable) by Individual Interviewees ... 262
5.4.7.4 Design Phase Delay Factors (occurrence & Resolvable) by Individual Delay factor ... 264
5.7.4.5 Tendering Phase Factors (Occurrence & Resolvable) by Individual Interviewees ... 265
5.4.7.6 Tendering Phase Delay Factors (occurrence & Resolvable) by Individual Delay factor ... 266
5.4.7.7 EPC Phase Factors (Occurrence & Resolvable) by Individual Interviewees ... 268
5.4.7.8 EPC Phase Delay Factors (Occurrence & Resolvable Early) by Individual Delay Factor: ... 269
5.4.7.9 Factors Resolvable by Early Stakeholder Engagement (by Individual Interviewees): ... 271
5.4.7.10 Factors Resolvable by Early Stakeholder Engagement (by Individual Delay factor): ... 272
5.4.7.11 Factors Phase of Occurrence (by Individual Interviewees): ... 274
5.4.7.12 Factors Phase of Occurrence (by Individual Delay Factor): ... 275
Case Study 3 ... 278
5.5.1 Project Experience ... 278
5.5.2 Project Schedule ... 281
5.5.3 Project Cost ... 281
5.5.4 Key Project Problems (Project Poor Performance Factors) ... 282
5.5.5 Key Achievements (Performance Improvement Factors) ... 284
5.5.6 Interviewees’ Status and Background/Involvement ... 284
5.5.7 Interviewee Feedback and Analysis ... 287
5.5.8 Third Case Study Results ... 290
5.5.8.1 Factor (Secondary Data) Validation by Individual Interviewee. ... 292
5.5.8.2 Factor (Secondary Data) Validation by Individual Factor ... 294
5.5.8.3 Design Phase Factors (Occurrence & Resolvable) by Individual Interviewees ... 296
5.5.8.4 Design Phase Delay Factors (Occurrence & Resolvable) by IndividualDelay factor ... 297
5.5.8.5 Tendering Phase Factors (Occurrence & Resolvable) by Individual Interviewees ... 299
vi
5.5.8.7 EPC Phase Factors (Occurrence & Resolvable) by Individual Interviewees
... 302
5.5.8.8 EPC Phase Delay Factors (occurrence & Resolvable Early) by Individual Delay factor: ... 303
5.5.8.9 Factors Resolvable by Early Stakeholder Engagement (by Individual Interviewees) ... 305
5.5.8.10 Factors Resolvable by Early Stakeholder Engagement (by Individual Delay Factor): ... 306
5.5.8.11 Factors phase of Occurrence (by individual Interviewees): ... 309
5.5.8.12 Factors Phase of Occurrence (by Individual Delay Factor): ... 310
Case Studies Discussions and Feedback ... 313
Chapter 6. INTERPRETIVE STRUCTURAL MODELLING (ISM) APPROACH ... 317
Step 1: Structural Self-Interaction Matrix (SSIM) ... 319
Step 2: Reachability Matrix ... 321
Step 3: Level Partitions ... 326
Step 4: Conical Matrix ... 347
Step 5: Diagraph ... 351
Advantages of ISM Approach ... 354
Limitations of ISM approach ... 354
Applications of ISM Approach ... 355
ISM Conclusion ... 355
Chapter 7. FINAL CONCEPTUAL FRAMEWORK ... 358
Chapter 8. CONCLUSION AND RECOMMENDATIONS ... 366
Introduction ... 366
Research Conclusions ... 366
Research Recommendation. ... 372
Research Questions ... 373
Contribution of this Research ... 375
Limitations of this Research ... 376
The Implementation Practicality of the new Framework ... 378
Future Areas of Research ... 382 Bibliography 384
vii
Table of Figures
FIGURE (2.1)WORLD OIL &GAS PRODUCTION ... 13
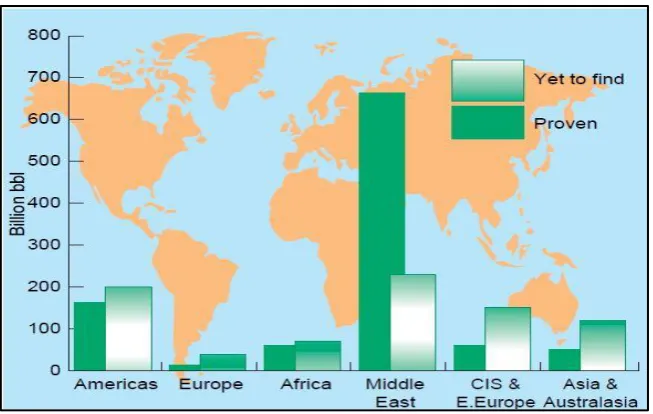
FIGURE (2.2)PROVEN OIL RESERVES WORLDWIDE ... 14
FIGURE (2.3)NUMBER OF GLOBAL OIL AND GAS COMPANIES WITH LARGE CAPITAL INVESTMENTS ... 15
FIGURE (2.4)DISTRIBUTION OF PROVED RESERVES IN 1993,2003&2013 ... 15
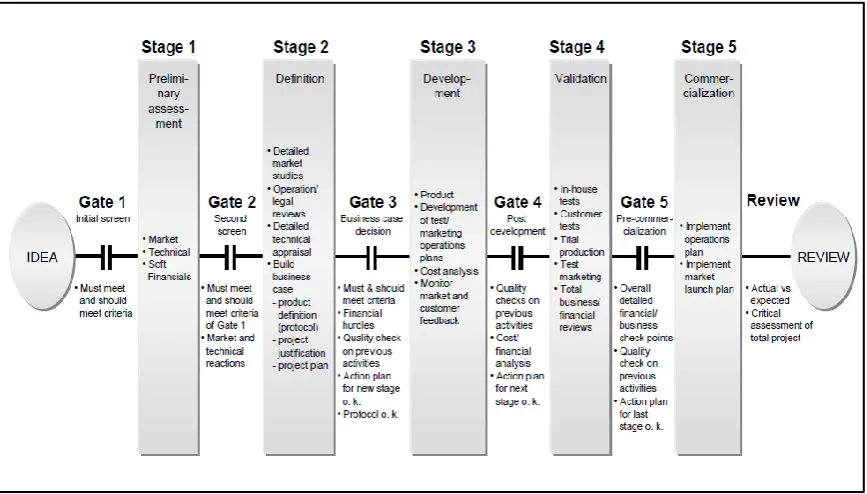
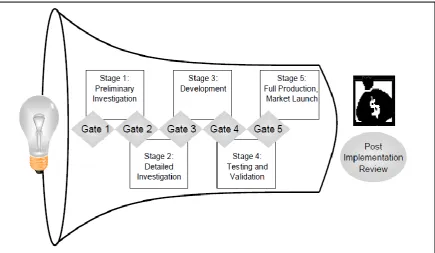
FIGURE (2.5)FIRST GENERATION PHASED REVIEW PROCESS ... 57
FIGURE (2.6)SECOND GENERATION STAGE GATE PROCESS ... 58
FIGURE (2.7)COOPER'S THIRD GENERATION STAGE GATE ... 60
FIGURE (2.8)CRAWFORD'S THIRD GENERATION STAGE GATE MODEL ... 61
FIGURE (2.9)TYPICAL STAGE GATE MODEL ... 63
FIGURE (2.10)DESIGN BUILD PHASES... 74
FIGURE (2.11)DESIGN BUILD PHASES... 75
FIGURE (2.12)DESIGN BUILD PHASES... 77
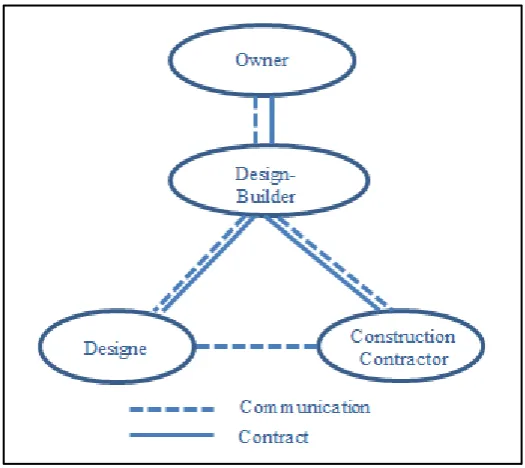
FIGURE (2.13)DESIGN BUILD COMMUNICATION &CONTRACT BETWEEN STAKEHOLDERS ... 78
FIGURE (2.14)CONSTRUCTION MANAGER AT RISK PHASES ... 83
FIGURE (2.15) CONSTRUCTION MANAGER AT RISK- COMMUNICATION AND CONTRACTS BETWEEN STAKEHOLDERS... 84
FIGURE (2.16)DESIGN BID BUILD PHASES... 87
FIGURE (2.17)DESIGN BID BUILD COMMUNICATION AND CONTRACTS BETWEEN STAKEHOLDERS ... 88
FIGURE (2.18) INTEGRATED PROJECT DELIVERY COMMUNICATION AND CONTRACTS BETWEEN STAKEHOLDERS... 97
FIGURE (2.19)INTEGRATED PROJECT DELIVERY VS TRADITIONAL DESIGN PROCESS ... 99
FIGURE (3.1)RESEARCH STRUCTURE (METHODOLOGICAL)MATRIX ... 115
FIGURE(3.2)RESEARCH STRUCTURE (METHODOLOGY)MILESTONES ... 116
FIGURE (3.3)RESEARCH ONION ... 122
FIGURE (3.4)RESEARCH NESTED MODEL ... 123
FIGURE (3.5)COMPARISON BETWEEN THE RESEARCH ONION AND NESTED MODEL ... 124
FIGURE (3.6)DIMENSIONS OF RESEARCH PHILOSOPHY ... 129
FIGURE (3.7)STRENGTHS OF DATA COLLECTION METHODS ... 132
FIGURE (3.8)WEAKNESSES OF DATA COLLECTION METHODS ... 133
FIGURE (3.9)SEQUENTIAL MIXED METHOD DESIGN ... 135
FIGURE (3.10)QUALITATIVE DATA ANALYSIS PROCEDURE ... 153
FIGURE (3.11)QUANTITATIVE DATA ANALYSIS PROCEDURE ... 155
FIGURE (4.1)LITERATURE FINDINGS:OIL &GAS,PIPELINE &POWER/UTILITY PROJECTS VS CONSTRUCTION PROJECTS ... 161
FIGURE (4.2)CATEGORY WISE DELAY FACTORS –ALL PROJECTS ... 162
FIGURE (4.3)CATEGORY WISE DELAY FACTORS –O&G,POWER,UTILITY &PIPELINE PROJECTS ... 164
FIGURE (4.4)CATEGORY WISE DELAY FACTORS –CONSTRUCTION PROJECTS ... 165
FIGURE (4.5)RESPONSIBILITY DISTRIBUTION FOR FINDINGS FROM LITERATURE ... 167
FIGURE (4.6)DELAY FACTORS BASED ON THE OCCURRENCE TIME –OIL &GAS PROJECTS ... 168
FIGURE (4.7)DELAY FACTORS BASED ON THE OCCURRENCE TIME –CONSTRUCTION PROJECTS ... 169
FIGURE (4.8)FACTORS BASED ON THE OCCURRENCE TIME –ALL PROJECTS... 170
FIGURE (4.9)DELAY FACTORS RESOLVABLE BASED ON THE OCCURRENCE PHASE –OIL &GAS ... 171
viii
FIGURE (4.11)DELAY FACTORS WHICH CAN BE RESOLVED DURING DESIGN PHASE –O&G,POWER PLANT,
UTILITY &PIPELINE PROJECTS ... 172
FIGURE (4.12) CATEGORY-WISE FACTORS WHICH CAN BE RESOLVED DURING DESIGN PHASE – CONSTRUCTION PROJECTS ... 173
FIGURE (4.13)INITIAL FRAMEWORK MATRIX FOR RESOLVABLE DELAY FACTORS ... 182
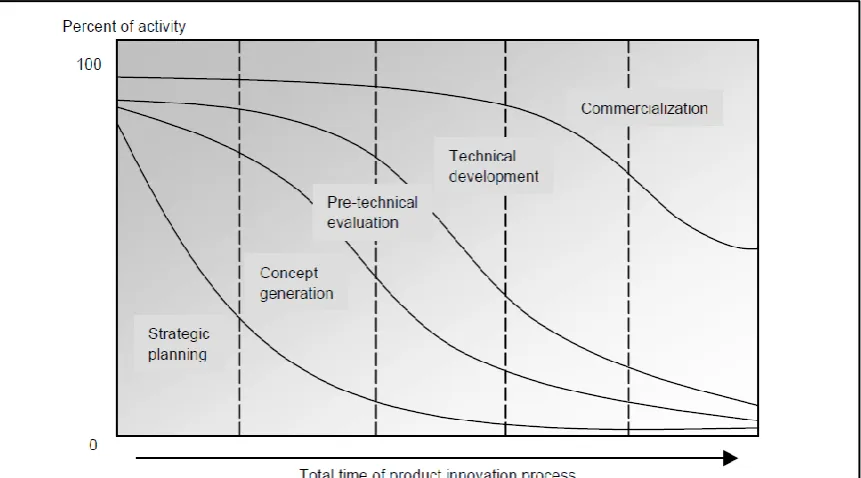
FIGURE (4.14)TYPICAL IPD PROJECT EXECUTION SCHEDULE INCLUDING ALL PHASES AND STAGES ... 186
FIGURE (5.1)CASE STUDY STRUCTURE ... 200
FIGURE (5.2)SELECTION OF CASE STUDIES ... 204
FIGURE (5.3)INTERVIEW PROCESS FOR PILOT THE QUESTIONS AND CASE STUDIES 1,2&3. ... 209
FIGURE (5.4)CASE STUDY INTERVIEW PROCESS MAP ... 210
FIGURE (5.5)CASE STUDY-1PROCESS SCHEMATIC ... 211
FIGURE (5.6)VALUE ASSURANCE PROCESS... 212
FIGURE (5.7)CASE STUDY-1PROJECT SCHEDULE TIMELINE ... 213
FIGURE (5.8)CASE STUDY-1PROJECT COST DISTRIBUTION ... 213
FIGURE (5.9)AVERAGE AGE &NATIONALITY DISTRIBUTION OF INTERVIEWEES ... 215
FIGURE (5.10)INTERVIEWEES EXPERIENCE IN DIFFERENT COUNTRIES AND INDUSTRIES OTHER THAN OIL & GAS ... 216
FIGURE (5.11)EXPERIENCE DISTRIBUTION OF INTERVIEWEES ... 217
FIGURE (5.12)FACTOR (SECONDARY DATA)VALIDATION BY INDIVIDUAL INTERVIEWEE ... 222
FIGURE (5.13)FACTOR (SECONDARY DATA)VALIDATION BY INDIVIDUAL FACTOR ... 224
FIGURE (5.14)DESIGN PHASE FACTORS (OCCURRENCE & RESOLVABLE) BY INDIVIDUAL INTERVIEWEES ... 225
FIGURE (5.15)DESIGN PHASE DELAY FACTORS (OCCURRENCE &RESOLVABLE) BY INDIVIDUAL FACTOR . 227 FIGURE (5.16)TENDERING PHASE FACTORS (OCCURRENCE & RESOLVABLE) BY INDIVIDUAL INTERVIEWEES ... 228
FIGURE (5.17)TENDERING PHASE DELAY FACTORS (OCCURRENCE &RESOLVABLE) BY INDIVIDUAL FACTOR ... 230
FIGURE (5.18)EPCPHASE FACTORS (OCCURRENCE & RESOLVABLE) BY INDIVIDUAL INTERVIEWEES ... 231
FIGURE (5.19)EPCPHASE DELAY FACTORS (OCCURRENCE &RESOLVABLE EARLY) BY INDIVIDUAL FACTOR ... 233
FIGURE (5.20) FACTORS RESOLVABLE BY EARLY STAKEHOLDER ENGAGEMENT (BY INDIVIDUAL INTERVIEWEES) ... 235
FIGURE (5.21)FACTORS RESOLVABLE BY EARLY STAKEHOLDER ENGAGEMENT (BY INDIVIDUAL FACTOR) 236 FIGURE (5.22)FACTORS PHASE OF OCCURRENCE (BY INDIVIDUAL INTERVIEWEES) ... 238
FIGURE (5.23)FACTORS PHASE OF OCCURRENCE (BY INDIVIDUAL FACTOR) ... 239
FIGURE (5.24)CASE STUDY-2PROCESS SCHEMATIC ... 248
FIGURE (5.25)CASE STUDY-2WATER CLUSTER STATION ... 249
FIGURE (5.26)VALUE ASSURANCE PROCESS ... 249
FIGURE (5.27)CASE STUDY-2PROJECT SCHEDULE TIMELINE ... 251
FIGURE (5.28)CASE STUDY-2PROJECT COST DISTRIBUTION ... 251
FIGURE (5.29)AVERAGE AGE &NATIONALITY DISTRIBUTION OF INTERVIEWEES ... 253
FIGURE (5.30)INTERVIEWEES EXPERIENCE IN DIFFERENT COUNTRIES AND INDUSTRIES OTHER THAN OIL & GAS ... 254
FIGURE (5.31)EXPERIENCE DISTRIBUTION OF INTERVIEWEES ... 255
FIGURE (5.32)FACTOR (SECONDARY DATA)VALIDATION BY INDIVIDUAL INTERVIEWEE ... 259
FIGURE (5.33)FACTOR (SECONDARY DATA)VALIDATION BY INDIVIDUAL FACTOR ... 262
FIGURE (5.34)DESIGN PHASE FACTORS (OCCURRENCE & RESOLVABLE) BY INDIVIDUAL INTERVIEWEES ... 263
ix
FIGURE (5.36)TENDERING PHASE FACTORS (OCCURRENCE & RESOLVABLE) BY INDIVIDUAL INTERVIEWEES
... 266
FIGURE (5.37)TENDERING PHASE DELAY FACTORS (OCCURRENCE &RESOLVABLE) BY INDIVIDUAL DELAY FACTOR ... 267
FIGURE (5.38)EPCPHASE FACTORS (OCCURRENCE & RESOLVABLE) BY INDIVIDUAL INTERVIEWEES ... 268
FIGURE (5.39)EPCPHASE DELAY FACTORS (OCCURRENCE &RESOLVABLE EARLY) BY INDIVIDUAL DELAY FACTOR ... 269
FIGURE (5.40) FACTORS RESOLVABLE BY EARLY STAKEHOLDER ENGAGEMENT (BY INDIVIDUAL INTERVIEWEES) ... 271
FIGURE (5.41) FACTORS RESOLVABLE BY EARLY STAKEHOLDER ENGAGEMENT (BY INDIVIDUAL DELAY FACTOR) ... 272
FIGURE (5.42)FACTORS PHASE OF OCCURRENCE (BY INDIVIDUAL INTERVIEWEES) ... 274
FIGURE (5.43)FACTORS PHASE OF OCCURRENCE (BY INDIVIDUAL DELAY FACTOR) ... 275
FIGURE (5.44)CASE STUDY-3PROCESS SCHEMATIC ... 278
FIGURE (5.45)VALUE ASSURANCE PROCESS ... 279
FIGURE (5.46)CASE STUDY-3PROJECT SCHEDULE TIMELINE ... 281
FIGURE (5.47)CASE STUDY-3PROJECT COST DISTRIBUTION ... 282
FIGURE (5.48)AVERAGE AGE &NATIONALITY DISTRIBUTION OF INTERVIEWEES ... 285
FIGURE (5.49)INTERVIEWEES EXPERIENCE IN DIFFERENT COUNTRIES AND INDUSTRIES OTHER THAN OIL & GAS ... 286
FIGURE (5.50)EXPERIENCE DISTRIBUTION OF INTERVIEWEES ... 287
FIGURE (5.51)FACTOR (SECONDARY DATA)VALIDATION BY INDIVIDUAL INTERVIEWEE ... 293
FIGURE (5.52)FACTOR (SECONDARY DATA)VALIDATION BY INDIVIDUAL FACTOR ... 294
FIGURE (5.53)DESIGN PHASE FACTORS (OCCURRENCE & RESOLVABLE) BY INDIVIDUAL INTERVIEWEES ... 296
FIGURE (5.54) DESIGN PHASE DELAY FACTORS (OCCURRENCE & RESOLVABLE) BY INDIVIDUAL DELAY FACTOR ... 297
FIGURE (5.55)TENDERING PHASE FACTORS (OCCURRENCE &RESOLVABLE) BY INDIVIDUAL INTERVIEWEES ... 299
FIGURE (5.56)TENDERING PHASE DELAY FACTORS (OCCURRENCE &RESOLVABLE) BY INDIVIDUAL DELAY FACTOR ... 300
FIGURE (5.57)EPCPHASE FACTORS (OCCURRENCE &RESOLVABLE) BY INDIVIDUAL INTERVIEWEES ... 302
FIGURE (5.58)EPCPHASE DELAY FACTORS (OCCURRENCE &RESOLVABLE EARLY) BY INDIVIDUAL DELAY FACTOR ... 303
FIGURE (5.59) FACTORS RESOLVABLE BY EARLY STAKEHOLDER ENGAGEMENT (BY INDIVIDUAL INTERVIEWEES) ... 305
FIGURE (5.60) FACTORS RESOLVABLE BY EARLY STAKEHOLDER ENGAGEMENT (BY INDIVIDUAL DELAY FACTOR) ... 306
FIGURE (5.61)FACTORS PHASE OF OCCURRENCE (BY INDIVIDUAL INTERVIEWEES) ... 309
FIGURE (5.62)FACTORS PHASE OF OCCURRENCE (BY INDIVIDUAL DELAY FACTOR) ... 310
FIGURE (6.1)FULL MATRIX ... 323
FIGURE (6.2)INITIAL REACHABILITY MATRIX ... 324
FIGURE (6.3)FINAL REACHABILITY MATRIX ... 325
FIGURE (6.4)CLUSTERSOFVARIABLES ... 348
FIGURE (6.5)CLUSTERSOFVARIABLESWITHARROW... 349
FIGURE (6.6)ISMBASED MODEL ... 353
FIGURE (7.1)FINAL FRAME CONCEPTUAL WORK ... 361
x
Table of Tables
TABLE (2.1) BELOW SHOWS THE GROUPED FACTORS REFERRED IN INDIVIDUAL LITERATURE AND HOW MANY
TIMES WERE REPEATED AND CONFIRMED BY INDIVIDUAL PAPERS. ... 50
TABLE (2.2)TRADITIONAL VS INTEGRATED PROJECT DELIVERY ... 101
TABLE (2.3) DELAY FACTORS WERE CAPTURED FROM LOCAL LESSONS LEARNED WORKSHOP ... 109
TABLE (3.1)RESEARCH TYPES ... 120
TABLE (3.2)-RESEARCH STRATEGIES ... 136
TABLE (3.3)QUALITATIVE METHOD OF ANALYSIS ... 150
TABLE (4.1)CATEGORIZED DELAY FACTORS WHICH ARE RESOLVABLE –O&G ... 174
TABLE (4.2)CATEGORIZED FACTORS WHICH ARE RESOLVABLE –CONSTRUCTION PROJECTS ... 176
TABLE (6.1)REACHABILITY SETS ... 327
TABLE (6.2)ANTECEND SET ... 328
TABLE (6.3)LEVEL OF VARIABLES ... 329
TABLE (6.4)VARIABLES NO OF TIMES ... 330
TABLE (6.5)LEVEL OF VARIABLES –LEVEL I... 331
TABLE (6.6)LEVEL OF VARIABLES –LEVEL II... 332
TABLE (6.7)LEVEL OF VARIABLES –LEVEL III ... 333
TABLE (6.8)LEVEL OF VARIABLES –LEVEL IV ... 334
TABLE (6.9)LEVEL OF VARIABLES –LEVEL V ... 335
TABLE (6.10)LEVEL OF VARIABLES –LEVEL VI ... 336
TABLE (6.11)LEVEL OF VARIABLES –LEVEL VII ... 337
TABLE (6.12)LEVEL OF VARIABLES –LEVEL VIII ... 338
TABLE (6.13)LEVEL OF VARIABLES –LEVEL IX ... 339
TABLE (6.14)LEVEL OF VARIABLES –LEVEL X ... 340
TABLE (6.15)LEVEL OF VARIABLES –LEVEL XI ... 341
TABLE (6.16)LEVEL OF VARIABLES –LEVEL XII ... 342
TABLE (6.17)LEVEL OF VARIABLES –LEVEL XIII ... 343
TABLE (6.18)LEVEL OF VARIABLES –LEVEL XIV ... 344
TABLE (6.19)LEVEL OF VARIABLES –LEVEL XV ... 345
TABLE (6.20)LEVEL OF VARIABLES –LEVEL XVI ... 345
TABLE (6.21)LEVEL OF VARIABLES –LEVEL XVII ... 346
xi
Abstract
Investment in the global Oil and Gas sector is huge. In 2014, the cumulative investment in between 2014 and 2035 was estimated to be US$22.4 trillion, equivalent to an average annual spend of more than US$1 trillion. A high percentage of Oil & Gas projects go over budget, however, because of poor performance and major schedule delays. Many of these can be traced to problems originating in the design phase. This phase is typically carried out by experienced design consultants, followed by tendering and then execution, involving large construction organisations.
Project delivery methods in the sector vary, with 57% using Design-Bid-Build, 38% Design-Build, and 5% Construction Manager at Risk. These methods provide no clear integration or collaborative approaches to ensure stakeholders involvement early during the design phase. This research examines the potential for using Integrated Project Delivery (IPD) as a new approach to improve collaboration by engaging full project teams from early in the design phase. It addresses the following questions: How do current practices in the Oil & Gas sector influence project performance? What are the factors behind poor project performance, and how can project performance be improved by the implementation of IPD?
The aim of this research is to create a conceptual framework to implement IPD principles in Oil & Gas projects as a way of improving their performance. This framework will help project stakeholders to be involved during the design phase, which in turn will help to deliver high quality projects, where schedule and costs are tightly controlled. An extensive literature review found 1,056 factors affecting performance, of which 85 could be resolved if addressed at the design phase. A total of 55 factors were related to communication, project management, planning and design problems. A conceptual framework was created to equip stakeholders with a tool to implement IPD effectively. This framework was validated using case studies of very large Oil & Gas projects. This confirmed the criticality of the factors identified, and that they occurred during particular project stages.
The framework was structured by plotting the major project stakeholders on one side and the project phases on the other (design phase, tendering, and construction), followed by the performance factors related to project management, planning, design and communication. For each factor, the stakeholders responsible were identified.
1
Chapter 1.
INTRODUCTION
Introduction
In the BP Statistical Review of World Energy, June 2014, it was stated that consumption and production had increased for oil & natural gas to record levels across the globe. It was also stated that world oil consumption had increased by 9.96% and production by 7.1% since 2004 (BP, 2014). Some investments in countries’ Oil & Gas industry are considerably higher than their GDP. For example, nearly $100 billion of investments in megaprojects are planned for Mozambique – more than four times its total GDP. Similarly, hydrocarbon companies have been ramping up spending to meet capital requirements. Developing economies are striving to dominate global energy supply, accounting for 80% of growth last year and nearly 100% of growth over the past decade (BP, 2014). The International Energy Agency (IEA) in its 2014 outlook estimates a cumulative investment of US$22.4 trillion in the global Oil & Gas sector between 2014 and 2035.
2
(Oil & Gas Magazine, 2000); this shows how important project schedules and timely delivery are.
In the construction related to Oil and GAS industry, the statistics indicate that productivity has decreased since 1964, while all other non-farm industries have increased by almost 200% (US Bureau of Labor Statistics, 2002). Construction’s lack of software interoperability costs the industry almost $16 billion annually (National Institute of Standards and Technology [NIST], 2004). Worldwide, it has been indicated that 40-50% of all construction projects are behind schedule (CMAA, 2005), and one of the biggest costs impacting such projects are inefficiencies built into project execution rather than the costs of raw materials like steel and concrete, or the cost of labour. Owners stated that they felt their project controls were unsatisfactory, quoting project management teams and cost controls as the most critical component requiring improvement (CMAA, 2005). Many factors are repeated and frequently cited by research which lead to project poor performance.
Several studies and research have been conducted within the construction to identify the factors of delays, which have been predicted as: time overrun, cost overrun, dispute, arbitration, total abandonment and litigation (Aibinu & Jagboro, 2002). Delivery delays and cost overruns cause loss of wealth, time and capacity, which translate into income losses and facilities being unavailable for owners. Money is lost through extra spending on equipment, materials and hiring labour as well as loss of time for the contractor (Haseeb, Xinhai-Lu, Bibi, Maloof-ud-Dyian, & Rabbani, 2011), these are some of the factors that impacted the project delivery resulted in poor performance.
3
the DBB method (Konchar, 1999). Project execution strategy and delivery systems have influence on project performance in the Oil & Gas Industry.
Poor project performance or delay can be associated with the typical characteristics of the project delivery methods involved (Gaba, 2013; Konchar, 1999), as well as design errors, improper communication, improper contracts, conflicts and disagreements, delays in decision making and approvals, etc. (Chanmeka, Thomas, Caldas, & Mulva, 2012; Company, 2012; Fallahnejad, 2013; Fayek, Revay, Doug Rowan, & Mousseau, 2006; Long, 2014; Mashayekhi Ali N. & Mazaheri Tahmasb, 2010; Mortaheb, Amini, Younesian, & Soltani, 2013; Orangi, Palaneeswaran, & Wilson, 2011; Salama, Hamid, & Keogh, 2008), poor communication and improper contract are factor behind poor performance of the Oil & Gas Industry.
These factors are identified not only in literature specific to the Oil & Gas industry but are also common in other construction projects (Afshari, Khosravi, Ghorbanali, Borzabadi, & Valipour, 2010; Ahsan & Gunawan, 2010; Al-Khalil & Al-Ghafly, 1999; Al-Momani, 1Rasas, 2014; Mashayekhi Ali N. & Mazaheri Tahmasb, 2010; Merrow, 2003; and others). With such consistent failures in adhering to a project performance, schedule and budget in the construction sector, and more specifically in the Oil & Gas sector, both sectors have realized the need to move beyond cutting inefficiencies within the engineering, procurement & construction activities of the project and redefine the basics, such as the use of innovative project delivery models.
4
an ultimate goal of creating a project environment that produces a positive outcome for all stakeholders.
The key challenge in the Oil & Gas industry is to control cost and project schedules. Establishing a collaborative approach from the project’s early design phase (also referred to as the concept/FEED design phase) is an essential step for Oil & Gas projects to improve schedule and cost impacts, which eventually improves project performance. Introducing the IPD approach can help to resolve and eliminate various poor performance factors; however, it is crucial to understand the principles of the IPD approach and how to introduce it into Oil & Gas projects from the early design stage.
Poor performance, primarily in the form of schedule delays, is widespread in Oil & Gas projects. Such delays lead to other factors, such as cost overruns and poor quality (Chanmeka et al., 2012; Company, 2012; Fallahnejad, 2013; Fayek et al., 2006; Long, 2014; Mashayekhi Ali N. & Mazaheri Tahmasb, 2010; Mortaheb et al., 2013; Orangi et al., 2011; Salama et al., 2008). Schedule delay and cost increase are important result of project poor performance in the Oil & Gas industry.
Research Problem
Number of studies have been conducted within the construction sector to identify factors behind poor performance. These include time overrun, cost overrun, dispute, arbitration, total abandonment and litigation (Aibinu & Jagboro, 2002). Schedule delays are a key factor behind poor performance and can lead to other factors such as cost overrun and low quality (Chanmeka et al., 2012; Company, 2012; Fallahnejad, 2013; Fayek et al., 2006; Long, 2014; Mashayekhi Ali N. & Mazaheri Tahmasb, 2010; Mortaheb et al., 2013; Orangi et al., 2011; Salama et al., 2008). Projects frequently impacted by time overrun, cost overrun which lead to poor performance.
5
strategy (design-bid-build); however, the common factors behind poor performance continue to occur.
Oil & Gas projects engage numerous stakeholders in different phases and stages of the project due to the sequential phases, i.e. the design phase is completed by the designing consultant with the client; bidding then starts for construction; the construction contractor commences; the manufacturers then become involved; and finally the end users (operation and maintenance) get involved. This shows the potential for gaps and disconnection between key stakeholders who do not come into contact during the project life cycle. There is no fixed integration method or collaboration approach to safeguard stakeholders’ involvement in the various project phases. Although construction contractor, manufacturers and end users may integrate at a very late stage (during the construction and commissioning phase), they miss out on the concept and detail design phases. This late integration and scattered collaboration can lead to various problems such as massive change orders; uncertainty/risk being unduly considered, which can inflate costs; severe delays to project delivery; technical/design deviations and changes; poor quality; commercial claims; and stakeholder dissatisfaction. All of these factors can lead to poor project performance, schedule delays and cost overruns (Chanmeka et al., 2012). All the factors influence the project performance and result in delays and cost overrun.
No definite framework has yet been introduced to integrate and identify the roles and responsibilities of each stakeholder at the beginning of the project life cycle (design). This would help to determine at which stage each party should get involved to eliminate various poor performance factors and reduce schedule delay and cost overrun and ultimately improve project quality and performance (Fayek et al., 2006; Long, 2014). Integrating all the stakeholder as early as possible is one of the key mitigations to be considered by the market.
6
facilitates integration and improves problems arising from late involvement or lack of integration between stakeholders through sequential phasing and stage gates. IPD can ultimately reduce production losses for clients.
Poor performance has motivated companies in the Oil & Gas industry to look for better practices, execution strategies and methods in order to minimize cost overrun, meet quality standards and adhere to production schedules. Understanding the current execution strategies and practices used in Oil & Gas projects, alongside identifying and quantifying the factors behind poor performance, could help to develop a framework to implement IPD principles.
Critical Poor Performance Factors
Earlier studies by various authors have detailed the poor performance factors of Oil & Gas projects. These include project delays such as design changes, design errors, poor communication and procurement delays as well as issues gaining approvals (Orangi et al., 2011). Factors contributing to poor performance are many, literatures have identify them in details.
Some authors have categorized poor performance factors into excusable and non-excusable factors. Not selecting a competent subcontractor, poor management of project changes, a lack of mechanisms for recording and transferring project lessons, delays in material procurement, delays in the awarding of subcontracts, a lack of proper management and controlling of subcontractors, delays in design, and a lack of communication and coordination are all considered non-excusable delay factors with the maximum impact based on the survey (Afshari et al., 2010). Factors related to design quality and management are repeated by literatures.
7
Edward Merrow (2003) concluded that of the fourteen megaprojects he studied, seven had failed to meet the project performance expectations by a considerable margin. He suggested that using value-improving practices and having a higher level of integration to support front-end loading is the most important factor for project success (Merrow, 2003). Integrating stakeholders early in the projects was addressed in the literatures.
A study of construction projects in the UAE also suggested preparation and approval of drawings, slowness of owners’ decision-making processes and inadequate early project planning as the major causes of delay (Faridi & El‐ Sayegh, 2006). In Libya, improper planning, a lack of effective communication, design errors, shortage of materials and slow decision making were identified to be the major causes of delays in construction projects (Tumi et al., 2009). The schedule of the Iranian gas pipeline project, which has been categorized as an Oil & Gas project as well as a linear project, has been affected by several of the above poor performance factors, including materials issues, unrealistic project duration, client-related materials, land expropriation, change orders and contractor selection methods (Fallahnejad, 2013). Literatures emphasis several factors are repeated y literatures and they can be addressed by the projects.
Research Questions
The focus of the research is to answer specific Oil & Gas-related questions:
What are the current practices and execution strategies used for project delivery and performance in the Oil & Gas industry?
What are the factors behind poor performance, to help focus the effort to improve the performance and work practices of Oil & Gas Industry?
How can IPD principles be implemented in the Oil & Gas industry?
8
Aims and Objectives
The aim of this study is to create a conceptual framework to implement IPD principles in Oil & Gas projects. This framework will help project stakeholders in the Oil & Gas industry to collaborate and integrate early in the design phase to deliver projects to a high standard, on time and within budget.
The objectives of this study can be summarised as follows:
Document Oil & Gas project execution strategies, practices, factors behind the poor performance of Oil & Gas projects and the IPD principles.
Analyse the critical factors behind the poor performance of Oil & Gas projects.
Compare existing Oil & Gas project practices and delivery (execution) strategies and identify their main challenges.
Create a conceptual framework to introduce an IPD approach into Oil & Gas projects.
Validate the proposed framework for IPD implementation.
Produce recommendations to implement IPD in Oil & Gas projects.
Research Output
This research will help to answer specific questions related to current practices in the Oil & Gas industry and to set out the factors behind poor performance and a conceptual framework to implement IPD principles in the Oil & Gas industry. The results and output of this research are expected to:
Confirm the current practices and strategies influencing project delivery and poor performance in the Oil & Gas industry.
Confirm that poor performance exists in Oil & Gas projects.
Identify the factors behind the poor performance of Oil & Gas projects. Encourage the adoption of IPD principles to address the identified factors
behind poor performance.
9
Implement IPD principles to improve Oil & Gas project performance.
Scope and Limitations
The scope of this research is limited to midstream and downstream projects in the Oil & Gas industry, i.e. projects related to constructing major pipeline networks, Oil & Gas production fields, gathering systems, power generation plants, midstream plants where sweetening and stabilization are required, gas refineries, petrochemical plants, and storage facilities. Projects related to Oil & Gas exploration and appraisal, such as seismic, drilling and piloting, are not considered in this research since the number of stakeholders is minimal and the value of investment is low compared to mid and downstream projects. Secondary and primary data, which comprise the literature survey and case studies, do not involve any subsurface or drilling projects. The case studies were selected from Oil & Gas downstream projects, which meet the requirements for this research in terms of participant roles during execution, scale, size and schedule.
This research does not cover low value projects, as these are presumed to have fewer stakeholders; the early design will be less complex, with minimal design duration; and the procurement and manufacturing will be small. Even adding to this the construction contractors and subcontractors, the size and number will be small compared to high value projects. Such low- to medium-scale projects are often awarded to construction contractors who have experience handling smaller designing procurement capabilities, which makes these projects more competitive. However, such contractors do not necessarily have experience handling large-scale projects.
sub-10
contractors, major manufactures, minor manufactures and third-party consultancies.
All of the factors behind poor performance and current practices have been covered in the literature survey, and have been referenced in appropriate sections of this report. However, this study focuses on those major factors which have a measurable impact on project performance, and which have been presented in many papers and are frequently referred to in the literature. Certain categories of factors were not covered, namely resources, procurement, quality, contracts and environment. These are specific to a region or to a specific project, and therefore not applicable to other projects. The focus was on key categories such as; planning, design, management, and communication.
The scope of the study is not limited to projects in the UAE or the Middle East since the factors studied were recorded in various projects and locations, therefore the research serves all Oil & Gas projects worldwide. This is due to the fact that Oil & Gas projects around the globe are similar in design, execution and financing methods. Although environmental conditions can vary with location, this is dealt with during the design phase and execution. Projects worldwide are designed using international standards and well-known designing consultants, such as Flour (USA), Bechtel (UK) and Technip (France), and are executed by known companies. The same is true in terms of the financing, with well-known Oil International Companies supporting Oil & Gas projects around the globe, such as Shell, BP, ExxonMobil and Total. Factors related to environments or government categories were excluded. The scope of the research was also limited to creating a conceptual framework to implement IPD principles. Framework implementation was not considered in this study, and will require further research.
11
12
Chapter 2.
LITERATURE REVIEW
Introduction
Data can be sourced from both primary and secondary sources. Secondary data are those data collected from literature audio or video documents such as textbooks, journals, archives, annual reports, government published data and films (Saunders et al., 2009; Collis and Hussey 2003). In this section the researcher has collected the data from various sources but mainly University literature, journals, internet and local experiences.
The researcher will focus in this chapter to review the available literature, understand the O&G projects’ size, scale and execution strategies, performance of O&G projects, IPD principles, factors behind the poor performance and how these factors affecting the performance.
Scale, Size & complexity of Oil & Gas Projects
More than $1 600 billion was invested in 2013 to provide the world’s consumers with energy; a figure that has more than doubled in real terms since 2000 and a further $130 billion to improve energy efficiency as per IEA. These projects ranged from the extraction of Fossil Fuels to the Construction of Power stations, Wind farms, Solar Installations, Oil refineries, Storage and handling facilities, Pipelines, Tankers and other transportation facilities (IEA, 2014). In its World Energy Investment Outlook 2014, the International Energy Agency (IEA) estimates a cumulative investment of US$22.4t in the global Oil & Gas sector between 2014 and 2035. The IEA expects Oil & Gas spending to increase sharply, increasing by almost 50% from its average of US$678b per year over the 2000–2013 period (IEA, 2014). The scale of investment indicate the advantages of improving the performance of this industry.
13
shows how the gas production increased during nine years from 259 Billion Cubic Feet per Day to 353 Billion Cubic Feet per day, this reflect the increase on the industry and shows how this demand will add more projects to the Oil 7 gas market to compensate the shortage and keep the supply to the market.
Figure (2.1) World Oil & Gas Production
Source: BP Statistical Review of World Energy
14
UAE (SBC, 1997). The figure below shows the proven oil reservoir capacities in different regions of the world.
Figure (2.2) Proven Oil Reserves Worldwide
Source: Middle East well evaluation report, SBC, 1997
In an alternate perspective, in its World Energy Investment Outlook 2014, the International Energy Agency (IEA) estimates a cumulative investment of US$22.4t in the global Oil & Gas sector between 2014 and 2035. The IEA expects Oil & Gas spending to increase sharply, increasing by almost 50% from its average of US$678b per year over the 2000–2013 period (IEA, 2014). The number of global oil and gas companies with capital budgets exceeding $1 billion more than tripled to 132 in 2012 from just 40 in 2000, while those with capital expenditures exceeding $5 billion increased fivefold from seven in 2000 to 35 in 2012 (Deloitte, 2013). Various literatures confirm the size of this sector could be the biggest in the market and one of key development sector for some countries.
[image:27.595.87.414.109.316.2]15
Figure (2.3) Number of global oil and gas companies with large capital investments
Source : (Deloitte, 2013)
As per the research by Schlumberger Business Consulting, the Number of mega Projects (Value above $1 Billion) in Oil & Gas has almost quadrupled in the past 10 years to reach USD 550 Billion (SBC, 2012).
Falling price of Oil and Gas products has been attributed to surprises in production of unconventional Oil, the financial crisis and resulting weakening global demand, appreciation of US Dollar, growing trends of moving towards renewable energy sources lately and international Policies (World Bank, 2015). Relative lower prices of Oil per barrel due to surplus production and lower demand has encouraged in developing more cost efficient methods for developing and sustain the production from fields developed. Figure (2.4) below shows the distribution of proved reserves in 1993, 2003 & 2013.
Figure (2.4) Distribution of Proved reserves in 1993, 2003 & 2013
16
The number of global oil and gas companies with capital budgets exceeding $1 billion more than tripled to 132 in 2012 from just 40 in 2000, while those with capital expenditures exceeding $5 billion increased fivefold from seven in 2000 to 35 in 2012 (Deloitte, 2013). The Number of mega Projects (Value above $1 Billion) in Oil & Gas has almost quadrupled in the past 10 years to reach USD 550 Billion (SBC, 2012). Size of this sector is increasing and any improvement could contribute to the investment values.
Performance of Oil & Gas Projects
Based on the conclusions drawn from the earlier studies by various authors on the delay factors for projects, the factors were mentioned in this section. Linear projects with repetitive works have been executed with poor performance factors which are commonly noticed in delayed projects such as design changes, design errors, poor communication and procurement delays, issues in approvals, etc. (Orangi et al., 2011). The Iranian gas pipeline project, which has been categorized as an Oil & Gas project as well as a linear project, has several of the above poor performance factors impacting the schedule, including materials issues, unrealistic project duration, client-related materials, land expropriation, change orders & contractor selection methods (Fallahnejad, 2013). Below are some of the projects’ factors behind poor performance highlighted by the literatures which were executed in USA, CANADA, IRAN, Australia, Ghana, Malaysia, Korea, Saudi, etc. it is observed that all are typical in their nature, design and execution, and the factors were dominate and behind other factors such as cost overrun and poor quality which all lead to poor performance, since the factors were presence in various regions, therefore they are considered as a global and common Oil & Gas factors, Even though this is not an exhaustive list, the most frequent, high priority and repeated factors highlighted by the authors are mentioned.
17
impact on the schedule (Mortaheb et al., 2013). Design issues and project management are major poor performance contributors by the literatures.
Some authors categorized the poor performance factors as excusable and non-excusable factors. For instance, not selecting a competent subcontractor, poor management of project changes, a lack of mechanism for recording and transferring project lessons, delays in material procurement, delays in the award of subcontracts, a lack of proper management and controlling of subcontractors, delays in design, lack of communication and coordination are all considered non-excusable delay factors with the maximum impact based on the survey (Afshari et al., 2010). In another study, common factors were identified from earlier studies and have been ranked (Majld & McCaffer, 1998). Based on the above, it was concluded that the highest ranked delay factors were; delay in design, lack of communication and coordination between owners & contractors, late delivery of materials & slow mobilization, damaged materials, poor planning, equipment breakdown, unreliable subcontractors, poor quality and inadequate fund allocation.
Research carried out by Mashayekhi presented a dynamic model developed using the concept of system dynamics. Mashayekhi concluded that field studies can identify the causes of delay at project level but a system dynamic approach finds the source causes which are most responsible for delays by taking a global view. It was concluded that the results of the system dynamics approach based on interviews and document reviews is similar to the field study outcomes (Mashayekhi Ali N. & Mazaheri Tahmasb, 2010). Literatures have identified factors behind the performance.
18
Arpamart Chanmeka (2012) presented results from his study on 37 Oil & Gas projects in Alberta. These are considered to be unique Oil & Gas projects in the U.S with respect to the mega size budgets, high overlap of engineering & construction, harsh weather conditions, remote site & labour shortages. The study results showed that projects which could complete a considerable amount of engineering prior to the start of construction could deliver a much better project performance. As per the author, implementation of best project management practices and proper estimation of labour productivity along with considerable engineering completion prior to the start of construction can improve the project outcome (Chanmeka et al., 2012). Literatures address the advantage of complete designs and the completed design value in the project performance.
Mohamed Salama, Moustafa Abd El Hamid and Bill Keogh, in their paper, stated that the factors identified for delay in construction projects may not be applicable for Oil & Gas projects due to the difference in the industries. Their paper studied the Oil & Gas projects specifically in the UAE. The authors related the delays in the construction stage (also referred to as the EPC phase) of a project to the early delays in Front End Engineering Design (FEED). In addition, delays in procurement, material delivery and poor selection of contractors in FEED and EPC Phases have been identified as the major reasons for delay in Oil & Gas projects (Salama et al., 2008). The construction industry data collected from various civil projects in Dubai & Abu Dhabi showed that the major reason for claims arise from changes or variation orders, delay from owners, oral changes from owners and delay in payments by owners (E. K. Zaneldin, 2006). The observation from Oil & Gas projects in the UAE suggests that poor FEED is a cause for major delays. The civil projects in the same region stated that the changes in design and delays from owners was the main cause for claims. It is evident that eliminating the common cause of improper early design can reduce both construction delays and claims.
19
delay in UAE construction projects (Faridi & El‐Sayegh, 2006). Project management and client involvement have been addressed in several literature and identified them as factors behind project performance.
In a study of Oil & Gas projects in Alberta (Fayek et al., 2006), the authors suggested the following changes to improve project performance; selection of the right scale of project ($200 to $300 million), providing selective overtime to boost labour productivity, skilled & experienced workers and supervision, substantial completion of engineering prior to the start of construction, team integration and communication, setting realistic targets, proven vendors and proper planning. In a study of process plants and offshore Oil & Gas projects, the major reasons for delay were stated as: insufficiently defined design (FEED), inadequate design basis for production rates, improper contractor cost estimates, ambiguity of contract documents, inadequate documentation, multiple change orders, insufficient management of contractor design and construction interfaces, insufficient and inexperienced owner technical personnel, inadequate baseline schedule, insufficient camp facilities, and inexperienced management team from owners (Long, 2014). Along with incomplete designs factor there are many factors impacted the project performance.
20
In Vietnam, poor site management and supervision, poor project management assistance, financial difficulties of the owner, financial difficulties of the contractor and design changes are the five most frequent, severe and important causes for project delays (Le-Hoai et al., 2008). In the United Kingdom the lack of information, variation orders, ground problems and bad weather were more frequent reasons for project delays whereas overseas it was variation orders, material delays, waiting for information & M&E procurement - in order of importance (Sullivan & Harris, 1986). High rise projects in Indonesia were delayed because of design changes, poor labour productivity, inadequate planning and resource shortages (Kaming et al., 1997). There are factors not related to the design phase however they could be address early in the design to overcome their problems during construction.
A survey of 130 construction projects in Jordan indicated that poor design and owner negligence, change orders, weather conditions, site conditions, late delivery, economic conditions, and increased quantities are the main causes of delay (Al-Momani, 1999). In another study in Jordan the authors considered the contractor’s perspective; financial difficulties faced by contractors was the most frequent cause of delays and increased change orders were the second most important factor. Poor planning by contractors was identified as the most important delay cause from the owner’s perspective (Sweis et al., 2008). Results from projects in Jordan concluded that owner interference, inadequate contractor experience, financing and payment, labour productivity, slow decision making, improper planning and subcontractors were the main causes of delay (Odeh & Battaineh, 2002). Incomplete designs and poor project management are repeated in several literature and require more focus by the sector to improve.
21
When 100 Asian projects sponsored by the Asian Development Bank were studied, the length of contract, procurement, civil works, land acquisition, and consultant recruitment were found to be the main governing delay factors (viz. India, Bangladesh, China & Thailand). Further critical causes of project delays were attributed to natural catastrophes and host country bureaucracy (Ahsan & Gunawan, 2010). Studies from Hong Kong projects suggested that the study on causes of delay is always subject to bias. The root cause analysis may provide more insight to the root problem as compared to the surveys (Kumaraswamy & Chan, 1998). The literature has identified factors related to the client rather than to the design side and they can be addressed early in the project phase.
In the Indian project environment, a lack of commitment, inefficient site management, poor site coordination, improper planning, lack of clarity in project scope, lack of communication and substandard contracts were more predominant reasons for schedule delays (Doloi et al., 2012). It was noticed from the literature factors related to poor project management are repeated in difference locations and countries.
The most common reason for delays in Pakistan are natural disasters like floods and earthquakes, financial and payment problems, improper planning, poor site management and insufficient experience. A shortage of materials and equipment are also cited as common reasons for delay (Haseeb et al., 2011).
22
2011). A similar study by Sambasivan, has identified improper planning by contractors, poor site management, inadequate contractor experience, inadequate payments from client, problems with subcontractors, shortage of materials and similar contractor related delay causes (Sambasivan & Soon, 2007). In a similar study in the Malaysian construction projects context, it was concluded that financial problems of the contractor are the major cause of delay followed by poor site management, delays in receiving materials and coordination problems (Alaghbari et al., 2007). The delays in the Malaysian construction industry were also compiled in a technical paper (Chidambaram Ramanathan, 2012). Poor project financing factor was identified by the literature in several projects.
A study of the Korean train express project showed the causes of delay in a phased manner. During project initiation, a lack of technological knowledge and improper geological surveys were major delay reasons. Acquisition of the work site, frequent changes and lack of owners’ management skills were also graded as important delay causes (Han et al., 2009). lack of experience of engineers is related to poor project management.
23
Summary of Critical Factors Affecting Project Performance
2.4.1. Introduction
The critical factors behind poor performance of projects were expressed in various literature papers and all have emphasized on the commonality of the factors that were faced by all the projects regardless of the geographical locations and nature of the contractors. However, the factors criticality and its magnitude of impact on the poor performances varies from project to project. In all thirty-three (33) critical factors referred and confirmed in various individual literature papers (38 papers referred herein) have been grouped, summarized, tabulated in Table (2.1) and reproduced hereunder.
2.4.2. Poor Project Management
24
25
Kaliba, Muya, & Mumba, 2009, 2009). Poor project management from the design consultant, client side and contractor all contribute to poor performance outcome. Kumaraswamy & Chan mentioned the effective project management to address the construction contractor, where key decisions are required at certain times to compensate progress delays , this means strong project management can take fast and appropriate decisions to reinforce resources and compensate the shortage of resources as quick as required to improve the quality of work, this can be achieved if the construction contractor is equipped with strong decision making managers, otherwise the delays and poor quality will be extended to cover other areas and worsen the problem (Kumaraswamy & Chan, 1998). Le-Hoai also has addressed that the project leadership empower the project and make difference in the execution and decision making, (Le-Hoai et al., 2008); Long in his paper also talked about project management efficiency and client project management team could play major role towards project performance when project management team were involved early in the project, (2014 Long). The same was addressed and mentioned by various literatures; Majld & McCaffer, Marzouk & El-Rasas, but extended to cover inexperienced project team (Majld & McCaffer, 1998; Marzouk & El-Rasas, 2014).
26
progress as resources will be utilized optimally and increase the efficiency of the labors (Odeh & Battaineh, 2002; Ogunlana et al., 1996; Orangi et al., 2011). Ramanathan has mentioned that a high quality of project team should add value to the entire progress and improve the productivity of other weak resources (Ramanathan et al., 2012). Salama, Hamid, & Keogh have also mentioned in their papers that they have found the decision making of key project management members affect the progress and avoid recycling of the work (Salama, Hamid, & Keogh, 2008). Others like Sambasivan & Soon, Sullivan & Harris, Sweis and Tumi in their papers have mentioned clearly the importance to have strong and effective project management team; not limited to the client organization but extended to cover the designer team, subcontractor along the main contractor, project management consultant and the manufactures (Sambasivan & Soon, 2007; Sullivan & Harris, 1986; Sweis et al., 2008; Tumi et al., 2009). The role and value of effective management team was recorded in various literatures and majority of the presented papers emphasised this as a key factor behind project success if it is implemented from the beginning of the design phase.
Table (2.1) has summarized the literatures which have covered the lack of effective management factors and inexperienced project teams.
2.4.3. Insufficient team building
27
building as one of the critical factor behind poor performance since the client and construction teams always in conflict and fight in the meetings, however once they started having regular team buildings, then the communication among the peers increased and started to understand each other and finding solution to each problem (Merrow, 2012). Ramanathan also presented the team building as important factor to the project team to relieve the tension between the project management team and the same is extended to cover the stakeholders (Ramanathan et al., 2012). Sullivan & Harris have presented the advantages of team building between the project team in the same organization, i.e. between the client project team themselves and between the designer team members and the same between the construction team members, then the same should be stretched to cover the entire project stakeholders (1986Sullivan & Harris, 1986). Table (1) list down the literatures which addressed the factor of insufficient team buildings for poor project performance.
28
29
the designing phase by the end users, also this applicable to have strong and appropriate structure by the designing consultant, providing high quality resources will improve the quality of the engineering deliverables and minimize the document rejection by the client. Table (1) lists out all the papers which have highlighted this factor.
2.4.4. Conflicts / Disputes between stakeholders
30
2013). Hamzah has highlighted how important to involve the end user as early as possible in the early design phase and consider their experience in operating similar systems (Hamzah et al., 2011). Han and Haseeb also recorded that disagreement between client project team and end user cause major approval delay and change orders at very late stage of the projects (Han et al., 2009; Haseeb et al., 2011). Kumaraswamy & Chan have addressed to involve client end user during the design phase to approve the design and reduce change orders at later stage (Kumaraswamy & Chan, 1998). Marzouk & El-Rasas have suggested to have written design basis between the client internal stakeholders to minimize the conflict and record somehow the requirement of the end users (Marzouk & El-Rasas, 2014). Mortaheb in his paper mentioned that having the operation and maintenance team participated during the design phase will improve the design quality and reduce the late dispute between client project team and end users (Mortaheb et al., 2013). Odeh & Battaineh, and Ogunlana have emphasized on the value of having client operation very early in the design (Odeh & Battaineh, 2002; Ogunlana et al., 1996). Ramanathan also suggested to include client operation in the review engineering document list to ensure all their concerns are captured very early and to avoid future change orders and variations (Ramanathan et al., 2012).; Salama, Hamid, & Keogh, 2008 and Sambasivan & Soon in their papers highlighted that involving all the client stakeholder at the right time of the project reduce the internal client conflicts (Salama, Hamid, & Keogh, 2008; Sambasivan & Soon, 2007). Table (1) list the record of all the literatures which addressed the client internal conflict factor.
31
Long has mentioned that client insufficient & inexperienced management personnel were major factors in one of the executed projects, where owner inexperience manager made wrong and late decisions most of the times (Long, 2014). Table (2.1) list out the literature on inexperience management personnel from owner.
2.4.5. Frequent Owner/client Interference
Frequent Owner/client Interference during the design phase was one of the factors of late approvals and redesigning the activities. Zaneldin has addressed that in several projects, the client frequent interference in the designing phase cause re-do of the work and consume big effort by the designing consultant (E. Zaneldin, 2005). Marzouk & El-Rasas also highlighted the same factor and stated client less interference will help the other stakeholders such as designing consultant and project management team to focus and complete activities in a timely manner (Marzouk & El-Rasas, 2014). Mortaheb also addressed the same but he added client interference could be valued if it was made at the right time but frequent interference causes the project team to lose focus (Mortaheb et al., 2013). Odeh & Battaineh, Ramanathan, Sambasivan & Soon and Sweis have mentioned how bad client frequent interference delays the project schedule (Odeh & Battaineh, 2002; Ramanathan et al., 2012; Sambasivan & Soon, 2007; Sweis et al., 2008). Table (2.1) is listing all the literature which addresses client frequent interference as a major poor performance and delay factors in the projects.
32
literatures which highlight the client bureaucracy as a delay or poor performance factor in the industry.
2.4.6. Slow Approvals and Slow Decision making by the Client
Issues regarding permissions / approvals from other stakeholders were recorded in several papers as a factor caused poor performance in the project. Alaghbari and Al-Momani both have mentioned the same in their papers, getting approvals from the client organization takes a very long time and causes standby by many stakeholders (Alaghbari et al., 2007; Al-Momani, 1999). Assaf & Al-Hejji, Assaf, Al-Khalil, & Al-Hazmi have mentioned getting permission from the government body for lands clearance and no objection certificates causes major delay in some of the projects (Assaf & Al-Hejji, 2006; Assaf, Al-Khalil, & Al-Hazmi, 1995). Doloi, Dr Patrick. X.W. Zou1, Zaneldin and others listed in the below table have highlighted that land permissions and other governmental approval take times and require massive coordination and their late involvement cause the project standby awaiting for approvals and permissions (Doloi et al., 2012; Dr Patrick. X.W. Zou1, 2006; E. Zaneldin, 2005). Table (1) list down the literatures which addressed the factor of issues regarding permissions / approvals from other stakeholders for poor project performance.