International Journal of Emerging Technology and Advanced Engineering
Website: www.ijetae.com (ISSN 2250-2459, ISO 9001:2008 Certified Journal, Volume 9, Issue 1, January 2019)
80
Comparative Study the Effect of Tool Material on MRR and
TWR During Die Sinking Electric Discharge Machining of EN9
Khushbir Kumar
1, Ashwani Mor
2, Balinder Singh
31Post Graduate Student, 2,3Assistant Professor, Department of Mechanical Engineering, Bahra Institute of Management and
Technology, Affiliated to DCRUST, Sonepat, Haryana, India
Abstract-- The present study discusses the influence of tool material on output characteristics like material removal rate and tool wear rate. The effects of various input parameters like discharge current, pulse on time, voltage and pulse off time are also discussed. The other input parameters like duty cycle, spark gap and work piece polarity are kept constant. The experiments have been conducted on EN9 work piece material using cylindrical shaped copper and brass electrode having 10 mm in diameters. EDM oil is used as a dielectric fluid with external pressure flushing. The layout of design of experiment is based on Taguchi L9 orthogonal array. From
the results, it is concluded that the copper electrode provides more material removal rate and less tool wear rate than brass electrode. This is because that, the thermal conductivity, melting point and density of copper is higher than that of brass. So it is good to use copper as an electrode for machining purpose to achieve better results. Further, it is also observed that, the discharge current and pulse on time has the highest effect on material removal rate and tool wear rate whereas voltage and pulse off time has not much affects the response. As the discharge current and pulse on time increases, the material removal rate and tool wear rate also increases.
Keywords: Taguchi L9 orthogonal array, Minitab.
I. INTRODUCTION
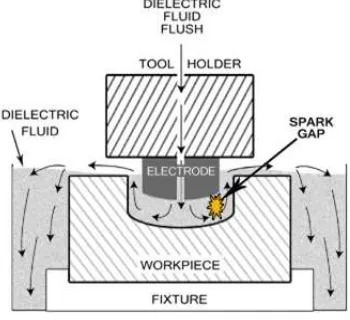
Electrical Discharge Machining, EDM is a nonconventional machining process, in which the material erodes from the work piece by a series of discrete sparks between a work piece and the tool immersed in a liquid dielectric medium [12]. The EDM system consists of a shaped tool or wire electrode, and the part. The electrical discharges melt and vaporize the minute amounts of the work piece material, which are then ejected and flushed away from the machining area by the dielectric fluid. The sparks occurring at high frequency continuously & effectively remove the material from the work piece by melting & evaporation [5]. The dielectric fluid acts as a de-ionizing medium between the electrode and work piece. It is one of the most accurate manufacturing processes available for creating complex or simple shapes and geometries within parts and assemblies.
Types of EDM
1.Die Sinker (Probe) EDM:
EDM comes in two basic types: Sinker (die sinking) EDMs are generally used for complex geometries where the EDM machine uses a machined graphite or copper electrode to erode the desired shape into the part or assembly. Sinker EDM can cut a hole into the part without having a hole pre-drilled for the electrode.
In the traditional die-sinking EDM process, the tool is fabricated into a required shape and mounted on a ram that moves vertically. The spark discharges can only occur under a particular gap size that determines the strength of electric field to break down the dielectric. A servo control mechanism is equipped to monitor the gap voltage and to drive the machine ram moving up or down to obtain a dischargeable gap size and maintain continuous sparking.
[image:1.612.358.533.493.653.2]Because the average gap voltage is approximately proportional to the gap size, the servo system controls the ram position to keep the average gap voltage as close as possible to a preset voltage, known as the servo reference voltage
.
Figure 1 Die Sinker EDM (www.mechscience.com)
International Journal of Emerging Technology and Advanced Engineering
Website: www.ijetae.com (ISSN 2250-2459, ISO 9001:2008 Certified Journal, Volume 9, Issue 1, January 2019)
81
Copper and graphite are commonly used as die-sinking EDM tool materials because of the high electrical conductivity and high melting temperature and the ease of being fabricated into complicated shapes [13].2. Wire EDM:
II. LITERATURE REVIEW
Detailed review of the selected research papers has been studied for knowing the effect of various design parameters on the performance parameters of EDM. These papers were also studied for finding information about the effect of tool material on performance parameters. The work was started on the basis of these papers. Various papers were studied for finding the effect of these input parameters on the machining parameters as different parameters had different effect on the machining parameters. The brief summary of some research papers are sited here. [1] Kakkar K et. al. (2018), optimized the material removal rate, tool wear rate and surface roughness in Electric Discharge Machining process using Taguchi’s design. Discharge current, voltage and pulse on time were used as process parameters. The experiments were done on Al-SiC work piece material using copper electrodes having 2.5 mm in diameter. The
design of experiment was based on Taguchi’s L9
orthogonal array. It was concluded that, material removal rate was increased with increase in discharge current, pulse on time and voltage and the tool wear rate was found lowest at lower value of discharge current, pulse on time and voltage. Further it was also observed that, as the discharge current and pulse on time increased the surface roughness was also increased.
Raghuraman S. et. al. (2013), optimized the EDM machining parameters using Taguchi design approach and grey relational analysis. Mild steel was used as a work piece material for this experiment even as copper was selected as a tool material. The experimental design procedure was based on Taguchi L9 orthogonal array and
analysis has been carried out by using grey relational analysis. Pulse on time, pulse off time and current were elected as a machining parameters for this experiment. MRR, TWR and surface roughness were the performance parameters. The experiments were performed on EDM machine of ELECTRONICA. Commercial grade EDM oil was used as dielectric fluid. The authors observed that, as the current and pulse on time increases, both the MRR and TWR also increases. The authors also concluded that, current was the most effectual parameter for MRR and TWR while pulse off time was the most significant parameter for SR. As the pulse off time increase, the SR decrease.
Roy T et. al. (2014), optimized that the effect of machining parameter on the EDM, Pulse on Time, Pulse off Time and Voltage were calculated on the base of tool Overcut. L9 orthogonal array method was used for the
experiment design. He was use the signal-to-noise (SN) ratio for the optimization and the effect plots are also basses on the signal to noise ratio. After experiment he found that duty cycle has a significant effect on tool overcut (TOC) followed by discharge current (DC) and pulse on time and gap voltage has less effect on tool overcut.
III. OBJECTIVE
Here, the objective of the work is as follows:
1. To experimentally investigating the effect of tool material on MRR and TWR.
2. To experimentally find the influence of process parameters like current (I), pulse on time (Ton), voltage (V) and pulse off time (Toff) on MRR. 3. To experimentally find the influence of process
parameters like current (I), pulse on time (Ton), voltage (V) and pulse off time (Toff) on TWR.
IV. METHODOLOGY
Taguchi Design experiments in MINITAB: The Taguchi method involves reducing the variation in a process through robust design of experiments. The overall objective of the method is to produce high quality product at low cost to the manufacturer. In this study, a four factor three level setup is chosen with a total of nine experiments to be conducted and hence the L9 OA was chosen. MINITAB is a software product that helps us to analyze the data. This software is designed essentially for the six sigma professionals. It provides an effective way to input the data, manipulate that data, identify trends and then extrapolate answers to the present issues. MINITAB calculates response tables and generates main effects and interaction plots for:-
Means (static design) vs. the control factors
Signal-to-noise ratios (S/N ratios) vs. the control factors
V. CALCULATIONS AND ANALYSIS
International Journal of Emerging Technology and Advanced Engineering
Website: www.ijetae.com (ISSN 2250-2459, ISO 9001:2008 Certified Journal, Volume 9, Issue 1, January 2019)
82
……….. (5.1)Where,
Wrw = Work piece Removal Weight in gram T = Machining Time in minutes (20 min.)
[image:3.612.42.295.251.468.2]The calculated values of material removal rate for both the electrode are shown in table: 1 given below.
Table 1
MRR for Copper and Brass Electrode
Run I V Ton Toff MRR (g/min)
Copper Electrode
Brass Electrode
1 5 30 100 6 0.0255 0.0226
2 5 35 150 8 0.0296 0.0270
3 5 40 200 10 0.0318 0.0296
4 10 30 150 10 0.0385 0.0354
5 10 35 200 6 0.0457 0.0413
6 10 40 100 8 0.0311 0.0291
7 15 30 200 8 0.0547 0.0507
8 15 35 100 10 0.0414 0.0385
9 15 40 150 6 0.0473 0.0445
[image:3.612.319.570.314.650.2]The comparison of material removal rate i.e. copper vs. brass is shown in fig. 4.1. From this fig., it is clear that the material removal rate given by copper electrode is more than the brass electrode. This is due to fact that, the electrical conductivity of copper is more than that of the brass. Also, the other properties like thermal conductivity, density, melting point, yield strength etc. of copper are better than that of brass.
Figure 2 MRR (Copper vs. Brass)
5.2 Calculation of TWR:It is the amount of metal removed from the tool electrode in gram to the machining time. Mathematically, the tool wear rate is calculated as given in equation (5.2).
….…. (5.2)
Where,
Trw = Tool Removal Weight in gram T = Machining Time in minutes (20 min.)
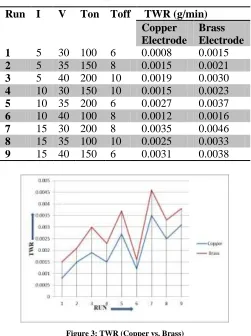
The tool wear rate for both the materials is calculated by using the above formula represented by equation 5.2 and is tabulated in table 2 as:
Table 2
TWR for Copper and Brass Electrode
Run I
V
Ton Toff TWR (g/min)
Copper
Electrode
Brass
Electrode
1
5
30 100
6
0.0008
0.0015
2
5
35 150
8
0.0015
0.0021
3
5
40 200
10
0.0019
0.0030
4
10 30 150
10
0.0015
0.0023
5
10 35 200
6
0.0027
0.0037
6
10 40 100
8
0.0012
0.0016
7
15 30 200
8
0.0035
0.0046
8
15 35 100
10
0.0025
0.0033
9
15 40 150
6
0.0031
0.0038
Figure 3: TWR (Copper vs. Brass)
[image:3.612.59.279.569.711.2]International Journal of Emerging Technology and Advanced Engineering
Website: www.ijetae.com (ISSN 2250-2459, ISO 9001:2008 Certified Journal, Volume 9, Issue 1, January 2019)
83
5.3 Calculation of S/N Ratio (MRR): The S/N ratios for MRR are calculated as given in Equation (5.3). Taguchi method is used to check the result of response of process parameter for higher the better criteria.
…. (5.3)
Where,
S/Ni= Signal to Noise Ratio for ith experiment
i= Experiment number u= Trial number for parameter Ni= Number of trials for experiment i
[image:4.612.42.293.136.476.2]y= Response Parameter (MRR)
Table 3: S/N Ratio for MRR
Run I V Ton Toff S/N Ratio Copper Electrode
Brass Electrode
1 5 30 100 6 -31.8692 -32.9178
2 5 35 150 8 -30.5742 -31.3727
3 5 40 200 10 -29.9515 -30.5742
4 10 30 150 10 -28.2908 -29.0199
5 10 35 200 6 -26.8017 -27.6810
6 10 40 100 8 -30.1448 -30.7221
7 15 30 200 8 -25.2403 -25.8991
8 15 35 100 10 -27.6600 -28.2908
9 15 40 150 6 -26.5028 -27.0328
[image:4.612.319.570.158.232.2]The response tables for S/N ratio by using copper and brass electrode are shown in table 4 and table 5 respectively. The response table shows the effect of process parameters on the output characteristics. The values of delta and rank for process parameters i.e. current, voltage, pulse on time and pulse off time are 4.33, 0.52, 2.56, 0.26 and 1, 3, 2 and 4 respectively, in response table for S/N ratio using copper electrode is shown in table 4. Similarly from response table for S/N ratio using brass electrode is shown in table 5. The delta values and rank for parameters are 4.55, 0.33, 2.59, 0.12 and 1, 3, 2 and 4 respectively. The delta value and rank shows the relative importance of each process parameter to the response.
Table 4
Response Table for S/N Ratio using Copper Electrode (MRR)
Level I V Ton Toff
1 -30.80 -28.47 -29.89 -28.39
2 -28.41 -28.35 -28.46 -28.65
3 -26.47 -28.87 -27.33 -28.63
Delta 4.33 0.52 2.56 0.26
Rank 1 3 2 4
Table 5
Response Table for S/N Ratio using Brass Electrode (MRR)
Level I V Ton Toff
1 -31.62 -29.28 -30.64 -29.21
2 -29.11 -29.11 -29.14 -29.33
3 -27.07 -29.44 -28.05 -29.29
Delta 4.55 0.33 2.59 0.12
Rank 1 3 2 4
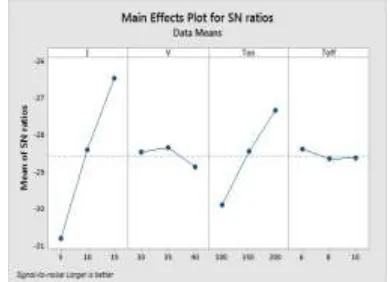
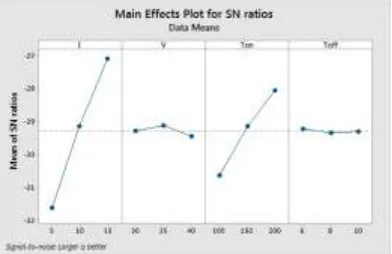
[image:4.612.345.540.381.522.2]From these response tables, it is clears that the process parameter which possesses highest delta value gets highest rank. The current gets 1st rank followed by pulse on time, voltage and pulse off time when machining is done with copper electrode. And, the similar effect is noted in case of brass electrode i.e. the current gets rank 1 followed by pulse on time, voltage and pulse off time. It is clear from these response tables that, the current has highest effect on material removal rate followed by pulse on time voltage and pulse off time. The individual effect of each process parameter on material removal rate for both the electrodes is shown graphically in fig. 4 and 5 respectively.
Figure 4 Main Effects plot for S/N Ratio using Copper Electrode (MRR)
[image:4.612.43.297.654.727.2]International Journal of Emerging Technology and Advanced Engineering
Website: www.ijetae.com (ISSN 2250-2459, ISO 9001:2008 Certified Journal, Volume 9, Issue 1, January 2019)
[image:5.612.71.267.136.263.2]84
Figure 5 Main Effects plot for S/N Ratio using Brass Electrode (MRR)5.4 Calculation of S/N Ratio (TWR):The S/N ratios for tool wear rate are calculated as given in Equation (5.4). Taguchi method is used to check the result of response of process parameter for smaller the better criteria.
…. (5.4)
Where,
S/Ni= Signal to Noise Ratio for ith experiment
i= Experiment number u= Trial number for parameter Ni= Number of trials for experiment i
[image:5.612.319.570.158.232.2]y= Response Parameter (TWR)
Table 6: S/N Ratio for TWR
Run I V Ton Toff S/N Ratio Copper Electrode
Brass Electrode
1 5 30 100 6 61.9382 56.4782
2 5 35 150 8 56.4782 53.5556
3 5 40 200 10 54.4249 50.4576
4 10 30 150 10 56.4782 52.7654
5 10 35 200 6 51.3727 48.6360
6 10 40 100 8 58.4164 55.9176
7 15 30 200 8 49.1186 46.7448
8 15 35 100 10 52.0412 49.6297
9 15 40 150 6 50.1728 48.4043
The response tables for S/N ratio by using copper and brass electrode are shown in table 7 and table 8 respectively. The values of delta and rank for process parameters viz. current, voltage, pulse on time and pulse off time are 7.17, 2.55, 5.83, 0.36 and 1, 3, 2 and 4 respectively, in response table for S/N ratio using copper electrode is shown in table 7.
Table 7:
Response Table for S/N Ratio using Copper Electrode (TWR)
Level I V Ton Toff
1 57.61 55.85 57.47 54.49
2 55.42 53.30 54.38 54.67
3 50.44 54.34 51.64 54.31
Delta 7.17 2.55 5.83 0.36
Rank 1 3 2 4
[image:5.612.42.296.275.625.2]Similarly from response table for S/N ratio using brass electrode is shown in table 4.8. The delta values and rank for parameters are 5.24, 1.39, 5.40, 1.12 and 2, 3, 1 and 4 respectively.
Table 8:
Response Table for S/N Ratio using Brass Electrode (TWR)
Level I V Ton Toff
1 53.50 52.00 54.01 51.17
2 52.44 50.61 51.58 52.07
3 48.26 51.59 48.61 50.95
Delta 5.24 1.39 5.40 1.12
Rank 2 3 1 4
The response table shows the delta value and rank for each process parameters. The delta value and rank represents the relative importance of each process parameter toward the response.
From these response tables, it is clears that the process parameter having highest delta value gets highest rank. The current gets 1st rank followed by pulse on time, voltage and pulse off time in case of copper electrode. On the other hand, in case of brass electrode, the pulse on time gets 1st rank followed by current, voltage and pulse off time. From these response tables it is clear that, the current has highest effect on tool wear rate followed by pulse on time voltage and pulse off time when machining is done with copper electrode while pulse on time has most significant effect followed by current, voltage and pulse off time in case of brass electrode.
[image:5.612.321.569.312.386.2]International Journal of Emerging Technology and Advanced Engineering
Website: www.ijetae.com (ISSN 2250-2459, ISO 9001:2008 Certified Journal, Volume 9, Issue 1, January 2019)
[image:6.612.66.268.199.355.2]85
This is because, as the intensity of current and pulse on time increases, the area of plasma channel generated also increases and more positive ions move towards the cathode which forced to remove more material from the surface of electrode.Figure 6: Main Effects plot for S/N Ratio using Copper Electrode (TWR)
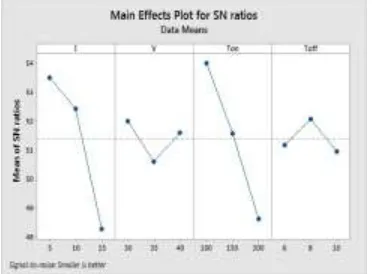
The main effect plot using brass electrode is shown in fig. 7. From this fig., it is clear that the pulse on time and current has the significantly affects the tool wear rate while voltage and pulse off time has less effect on tool wear rate. As the pulse on time and current increases, the tool wear rate increases rapidly while with the increase in voltage, the tool wear rate increases first and then decreases. On the other hand, with the increase in pulse off time the tool wear rate decreases first and then increases.
Figure 7: Main Effects plot for S/N Ratio using Brass Electrode (TWR)
VI. CONCLUSIONS AND FUTURE SCOPE
Conclusions:The main objective of this research work is to find the effect of electrode material on material removal rate and tool wear rate and further is to find the effects of each process parameters towards the response. For this work, a bar of SS 316 is used as a work piece and cylindrical shaped copper and brass rod with 8mm in diameter is used as a tool material. The complete work is done by an Electric Discharge Machine, model ELEKTRA EMS 5535 installed at CITCO, industrial area phase-I, Chandigarh. The design of experiment is based on Taguchi L9 orthogonal array. The following conclusions have been made from this study:-
1. Copper electrode gives more material removal rate as
compare to brass electrode.
2. Brass electrode gives more wear rate than copper electrode.
3. For material removal rate, the most significant parameter is current followed by pulse on time, voltage and pulse off time for both the electrodes. Current (15 amp.), Voltage (35 volt), Pulse on Time (200 µs) and Pulse off Time (6 µs) gives maximum material removal.
4. As the current and pulse on time increases, the material removal rate also increase. The voltage and pulse off time has not much affects the material removal rate.
5. For tool wear rate, the most significant parameter is current followed by pulse on time, voltage and pulse off time in case of copper electrode while pulse on time followed by current, voltage and pulse off time in case of brass electrode. Current (5 amp.), Voltage (30 volt), Pulse on Time (100 µs) and Pulse off Time (10 µs) gives minimum tool wear rate.
6. As the current and pulse on time increases, the tool wear rate also increases while with the increase in voltage it increase first then decrease. On the other hand as the pulse off time increases, the tool wear rate decrease first and then increase.
7. It is observed that, voltage and pulse off time has very small effect on material removal rate as well as tool wear rate.
[image:6.612.76.262.499.636.2]International Journal of Emerging Technology and Advanced Engineering
Website: www.ijetae.com (ISSN 2250-2459, ISO 9001:2008 Certified Journal, Volume 9, Issue 1, January 2019)
86
Due to this fact, these optimization techniques have very limited areas of application. On the other hand, Taguchi Design approach requires less number of experiments to optimize performance parameters. This design approach is best suited to optimize the performance parameters individually and hence it can also be applied to optimize other performance parameters like surface roughness (SR), heat affected zone (HAZ), over cut (OC) and white layer thickness etc.REFERENCES
[1] Kakkar K., Rawat N., Jamwal A., Aggarwal A., “Optimization of
Surface Roughness, Material Removal Rate and Tool Wear Rate in EDM using Taguchi’s Method”. International Journal of Advance Research, Ideas and Innovations in Technology, Vol. 4, 2018.
[2] Dewangan S.K., Tiger C., Nayak N., “Optimization of EDM Process
Parameters by Using PCA based Gray Relation Analysis”. International Journal of Mechanical and Proguction Engineering, Vol. 6, 2018.
[3] Kandpal B.C., Kumar J., Singh H., “Optimization and
Characterization of EDM of AA 6061/ 10% Al2O3 AMMC using
Taguchi’s Approach and Utility Concept”. Production and Manufacturing Research, Vol. 5, 2017.
[4] Arya G., Garg S.K., “Experimental investigation to identify the
parametric effect on material removal rate and electrode wear rate during PMEDM.” International Journal of Engineering Technology Science and Research, Vol. 3, 2016.
[5] Mujawar J., Karande P.S., “effect of EDM process parameter on
surface roughness using AISI D2 material.” International Journal of Innovation in Engineering, Research and Technology, Vol. 4, 2016.
[6] Karande P.S., Mujawar J.S., “Effect of EDM process parameter on
tool wear using EN-31 Steel tool.” International Journal of Innovation in Engineering Research and Technology, Vol. 2, 2016.
[7] Mujawar J., Potdar V.V., “Process optimization using DOE for
realizing the optimum value of surface roughness over EDM-Experimentation.” International Journal of Informative Futuristic Research. Vol. 3, 2016.
[8] Gudur S., Potdar V.V., “Effect of Silicon Carbide Powder Mixed
EDM on Machining Characteristics of SS 316 L Material”. International Journal of Innovative Research in Science, Engineering and Technology, Vol. 4, 2015.
[9] Abrol A., Sharma S., “Effect of Chromium Powder Mixed Dielectric
on Performance Characteristics of AISI D2 Die Steel Using EDM”. International Journal of Research in Engineering and Technology, Vol. 4, 2015.
[10] Pandey V.P., Mall R.N., “Analysis of material removal rate of AISI