International Journal of Emerging Technology and Advanced Engineering
Website: www.ijetae.com (ISSN 2250-2459, ISO 9001:2008 Certified Journal, Volume 7, Issue 11, November 2017)
88
Structure and Kinetic Study of Amorphous
Fe
73.5
Si
13.5
B
9
Nb
3
Cu
1
Alloy using XRD and DSC
M. D. V. Srilalitha
1, B. Bhanu Prasad
2Department of Sciences & Humanities, M.V.S.R. Engineering College, Nadergul, Hyderabad, India
1 Pursuing Ph.D in Rayalaseema University,Kurnool, India
Abstract— XRD and DSC techniquesareused to investigate
thestructure and kinetic study of amorphousFe73.5 Si13.5 B9
Nb3Cu1 alloy.Different ribbon samples of amorphousFe73.5
Si13.5 B9 Nb3Cu1 alloy are annealed for one hour at
temperatures 400oC, 550oC and 700oC, separately. From the
XRD patterns of these samples, recorded at room temperature , it is found that α-Fe(Si) phase appeared clearly when the amorphous sample is annealed at 400oC for one hour. For the amorphous sample annealed at 550oC for one hour, Fe2B phase appeared in addition to α-Fe(Si). The peaks
of α-Fe(Si) and Fe2B become still sharper at the same
positions when the amorphous sample is annealed at 700oC. Average grain size of the sample is calculated andis found to be 13.25nm.
DSC curves of amorphous Fe73.5 Si13.5 B9 Nb3Cu1 alloy
recorded at different heating rates showed two peaks.It is observed that when the heating rate increases, the position of the peaks is shifted to the higher temperatures.From DSCcurves the activation energy (Ea) and frequency factor
(k0) of amorphous Fe73.5 Si13.5 B9 Nb3Cu1 alloyare calculated
using Kissinger equation, Augis& Bennet and Matusita - Sakka methods. The average activation energy of the sample
Fe73.5Si13.5B9Nb3Cu1for Peak 1 and Peak 2 is found to be
146.73 kJouls/mole and 85.75kJouls/mole, respectively.
Similarly, the frequency factor of the sample for Peak 1 and Peak 2, using Kissinger method is found to be 3.971 x 10¹⁰(sec)-1 and 2.96 x 10² (sec)-1, respectively. The frequency factor of the sample for Peak 1 and Peak 2, using Augis & Bennet method is found to be 2.072 x 10¹² (sec)-1 and 2.88 x 10⁴ (sec)-1, respectively.
Keywords— x-ray diffraction, grain size, crystallization,
differential scanning calorimetry, activation energy, frequency factor
I. INTRODUCTION
A new family of alloys Fe-Si-B-Nb-Cu, also known as FINEMET, have been been developed and this family showed excellent soft magnetic properties for magnetic sensors and other applications [1]. All these alloys show high permeability, high saturation induction, low coercivity and considerable resistivity.Each element in Fe-Si-B-Nb-Cu has a role in the alloy. The pure iron is a ferromagnetic material; it has a high saturation induction and high permeability.
The additional elements produce a slight decrease in magnetic saturation, but improve other magnetic properties. The silicon presence in the alloy decreases a little bit the saturation induction, but raises the electrical resistivity, reducing eddy currents losses, also lowering the magnetostriction, the magnetic anisotropy and the coercivity. The boron assists the niobium to inhibit the growth of nanocrystals [2].The main effect of niobium is to inhibit the nanocrystals growth during the annealing. Previous works showed that alloys of high content of Nb present smaller size of crystals than alloys of low or without any content of Nb [3]. The Nb is a stabilizer of amorphous phase [4] and changes the Cu solubilization, thus promoting a finer nanoclusters distribution [5]. The copper is the catalyst for the nucleation of the nanocrystals. It was shown that alloys with 1% of Cu presents a homogeneous distribution of nanocrystals [5].Hence, in this
paper, thestructure and kinetic study of amorphousFe73.5
Si13.5 B9 Nb3Cu1 alloy are discussedusing XRD and DSC
techniques.
II. EXPERIMENTAL
AmorphousFe73.5Si13.5B9Nb3Cu1alloy ribbons were
prepared by melt spinning technique which are procured from our other researchers. These ribbons are about 30-40 µm thick and 3-5mm wide. Annealing treatment on these as cast ribbon samples was carried out using DSC at
different temperatures 400oC, 550oC and 700oC,
separately for one hour. Also, DSC studies on the
amorphous Fe73.5Si13.5B9Nb3Cu1alloyribbonswere carried
out at different heating rates 5oC/min,10oC/min,15oC/min
and 20 oC/min in the temperature range 30oC - 1000oC.
III. RESULTS AND DISCUSSION
Figure1shows room temperarure XRD patterns of
amorphous Fe73.5Si13.5B9Nb3Cu1alloy after annealing the
amorphous samples at different temperatures400oC, 550oC
and 700oC, separately for one hour. Figure 1 also shows
International Journal of Emerging Technology and Advanced Engineering
Website: www.ijetae.com (ISSN 2250-2459, ISO 9001:2008 Certified Journal, Volume 7, Issue 11, November 2017)
89
20 30 40 50 60 70 80
in
te
nsi
ty
2theta
7000
C
5500
C
4000
C
ascast
Fe(Si)
Fe(Si)
Fe(Si)
[image:2.612.327.558.548.639.2]Fe2B
Figure 1 XRD plots of amorphous Fe73.5Si13.5B9Nb3Cu1 alloy at
different annealing temperatues.
From the XRD patterns of the samples, it is found that
a broad peak appeared around 450indicating the presence
of α-Fe(Si) phase, when the amorphous sample is
annealed at 400oCfor one hour. For the amorphous sample
annealed at 550oC for one hour, a sharp peak at the same
450 and another broad peak appeared around 670indicating
the presence of Fe2B phase in addition to α-Fe(Si). The
peaks of α-Fe(Si) and Fe2B become still sharper when the
amorphous sample is annealed at 700oC for one hour.
Comparing our results with those of others, we can conclude that in Fig. 3, clusters are observed in the amorphous matrix which may be the precipitate microstructure of α-Fe.
Some Fe-Si-B-Cu-Nb alloys showed a nanocrystalline structure, the α-Fe(Si) phase, embedded in the remaining amorphous matrix [6]. The composition of these
nanograins or nanocrystals is around Fe3Si, which result on
DO3 order [7]. The size of the DO3 order region and the
degree of order of the α-Fe(Si) phase increase with increasing annealing temperature and the local content of Si into bcc nanograins is bigger than the mean content of alloy [8]. Several mechanisms occur during annealing processes: at the initial stage the copper diffusion through amorphous matrix produce the formation of small Cu rich clusters randomly dispersed. These Cu clusters work as catalyst of the α-Fe(Si) nucleation [9], which is only possible with niobium addition [8,9]. These Cu clusters continue to grow during the crystallization process until reaching the size around of 5 nm [9].
As shown in Fig. 1, in the final stages of the annealing
there are two phases: α-Fe(Si) nanocrystals and Fe2B. The
average grain size (D) is determined from the XRD pattern using Debye Scherrer formula
D =
where λ is the X-ray wavelength, θ is the angle of diffraction, and β (rad) is the full width at half maximum (FWHM) of the diffraction peak. Average grain size of the sample is observed to be 13.25nm. Table1 shows the grain
size of amorphous Fe73.5Si13.5B9Nb3Cu1alloy at different
temperatures.
It is found that the grain size calculated increases with increase in the annealing temperature.
Table 1
Grain size of amorphous Fe73.5Si13.5B9Nb3Cu1 alloy at different
annealing temperatures calculated using Debye Scherrer formula
Sample At 400oC At 550oC At 700oC
Peak 1
Peak 2
Peak 1
Peak 2
Peak 1
Peak 2
Fe73.5
Si13.5 B9
Nb3Cu1
3.5n m
No peak
10nm 7.68n
m
26.3n m
18.8n m
Average grain size of the sample was calculated and was found to be 13.25 nm. As in Table 1, the grain size of
the second peak of the samples annealed at 550oC and
700oC is less than that of the grain size of the first peak
annealed at at 550oC and 700oC, respectively. Figures 2
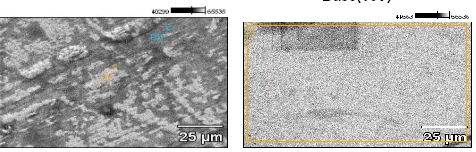
and 3 show the SEM images amorphous
Fe73.5Si13.5B9Nb3Cu1alloy before heating and after heating.
Figures 2 & 3 SEM images before and after heating
Figures 4 and 5 show the EDS report of the sample before and after heating respectively. EDS report confirms
International Journal of Emerging Technology and Advanced Engineering
Website: www.ijetae.com (ISSN 2250-2459, ISO 9001:2008 Certified Journal, Volume 7, Issue 11, November 2017)
90
Figures 4 and 5 EDS report of amorphous Fe73.5Si13.5B9Nb3Cu1 alloy
before and after heating
Figure 6 shows the Differential Scanning Calorimetry
(DSC) curves of amorphousFe73.5Si13.5B9Nb3Cu1alloy at
heating rates of 5oC/min, 10oC/min, 15oC/min and 20 oC
/min in the temperature range 30oC - 1000oC. DSC
curves of the sample at different heating rates showed two peaks. Thus, Two stage crystallization reactions have been
observed in amorphous Fe73.5 Si13.5 B9 Nb3Cu1 alloy using
DSC. A wide region between the two crystallization stages occurs that ensures theuseful properties of the material before boride formation. It is observed that when the heating rate increases, the position of the peaks shifts to the higher temperatures.Comparing with XRD results, these
two peaks represent the crystallization of α-Fe(Si) and Fe2B
phases.It is observed that when the heating rate increases, the position of the peaks shifts to the higher temperatures as shown in Fig. 6. In Table 2, Peak temperatures of
amorphous Fe73.5Si13.5B9Nb3Cu1 alloy at different heating
rates are given.
Temp Cel 850.0 800.0 750.0 700.0 650.0 600.0 550.0 500.0 450.0 400.0 D SC m W -3.000 -3.500 -4.000 -4.500 -5.000 -5.500 -6.000 -6.500 -7.000 -7.500 -8.000 552.0Cel -5.408mW -31.4mJ/mg 532.3Cel -6.049mW 589.9Cel -6.603mW -50.0mJ/mg 680.7Cel -6.104mW 785.2Cel -4.817mW 733.7Cel -4.908mW Temp Cel 800.0 750.0 700.0 650.0 600.0 550.0 500.0 450.0 400.0 DS C m W -1.600 -1.800 -2.000 -2.200 -2.400 -2.600 -2.800 -3.000 -3.200 -3.400 549.1Cel -2.135mW -31.3mJ/mg 527.5Cel -2.649mW 589.0Cel -2.696mW 717.1Cel -2.335mW -16.1mJ/mg 705.0Cel -2.452mW 759.9Cel -2.549mW
Heating rate 200C/min Heating rate 150C/min
Temp Cel 800.0 750.0 700.0 650.0 600.0 550.0 500.0 450.0 400.0 D SC m W 2.000 1.500 1.000 0.500 0.000 532.2Cel 1.592mW -50.1mJ/mg 514.1Cel 1.329mW 554.9Cel 1.397mW 675.0Cel 1.658mW -102mJ/mg 651.2Cel 1.435mW 718.0Cel 1.386mW
[image:3.612.49.287.149.225.2]Heating rate 100C/min Heating rate 50C/min
Figure 6 DSC curves amorphous Fe73.5Si13.5B9Nb3Cu1 alloy at different
heating rates Table 2
Peak temperatures of amorphous Fe73.5Si13.5B9Nb3Cu1 alloy at
different heating rates
Heating rate
(K/min)
Peak 1 ( OC) Peak 2 ( OC)
5 532.2 675
10 537.6 689.8
15 549.1 717.1
20 552 733.7
From Fig. 6 and Table 2, the activation energy for
crystallization (Ea) and frequency factor (k0) are evaluated
using three theoretical models, Kissingers equation, Augis & Bennet and Matusita Sakka method. The expressions for the non-isothermal case in these models afford a simple determination of the kinetic parameters for crystallization.
According to Kissinger’s method [10,11], the
transformation under non-isothermal condition is
represented by a first-order reaction. Moreover, the concept of nucleation and growth has not been included in Kissinger equation.
International Journal of Emerging Technology and Advanced Engineering
Website: www.ijetae.com (ISSN 2250-2459, ISO 9001:2008 Certified Journal, Volume 7, Issue 11, November 2017)
91
Matusita et al.[12] have developed a method on the basis of the fact that crystallization does not advance by an
nth order reaction but by a nucleation and growth process.
They emphasized that crystallization mechanism such as bulk crystallization or surface crystallization should be considered for obtaining activation energy. Augis and Bennett method [13] is helpful in obtaining kinetic
parameters such as frequency factor (k0) along with
activation energy (Ea) of crystallization and therefore
preferred for the calculation of the kinetics over the other models [14].
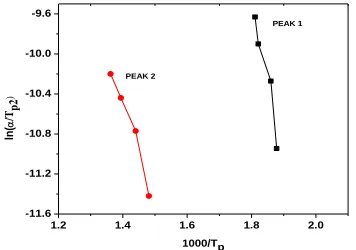
The activation energy for crystallization of an amorphous alloy under a linear heating rate can be estimated using Kissinger’s peak shift method, which
relates the peak temperature, Tp, with heating rate (α)
through the equation
ln (α/Tp
2
) = -(Ea/RTp) +ln(k0R/Ea)---(2)
where Ea is the activation energy for crystallization, k0
the frequency factor which is defined as the number of attempts made by the nuclei per second to overcome the energy barrier and R is the universal gas constant. This also provides information for the calculation of number of nucleation sites, present in the material for crystal growth
[11]. Figure 7 shows the graph of ln(α/Tp2) vs 1000/Tp of
amorphous Fe73.5Si13.5B9Nb3Cu1 alloy, which is a straight
line with a slope (–Ea/R) and an intercept of ln (k0R/Ea).
The activation energy and the frequency factor for crystallization peak calculated using Kissinger’s peak shift method for the given samples are given in Table 3.
1.2 1.4 1.6 1.8 2.0
-11.6 -11.2 -10.8 -10.4 -10.0 -9.6
ln
(
/Tp
2
)
1000/Tp PEAK 2
[image:4.612.57.235.500.625.2]PEAK 1
Figure 7 Kissinger plot of amorphous Fe73.5Si13.5B9Nb3Cu1 alloy
The activation energy for crystallization of an amorphous alloy under a linear heating rate can also be estimated using Matusita-Sakka’s peak shift method, which
relates the peak temperature, Tp, with heating rate (α)
through the equation.
ln (α) = -(Ea/RTp) + constant---(3)
where Ea is the activation energy for crystallization and
R is the universal gas constant. Figure 8 shows the graph of
ln (α) vs 1000/Tp of amorphous Fe73.5Si13.5B9Nb3Cu1 which
is a straight line with a slope (–Ea/R). The activation energy
calculated using Matusita-Sakka’s peak shift method for the given samples, is given in Table 3.
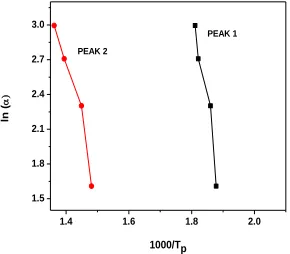
The activation energy for crystallization of an amorphous alloy under a linear heating rate can be estimated using Augis & Bennett method, which relates the
peak temperature, Tp, with heating rate (α) through the
equation
ln(α/Tp) = − Ea/ RTp+ ln ko ---(4)
where Ea is the activation energy for crystallization, R is
universal gas constant and k0 the frequency factor. Figure 9
shows the graph of ln (α /Tp) vs. 1000/Tp of
amorphousFe73.5Si13.5B9Nb3Cu1alloy which is a straight
line with a slope (–Ea/R) and an intercept of ln k0 . The
activation energy Ea and the frequency factor k0 for
crystallization peak using Augis & Bennett method for the given samples are also given in Table 3.
Table 3
Activation Energy, Ea (kJouls/mole) and Frequency factor, ko (sec)-1
[image:4.612.330.560.507.660.2]International Journal of Emerging Technology and Advanced Engineering
Website: www.ijetae.com (ISSN 2250-2459, ISO 9001:2008 Certified Journal, Volume 7, Issue 11, November 2017)
[image:5.612.78.223.155.282.2]92
Figure 8 : Matusita-Sakka plot of amorphous Fe73.5Si13.5B9Nb3Cu1
alloy
Table 3 shows the activation energy of amorphous
Fe73.5Si13.5B9Nb3Cu1alloy is calculated using the three
methods Kissinger, Augis and Bennet and Matusita – Sakka. Thus, from Table 3, the average activation energy
of the sample Fe73.5Si13.5B9Nb3Cu1 for Peak 1 and Peak 2is
found to be 146.73 kJouls/moleand 85.75kJouls/mole,
respectively. Similarly, the frequency factor of the sample for Peak 1 and Peak 2, using Kissinger method is found to
be 3.971 x 10¹⁰(sec)-1 and 2.96 x 10² (sec)-1, respectively.
The frequency factor of the sample for Peak 1 and Peak 2,
using Augis & Bennet method is found to be 2.072 x 10¹²
(sec)-1 and 2.88 x 10⁴ (sec)-1, respectively.
IV. CONCLUSIONS
From XRD studies, it is found that α-Fe(Si) phase appeared clearly without any other phase when amorphous
Fe73.5 Si13.5 B9 Nb3Cu1 alloy is annealed at 400
o
C for one
hour. In addition to α-Fe(Si), Fe2B phase appeared for the
amorphous sample annealed at 550oC for one hour. The
peaks of α-Fe(Si) and Fe2B become sharp at the same
positions when the amorphous sample is annealed at 700oC
for one hour. Average grain size of the sample is found to be 13.25 nm. DSC curve of the sample at different heating rates showed two peaks. Thus, Two stage crystallization reactions have been observed in amorphous
Fe73.5 Si13.5 B9 Nb3Cu1 alloy using DSC. A wide region
betweenthe two crystallization stages occurs that ensures theuseful properties of the material before boride formation.
It is observed that when the heating rate increases, the position of the peaks shifts to the higher temperatures.
From DSC curves the activation energy (Ea) of amorphous
Fe73.5 Si13.5 B9 Nb3Cu1 alloy using Kissinger equation,
Augis & Bennet and Matusita - Sakka methodsfor Peak 1
and Peak 2 is found to be 146.73 kJouls/mole and 85.75
kJouls/mole, respectively. Similarly, the frequency factor of the sample for Peak 1 and Peak 2, using Kissinger
method is found to be 3.971 x 10¹⁰ (sec)-1 and 2.96 x 10²
(sec)-1, respectively. The frequency factor of the sample
for Peak 1 and Peak 2, using Augis & Bennet method is
found to be 2.072 x 10¹² (sec)-1 and 2.88 x 10⁴ (sec)-1,
respectively.
Acknowledgements
The authors M.D.V. Srilalitha and B. Bhanu Prasad
acknowledge the encouragement given by the
Management, Principal, HOD of Sciences & Humanities and staff of M.V.S.R. Engineering College.
REFERENCES
[1] O. V. Nielsen, J. R. Petersen, and G. Herzer, IEEE Trans. Magn.
30(1994)1042
[2] W. Gawior, M. Woch, R. Kolano, and N. Wójcik,J. Magn. Magn.
Mater., 157 (1996) 207
[3] N. A. Mariano, C.A.C. Souza, J. E. May, and S. E. Kuri, Mater.
Sci. Engg. A354(2003) 1
[4] D. S. dos Santos and D. R. dos Santos, J. Non-Cryst. Solids,
304(2002) 56
[5] W. Lefebvre, S. Morin-Grognet, and F. Danoix, J. Magn. Magn.
Mat. 301 (2006) 343
[6] X. Y. Zhang, J. W. Zhang, F. R. Xiao, J. H. Liu, R. P. Liu, J. H.
Zhao, et al., Mater. Lett. 34(1998) 85
[7] P. Allia, P. Tiberto, M. Baricco, M. Knobel, and F. Vinai, IEEE
Trans. on Magn. 30(1994) 4797
[8] M. E. McHenry, F. Johnson, H. Okumura, T. Ohkubo, V. R. V.
Ramanan, and D. E. Laughlin, Scripta Materialia, 48( 2003) 881
[9] J.D. Ayers, V.G. Harris, J.A. Sprague and W.T. Elam, Appl. Phys.
Lett., vol. 64 (1994) 974
[10] H.E. Kissinger, Anal. Chem., 29, (1957) 1702.
[11] H.E.Kissinger, J. Res. National Bureau of Standards, 57 (1956) 217
[12] K.Matusita and S. Sakka, Bull. Inst. Chem. Res., 59 (1981) 159
[13] A.J. Augis and J.E. Bennett, J. Thermal Analysis and Calorimetry,
13 (1978) 283
[14] Deepika,P.K. Jain,K.S.Rathore and N.S. Saxena, J. Non-Cryst.
Solids, 355 (2009) 1274
1.4 1.6 1.8 2.0
1.5 1.8 2.1 2.4 2.7 3.0
ln
(
1000/Tp
PEAK 1