INTRODUCTION
Geographical difference in health status is a public health con-cern, which has become an important ethical and policy is-sue.1 Regional differences in health in Korea have been exam-ined between rural and urban areas2,3 or in areas with different
levels of deprivation.4,5 Due to the concentration of economic, social, cultural, and healthcare resources in the capital city Seoul in Korea, differences between Seoul and other parts of Korea, in terms of wide range of indicators for well-being, have been suggested.6-8
Seoul and Busan are the two largest cities in Korea. Although Seoul is considered to be wealthier than Busan according to in-dicators such as the per capita gross regional domestic prod-uct, the two cities share similar total fertility rate, unemploy-ment rate, and healthcare resources (Suppleunemploy-mentary Table 1, only online).9 One important difference between the two cit-ies is that life expectancy (LE) in Busan is shorter compared to Seoul. Prior investigations revealed worse indicators related to mortality levels in Busan compared to Seoul.5,10 As shown in Supplementary Table 2 (only online), more than 2-year short-falls have been recorded in Busan compared to Seoul between
Why is Life Expectancy in Busan Shorter than in Seoul?
Age and Cause-Specific Contributions to the Difference
in Life Expectancy between Two Cities
Young-Ho Khang
1,2and Jinwook Bahk
31Department of Health Policy and Management, Seoul National University College of Medicine, Seoul; 2Institute of Health Policy and Management, Seoul National University Medical Research Center, Seoul; 3Department of Public Health, Keimyung University, Daegu, Korea.
Purpose: Seoul and Busan are the two largest cities in Korea. However, life expectancy (LE) in Busan is shorter than in Seoul and among the total Korean population. This study was conducted to decompose age- and cause-specific contributions to the LE dif-ference between Seoul and Busan.
Materials and Methods: We obtained population and mortality data for Seoul and Busan between 2015 and 2017 from Statistics Korea. We applied Arriaga’s decomposition method to life table data to estimate age- and cause-specific contributions to the LE difference between Seoul and Busan.
Results: During 2015–2017, LE in Busan was shorter than in Seoul by 2.22 years. Roughly two-thirds of the LE gap between Seoul and Busan was due to excess mortality among elderly people in Busan. The ≥85 age group alone contributed to approximately 20% of the LE gap, while no meaningful contribution was made by the 1–24 age groups. Cardiovascular disease accounted for over 40% of the total LE gap between Seoul and Busan, and this factor was more prominent in women. The top 15 leading specific causes of deaths explained nearly the entire LE difference between Seoul and Busan.
Conclusion: The difference in LE between Seoul and Busan was due to higher mortality rate in Busan than in Seoul, especially in the elderly population and from cardiovascular diseases. Information on age- and cause-specific contributions to the LE differ-ence between Seoul and Busan may guide health policy-makers to plan strategies for reducing the gap in LE.
Key Words: Cause of death, life expectancy, mortality, Republic of Korea, Seoul
pISSN: 0513-5796 · eISSN: 1976-2437
Received: February 8, 2019 Revised: May 9, 2019 Accepted: May 25, 2019
Corresponding author: Jinwook Bahk, PhD, Department of Public Health, Keimy-ung University, 1095 Dalgubeol-daero, Dalseo-gu, Daegu 42601, Korea. Tel: 82-53-580-5190, Fax: 82-53-580-5190, E-mail: [email protected] •The authors have no potential conflicts of interest to disclose. © Copyright: Yonsei University College of Medicine 2019
This is an Open Access article distributed under the terms of the Creative Com-mons Attribution Non-Commercial License (https://creativecomCom-mons.org/licenses/ by-nc/4.0) which permits unrestricted non-commercial use, distribution, and repro-duction in any medium, provided the original work is properly cited.
2005 and 2017.11 The pattern held true for men and women. LE in Busan has also been lower than among the total Korean population since 2005, with a nearly 1-year disadvantage com-pared to the total Korean population observed among men and women in Busan (Supplementary Table 2, only online). Ac-cording to data from the Korea Statistical Information Service on provincial LEs, Busan, along with South Gyeongsang prov-ince and North Chungcheong provprov-ince, recorded the lowest LE in 2017 among 17 provinces in Korea.11
Such low LE in Busan has regularly drawn media atten-tion.12-17 Since Statistics Korea has released LE information at the provincial level, the unexpectedly low LE in Busan has been highlighted in newspapers, especially in Busan.13-15,17 For example, in 2012, Busan-ilbo, a major newspaper in Busan, dealt with the health status of Busan and public health infra-structure in a series of 20 articles.17 In the media, several factors have been suggested as the causes of low LE and high mortali-ty in Busan, including unhealthy lifesmortali-tyles,12 low income and air pollution,15 high prevalence of chronic diseases,13 and poor regional public healthcare system.16,17
One approach to deciphering the causes of lower LE in Busan is to decompose the age- and cause-specific contribu-tions to the LE disadvantage in Busan. Such decomposition al-lows us to quantify the magnitude of the contributions made by each age group and cause of death leading to the LE differ-ence between Seoul and Busan. Based on such quantifica-tions, meaningful information on risk factors associated with age at death and causes of death might be obtained. There-fore, this study was conducted to decompose age- and cause-specific contributions to the LE difference between Seoul and Busan.
MATERIALS AND METHODS
Data
This study was approved by the Seoul National University Hospital Institutional Review Board (IRB No. E-1810-008-975). We only used publicly available secondary data without any personal identifiers. We obtained population and mortal-ity data for Seoul and Busan between 2015 and 2017 from Sta-tistics Korea. Population and mortality data included the numbers of mid-year population and deaths according to sex and age groups (0, 1–4, 5–9, 10–14, …, 80–84, ≥85). A total of 29442594 subjects and 129509 deaths were analyzed for Seoul, while 10392063 subjects and 63310 deaths were examined for Busan (Supplementary Table 3, only online). Considering the small numbers of deaths among the 1–4, 5–9, and 10–15 age groups, 3-year data were combined to examine LE and age-specific contributions to the LE gap between Seoul and Busan. Mortality data were also aggregated by causes of death, which were coded according to the International Classification of Diseases, 10th Revision (ICD-10).
Statistical analysis
We calculated LE at birth for men and women in Seoul and Busan, constructing life tables using 5-year probabilities of death (Table 1). We applied Arriaga’s decomposition method to the life table data to estimate age- and cause-specific contri-butions to the LE difference between Seoul and Busan.18,19 The results of LE decomposition according to different methods were found to be similar.20 Prior Korean studies used this meth-od to examine age- and cause-specific contributions to LE dif-ferences by calendar year,21 sex,22 education,23 income,24,25 and country.26 This decomposition method estimates the contri-bution of mortality differences in each age group and cause of death to the total difference in LE at birth. The sum of the cause-specific contributions to the difference in LE for a given age is equal to the total contribution for that age group, and the total differences in LE between Seoul and Busan were considered to be the sum of age- and cause-specific components. In this study, positive age-specific and cause-specific contributions referred to absolute-year contributions (e.g., 0.4 years) to the LE difference between Seoul and Busan (i.e. LE in Seoul mi-nus LE in Busan) due to the higher mortality rates in Busan across age groups and causes of death compared to Seoul. Negative contributions referred to the reverse pattern. We pre-sented the 5-year age group-specific contributions to the LE gap between Busan and Seoul in Fig. 1 and Supplementary Ta-ble 4 (only online). Regarding the cause-specific contribu-tions, we first categorized causes of death into 15 broad groups (Fig. 2 and Supplementary Table 5, only online). Then, we also examined cause-specific contributions to the LE gap accord-ing to 60 detailed causes (Fig. 3 and Supplementary Table 6, only online). The classification schemes were based on previ-ous report.27
RESULTS
[image:2.595.300.539.682.734.2]Table 1 presents LE at birth by sex for the years 2015–2017 bined in Busan and Seoul. In men, Seoul had a greater LE com-pared to Busan by 2.49 years. The LE gap in women was slight-ly smaller than that in men (a 1.83-year difference). Overall, Busan citizens had shorter LE than Seoul citizens by 2.22 years. Fig. 1 and Supplementary Table 4 (only online) show age-specific contributions to the LE difference between Busan and Seoul due to excess mortality in Busan. Except for ages 1–4, all age groups positively contributed to the LE gap be-tween Seoul and Busan among men and women combined
Table 1. Life Expectancy at Birth in Seoul and Busan by Sex in 2015–
2017 Combined
Seoul Busan Difference
Overall 84.15 81.93 2.22
Men 81.09 78.60 2.49
(Supplementary Table 4, only online). In women, due to the small numbers of deaths among ages 1–4 (n=11), 5–9 (n=13), and 10–14 (n=6) in Busan, unstable patterns in age-specific contributions were noticed. Fig. 1 also shows increasing age-specific contributions with age, especially in men. The contri-bution made by elderly people aged ≥65 was 1.47 years, ac-counting for 66.2% of the total LE gap (2.22 years) in men and women combined. The corresponding figures for men and women were 1.53 years in men (61.4% of the total LE gap in men) and 1.35 years in women (73.7% of the total LE gap in women). In men and women, the largest age-specific contri-bution was made by the ≥85 age group: 0.48 years in men and women combined, 0.42 years in men, and 0.47 years in women. This contribution by the ≥85 age group accounted for 21.5% of
the total LE gap between Seoul and Busan in men and women combined, 16.8% in men, and 25.4% in women.
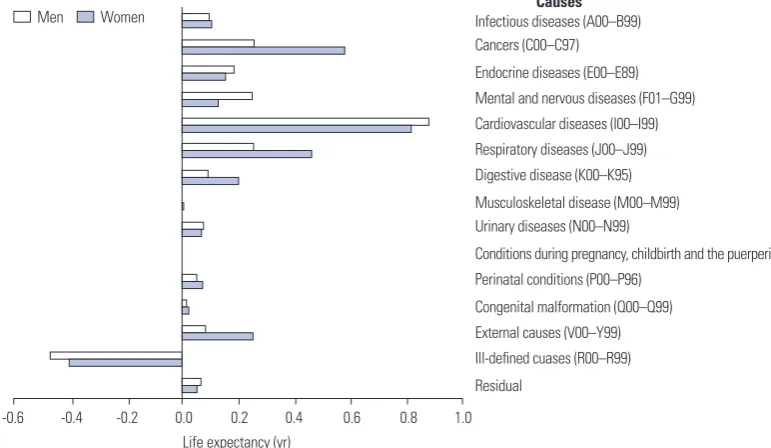
Fig. 2 and Supplementary Table 5 (only online) present 15 broad cause-specific contributions to the LE difference. Of the 15 broad causes of death, positive contributions to the LE gap were found for 14 causes among men and women, with the exception of ill-defined causes (ICD-10 code: R00–R99). The largest positive contribution was made by cardiovascular dis-eases (I00–I99) in both men and women: 0.94 years in men and women combined, 0.81 years in men, and 0.88 years in women. This contribution by cardiovascular diseases ac-counted for 42.1% of the total LE gap between Seoul and Busan in men and women combined, 32.7% in men, and 48.0% in women. In men, contributions by cancers (C00–C97), respira-0.5
0.4
0.3
0.2
0.1
0
-0.1
0 1–4 5–9 10–14 15–19 20–24 25–29 30–34 35–39 40–44 45–49 50–54 55–59 60-64 65-69 70–74 75–79 80–84 ≥85 Age
Life expectancy (yr)
[image:3.595.93.515.73.272.2]Men Women
Fig. 1. Age-specific contributions to the life expectancy difference between Seoul and Busan by sex in 2015–2017 combined.
Causes Infectious diseases (A00–B99) Cancers (C00–C97) Endocrine diseases (E00–E89) Mental and nervous diseases (F01–G99) Cardiovascular diseases (I00–I99) Respiratory diseases (J00–J99) Digestive disease (K00–K95) Musculoskeletal disease (M00–M99) Urinary diseases (N00–N99)
Conditions during pregnancy, childbirth and the puerperium (O00–O99) Perinatal conditions (P00–P96)
Congenital malformation (Q00–Q99) External causes (V00–Y99) Ill-defined cuases (R00–R99) Residual
Men Women
[image:3.595.91.477.306.530.2]-0.6 -0.4 -0.2 0.0 0.2 0.4 0.6 0.8 1.0 Life expectancy (yr)
tory diseases (J00–J99), and external causes (V00–Y99) were especially significant. These four broad causes (cardiovascular diseases, cancer, respiratory diseases, and external causes) to-gether contributed positively to 2.10 years (94.3%) of the LE gap in men. In women, in addition to cardiovascular diseases, significant contributors to the LE gap included cancers, endo-crine diseases (E00–E89), mental and nervous diseases (F01– G99), and respiratory diseases. Meanwhile, contributions by musculoskeletal disease (M00–M99), conditions during preg-nancy, childbirth and puerperium (O00–O99), and congenital
malformations (Q00–Q99) were minimal in both men and women.
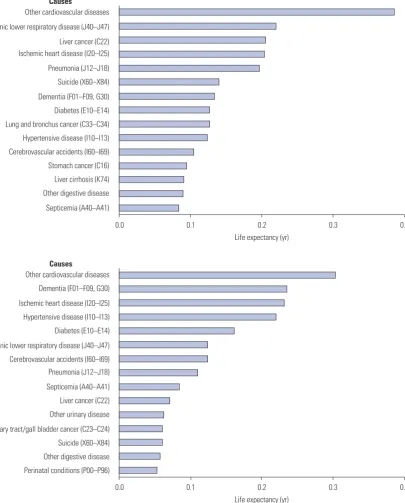
[image:4.595.93.499.77.581.2]Fig. 3 shows cause-specific contributions to the LE gap be-tween Seoul and Busan for the top 15 leading causes in terms of the absolute magnitude of the contribution, which was de-rived from an analysis of cause-specific contributions to the LE gap according to 60 detailed causes of death (Supplemen-tary Table 6, only online). Combined contributions of the top 15 causes to the LE gap were 2.31 years in men and 1.95 years in women, corresponding to 93.0% of total LE gap in men and Fig. 3. Detailed cause-specific contributions to the life expectancy difference between Seoul and Busan by sex (A: men, B: women).
Causes
Other cardiovascular diseases Chronic lower respiratory disease (J40–J47) Liver cancer (C22) Ischemic heart disease (I20–I25) Pneumonia (J12–J18) Suicide (X60–X84) Dementia (F01–F09, G30) Diabetes (E10–E14) Lung and bronchus cancer (C33–C34) Hypertensive disease (I10–I13) Cerebrovascular accidents (I60–I69) Stomach cancer (C16) Liver cirrhosis (K74) Other digestive disease Septicemia (A40–A41)
0.0 0.1 0.2 0.3 0.4 Life expectancy (yr)
Causes
Other cardiovascular diseases Dementia (F01–F09, G30) Ischemic heart disease (I20–I25) Hypertensive disease (I10–I13) Diabetes (E10–E14) Chronic lower respiratory disease (J40–J47) Cerebrovascular accidents (I60–I69) Pneumonia (J12–J18) Septicemia (A40–A41) Liver cancer (C22) Other urinary disease Biliary tract/gall bladder cancer (C23–C24) Suicide (X60–X84) Other digestive disease Perinatal conditions (P00–P96)
0.0 0.1 0.2 0.3 0.4 Life expectancy (yr)
A
106.4% of the total LE gap in women. The cause of death that contributed most to the LE gap was other cardiovascular dis-eases in both men and women. However, differences were found between men and women in the ranking of causes of death contributing to the LE gap. In men, chronic lower respi-ratory disease (J40–J47) and liver disease (C22) were relatively important, while dementia (F01–F09, G30) and hypertensive diseases (I10–I13) were among the top causes in women. Lung and bronchus cancer (C33–C34), stomach cancer (C16), and liver cirrhosis (K74) were among the top 15 causes only in men, while other urinary diseases, biliary tract/gall bladder cancer (C23–C24), and perinatal conditions (P00–P96) were among the top 15 causes only in women.
DISCUSSION
The results of this study indicated that LE for the years 2015– 2017 in Busan was shorter compared to Seoul by 2.22 years. The magnitude of this disadvantage in Busan is considerable. Given that a 4.5-year increase in LE was achieved in the 12-year period between 2005 and 2017 among the entire Korean population (Supplementary Table 2, only online), the 2.22-year difference in LE between Seoul and Busan corresponds to roughly a 6-calendar-year difference in LE in Korea. In ad-dition, according to the data from the Korea Statistical Infor-mation Service, a 3.78-year gain in LE would be expected in 2017 if all cancer deaths were eliminated in Korea.28 A 2.22-year gain in LE would be anticipated when deaths from stom-ach cancer, liver cancer, colon cancer, and lung cancer were eliminated from the Korean population in 2017.28
This study also showed that roughly two-thirds of the LE gap between Seoul and Busan was due to excess mortality among elderly people in Busan. The ≥85 age group alone contributed to 20% of the LE gap, while no meaningful contributions were made by the 1–24 age groups. These results highlight the im-portance of excess mortality among the elderly, especially among the oldest age group in Busan. Prior LE decomposition studies in Korea on the increase in LE with time,21 socioeco-nomic inequalities in LE,25 and gender inequality in LE22 showed that major differences in LE were caused by mortality differ-ences among middle-aged adults and the early elderly popu-lation. Contributions of the oldest old were not large in those studies.21,22,25 Several explanations for these discrepancies should be considered. Healthcare services and end-of-life care for the elder population and the oldest old should be exam-ined. Differences in public attitudes toward deaths among the oldest old should also be explored. In addition, the possibility of selective migration prior to death (i.e., moving to Busan at the end of one’s life) and the effect of adverse experiences ac-cumulated throughout the life course29 should be also consid-ered.
The results of our analysis of broad cause-specific
contribu-tions revealed that over 40% of the LE gap between Seoul and Busan was due to excess mortality from cardiovascular diseas-es in Busan, diseas-especially among those aged ≥65 (Supplementary Table 7, only online). Some of this contribution might have been due to higher prevalence rates of unhealthy behaviors in Busan, including current smoking, alcohol consumption, high-risk alcohol use, and not engaging in walking as physical ac-tivity, compared to Seoul.30 Contribution of cardiovascular diseases was more prominent in women. The high level of car-diovascular mortality in Busan compared to other provinces has been suggested to be an explanation of the high overall mortality rate in Busan.5,13 However, no previous study has quantified the extent of contribution of cardiovascular disease to the LE gap between Seoul and Busan. In men, among broad causes, cancers, respiratory diseases, and external causes played an important role in explaining the high mortality rate in Busan.
This study also identified 15 leading specific causes of death that contributed most to the LE difference between Seoul and Busan. These 15 leading causes of death explained nearly all of the LE gap between Seoul and Busan (93.0% in men and 106.4% in women). Our calculation also showed that the 10 leading causes explained 74.6% of the LE gap in men and 90.5% of the LE gap in women, respectively. These results suggest the pos-sibility of reducing the LE gap by addressing excess mortality from each leading cause of death in Busan. In both men and women, other cardiovascular diseases, ischemic heart disease, hypertensive disease, and cerebrovascular accidents were among the 15 leading causes of death contributing to the LE gap, which again highlights the importance of cardiovascular disease in explaining the LE disadvantage in Busan compared with Seoul.5,13 In contrast to the findings in women, in men, chronic lower respiratory disease and liver disease were the second and third causes of death, respectively, and lung and bronchus cancer, stomach cancer, and liver cirrhosis were among the 15 leading causes of death contributing to the LE gap in men. Cigarette smoking,31 alcohol consumption,32
Clo-norchis sinensis infection,33,34 and hepatitis B and C infec-tions35,36 should be considered as explanations for these find-ings among men in Busan.
This study was limited in its ability to provide more direct information on the cause of the LE disadvantage in Busan com-pared to Seoul. However, the results of this age- and cause-spe-cific analysis may guide further explorations of downstream causes (e.g., health-related behaviors, occurrence and treat-ment of chronic diseases, or access to medical treattreat-ment) of the LE disadvantage. In addition, our quantification of the contri-bution of each age group and cause to the LE gap could be an important item to consider in planning strategies to reduce the age- and cause-specific mortality rate in Busan.
be-tween Seoul and Busan was mainly due to excess mortality in the elderly population and from cardiovascular diseases. Those aged ≥65 accounted for two-thirds of the LE gap, while over 40% of the LE gap was due to cardiovascular diseases. The top 15 leading specific causes of deaths explained nearly all of the LE gap between Seoul and Busan. Information on age- and cause-specific contributions to the LE difference be-tween Seoul and Busan may guide health policy-makers in planning strategies to reduce the gap in LE. This study shows that the mortality disparity between Busan (second largest metropolitan city in Korea) and Seoul (capital city) exist in al-most all age groups. Typically, regional health disparities have tended to be explained in the frame of the gap between urban and rural areas. However, especially in the Korean context, the gap between capital and non-capital regions is also important as well as between urban and rural areas.
ACKNOWLEDGEMENTS
This research was supported by a grant of the Korea Health Technology R&D Project through the Korea Health Industry De-velopment Institute (KHIDI), funded by the Ministry of Health & Welfare, Republic of Korea (grant number: HI18C0446).
AUTHOR CONTRIBUTIONS
Conceptualization: Khang YH. Data curation: Bahk J. Formal analy-sis: Bahk J. Writing—original draft: Khang YH. Writing—review & ed-iting: Khang YH and Bahk J.
ORCID iDs
Young-Ho Khang https://orcid.org/0000-0002-9585-8266 Jinwook Bahk https://orcid.org/0000-0002-7715-9955
REFERENCES
1. Duncan DT, Kawachi I. Neighborhoods and Health. 2nd ed. Ox-ford: Oxford University Press; 2018.
2. Lim S, Jang HC, Lee HK, Kimm KC, Park C, Cho NH. A rural-urban comparison of the characteristics of the metabolic syndrome by gender in Korea: the Korean Health and Genome Study (KHGS). J Endocrinol Invest 2006;29:313-9.
3. Bahk J, Khang YH. Trends in childhood obesity and central adi-posity between 1998-2001 and 2010-2012 according to household income and urbanity in Korea. BMC Public Health 2016;16:18. 4. Lee J, Lee WY, Noh M, Khang YH. Does a geographical context of
deprivation affect differences in injury mortality? A multilevel analysis in South Korean adults residing in metropolitan cities. J Epidemiol Community Health 2014;68:457-65.
5. Choi MH, Cheong KS, Cho BM, Hwang IK, Kim CH, Kim MH, et al. Deprivation and mortality at the town level in Busan, Korea: an ecological study. J Prev Med Public Health 2011;44:242-8. 6. Kim IK. Socioeconomic Concentration in the Seoul metropolitan
area and its implications in the urbanization process of Korea. Ko-rean J Sociol 2010;44:111-28.
7. Lee SW, Park K, Kang HS, Ryu JS, Shin H, Kim JC, et al.
Develop-ment gap between the capital regions and the non-capital region in Korea. 1st ed. Seoul: Hanul Academy; 2002.
8. Kim JH, Kim SY, Yun SJ, Chung JI, Choi H, Yu HS, et al. Medical travel among non-Seoul residents to seek prostate cancer treat-ment in medical facilities of Seoul. Cancer Res Treat 2019;51:53-64. 9. Korean Statistical Information Service (KOSIS). Provincial indica-tors [Internet]. Daejeon: KOSIS; c2018 [accessed on 2018 Decem-ber 10]. Available at: http://kosis.kr/visual/eRegionJipyo/index/ index.do.
10. Byun YC, Lee SK, Park SJ, Lee MK. Regional differences in health expectancy in Korea and policy suggestions. Seoul: Korea Insti-tute for Health and Social Affairs; 2011.
11. Korean Statistical Information Service (KOSIS). Life expectancy 17 provinces in Korea [Internet]. Daejeon: KOSIS; c2018 [accessed on 2018 December 10]. Available at: http://kosis.kr/statisticsList/ statisticsListIndex.do?menuId=M_01_01&vwcd=MT_ZTITLE&p armTabId=M_01_01#SelectStatsBoxDiv.
12. Kang DS. Which city has the lowest life expectancy in Korea? No-cut News. 2010 October 14. [accessed on 2018 December 11]. Available at: http://www.nocutnews.co.kr/news/763098. 13. Kim JW. Life expectancy in Busan of 78.8 years: the lowest level in
Korea. Busan-ilbo. 2009 December 10. [accessed on 2018 Decem-ber 11]. Available at: http://news20.busan.com/controller/news-Controller.jsp?newsId=20091210000114.
14. Kim JW. Life expectancy in Busan of 80.2 years. The lowest level in Korea. Busan-ilbo. 2012 December 5. [accessed on 2018 Decem-ber 11]. Available at: http://news20.busan.com/controller/news-Controller.jsp?newsId=20121205000126.
15. Choi SH. Life expectancy in Busan of 81.6 years: 6th in 7 metro-politan cities in Korea. Kookje Sinmun. 2015 December 3. [ac-cessed on 2018 December 11]. Available at: http://www.kookje. co.kr/news2011/asp/newsbody.asp?code=0300&key=20151203. 99002132513.
16. Gil JS. Longer illness and shorter life expectancy in Busan and Gyeongnam. KNN. 2018 October 12. [accessed on 2018 Decem-ber 11]. Available at: http://www.knn.co.kr/176071.
17. Kim KH. Busan with the worst health status. Let’s change public healthcare in Busan. Busan-ilbo. 2013 December 4. [accessed on 2018 December 28]. Available at: http://www.journalist.or.kr/news/ article.html?no=32394.
18. Arriaga EE. Measuring and explaining the change in life expectan-cies. Demography 1984;21:83-96.
19. Auger N, Feuillet P, Martel S, Lo E, Barry AD, Harper S. Mortality in-equality in populations with equal life expectancy: Arriaga's de-composition method in SAS, Stata, and Excel. Ann Epidemiol 2014; 24:575-80.
20. Ponnapalli KM. A comparison of different methods for decompo-sition of changes in expectation of life at birth and differentials in life expectancy at birth. Demogr Res 2005;12:141-72.
21. Yang S, Khang YH, Harper S, Davey Smith G, Leon DA, Lynch J. Understanding the rapid increase in life expectancy in South Ko-rea. Am J Public Health 2010;100:896-903.
22. Yang S, Khang YH, Chun H, Harper S, Lynch J. The changing gen-der differences in life expectancy in Korea 1970-2005. Soc Sci Med 2012;75:1280-7.
23. Jung-Choi K, Khang YH, Cho HJ, Yun SC. Decomposition of edu-cational differences in life expectancy by age and causes of death among South Korean adults. BMC Public Health 2014;14:560. 24. Khang YH, Yang S, Cho HJ, Jung-Choi K, Yun SC. Decomposition
of socio-economic differences in life expectancy at birth by age and cause of death among 4 million South Korean public servants and their dependents. Int J Epidemiol 2010;39:1656-66.
contribu-tions to income difference in life expectancy at birth: findings from nationally representative data on one million South Koreans. Eur J Public Health 2016;26:242-8.
26. Bahk J, Ezzati M, Khang YH. The life expectancy gap between North and South Korea from 1993 to 2008. Eur J Public Health 2018;28: 830-5.
27. Khang YH, Yun SC, Bahk J, Kang HY, Kim I, Seo S, et al. Developing indicators for evaluating and monitoring the health plan 2020 us-ing the National Health Information Database of the National Health Insurance Service in Korea [Internet]. Wonju: National Health Insurance Service; c2017 [accessed on 2018 December 10]. Avail-able at: http://www.nhis.or.kr/bbs7/boards/B0069/22655?boardKe y=39&boardName=B0069.
28. Korean Statistical Information Service (KOSIS). Gains in life ex-pectancy after eliminating causes of death [Internet]. Daejeon: KOSIS; c2018 [accessed on 2018 December 10]. Available at: http:// kosis.kr/statisticsList/statisticsListIndex.do?menuId= M_01_01& vwcd=MT_ZTITLE&parmTabId=M_01_01#SelectStatsBoxDiv. 29. Karanikolos M, Leon DA, Smith PC, McKee M. Minding the gap:
changes in life expectancy in the Baltic States compared with Fin-land. J Epidemiol Community Health 2012;66:1043-9.
30. Kang YW, Ko YS, Kim KY, Sung C, Lee DH, Jeong E. Trends in
health-related behaviors of Korean adults: study based on data from the 2008-2014 Community Health Surveys. Epidemiol Health 2015;37:e2015042.
31. Jee SH, Samet JM, Ohrr H, Kim JH, Kim IS. Smoking and cancer risk in Korean men and women. Cancer Causes Control 2004;15:341-8. 32. Jee SH, Ohrr H, Sull JW, Samet JM. Cigarette smoking, alcohol
drinking, hepatitis B, and risk for hepatocellular carcinoma in Ko-rea. J Natl Cancer Inst 2004;96:1851-6.
33. Song SB. Epidemiological studies of Clonorchis sinensis in lower area of Nag Dong river nearby Busan City in Korea. Korean J Para-sitol 1982;20:133-41.
34. Kim BJ, Ock MS, Kim IS, Yeo UB. Infection status of Clonorchis si-nensis in residents of Hamyang-gun, Gyeongsangnam-do, Korea. Korean J Parasitol 2002;40:191-3.
35. Ju YH, Shin HR, Oh JK, Kim DI, Lee DH, Kim BK, et al. A seroepide-miological study of hepatitis B and C virus (HBV and HCV) infec-tions in the young population in parts of Busan, Korea. J Prev Med Public Health 2004;37:253-9.