©IJRASET: All Rights are Reserved
855
Analysis of Bulk Data from Social Media for
Obtaining Public Sentiments
Vaibhav Sharma1, Syed Adeel Ahmad2, Shubham Gupta3, Navin Kumar Trivedi4, Shashi Kant Mourya5
1,2,3,4,5
Computer Science Department, MGMCoET
Abstract— For every production house, getting an idea of how their movies are going to perform before release can be essential. A decade ago this would have been a very difficult task but now, the arrival social media has made it way easier. There are millions of opinions on almost every movie which is announced, about to release or has already been released on sites like Twitter, Facebook, Google+ and more. In our project, we analysed these opinions or microblogs to figure out the public sentiment towards several movies in their three stages i.e. three weeks before, release week and two weeks after the release day. We believe that data collected before release can successfully predict if the movie will compensate its cost of making or not. Our results are displayed in the form of graphs that we plotted for one such movie and they show how influential social media can be in the success or failure of any movie. By using social media, a production house can save a lot of money by decreasing the marketing budget if the analysis states that the public anticipation is dull. However, if the anticipation is positive, they can increase the marketing budget to make their product even more recognizable. Our research doesn’t just apply to the movie business, but to any other form of product that relies on word of mouth and social media presence to be successful. Our analysis states that if the social media presence is strong, the chances of success of the product can increase exponentially.
Keywords— Sentiment Analysis, social media, prediction, noise reduction, user-generated contents, opinion mining, Twitter,
movies, box office, digital marketing, sentiment gathering, data analysis, R, wordcloud.
I. INTRODUCTION
These days, social media is an integral part of the lives of around 40% [1] of the world population. Websites like Twitter and Facebook had around 305 million [2] and 1.59 billion [3] monthly active users (MAU) in the last quarter of 2015. This number is increasing as a result of which more information about people, their lifestyle and opinion is available. Since the success or failure of a movie, apart from the art involved, depends largely on its stature in the public eye, getting an insight in the peoples’ mind is nothing less than a boon. This information can be efficiently used to predict the earning of a movie, if not exactly, in close approximation to the real value. So far, Twitter has attracted the attention of most data scientists looking for opinion mining because of its microblogging format. Its character limit is enough to express one’s views appropriately. Despite this convenience, we had to face some problem. Data that we extracted from Twitter was unstructured. It was filled with noise which we had to clear out before we could do anything productive. Cleaning the data involved removing hash tags, links, protocols, usernames, useless words and whitespaces. Apart from this, we had to convert to data into organized text form as opposed to random list in which it originally came.
According to Sameer Thigale et. al. [4], social media is pretty accurate in predicting results but less efficient because of critical period approaching. There we went on to create a different model. We divided the analysis into three phases: three weeks before, release week, two weeks after. We analyzed thousands of tweets in each of these stages and organized the result in two different forms: word cloud and bar chart. The rest of the paper is arranged in following way: First, we look what previous researchers have attempted. After which we will discuss how gathered and cleaned data for each movie. Next, we will move to analysis where one of the movies will be discussed in detail. In the end will be conclusion followed by references.
II. PREVIOUSWORKS
Analyzing Twitter data to predict profits gained importance with popularity of Twitter. It has been done on several occasions before, not only for the movies but for elections as well [5]. Other models proposed for box office prediction are by Sameer Thigale et. al.[4], Ya Feng Lu et. al.[6], and Sitaram Asur et. al.[7] in the years 2014, 2013 and 2010 respectively. These models used different prediction techniques involving regression modelling, temporal modelling and sentiment analysis. Their results were interesting and approximate, some better than others. Another research by Felix Ming Fai Wong et. al. [8] claimed that Twitter is not good for predicting box office revenues. Their thesis proposed that reviews on Twitter are biased and are not reflective of the actual public sentiments towards the movies. We will address this in our research and will show how prediction through tweets could be fairly accurate.
©IJRASET: All Rights are Reserved
856
weeks and then match the statistics we obtained prior to release against actual statistics post release.
III.TWITTER
Twitter is suitable for this job because it has millions of users [2] each of whom have hundreds and thousands of tweets. Each tweet is a microblog with words that shows sentiments. We can see that in the movie business, almost everyone has a twitter page: Celebrities, movies and of course audience. Their interactions with one another produces billions of words and with such availability of data, a prediction model can definitely be created. Twitter provides a word limit of 140 characters to each tweet which is enough for expressing emotions toward a topic. People can even share their opinions without writing or typing anything through retweet button. Due to its vast user base has attracted almost all corporations working in all fields to advertise themselves and interact with their customers and followers. It is used as a platform for major announcements such as product launch, movies announcement, successful projects, latest news and more. Therefore, we have chosen as source for our data on public sentiments.
A. Example Of Deadpool
[image:3.612.95.516.389.720.2]Deadpool is a movie that released in February 2016. It had a production cost of 58 million US$ [9], which is quite minimal when compared to several successful blockbusters releasing in the summer season. However, the financial returns on Deadpool far beyond anticipation. It grossed over 750 million US $, with a very modest marketing and production cost. The reason for that is the extremely successful and out of the box marketing of the movie, especially on social media, primarily on Twitter, Facebook, Youtube. The fans were extremely excited by the prospects of a Deadpool movie, which is based on a unique comic book character, however fans only constitute of a fraction of the movie audience, and the rest of the movie going audience needs to be excited to see the movie as well. The lead star of the film, Ryan Reynolds made the movie recognizable to the general audience and continuously updated fans about the filming and developments of the movie. The trailers and posters and overall marketing overall marketing was extremely over-the-top and hilarious, something that the audience could relate with and thus, the returns were extremely high.
TABLE I:
RETURN ON INVESTMENT OF SEVERAL RECENT SUCCESSFUL MOVIES [10]
Movie Production Cost US Domestic Gross Return on Investment
Deadpool 58 359 618.96%
Minions 74 336 454.05%
Jurassic World 150 652 434.66%
Star Wars: The Force Awakens 245 935 381.63
Avatar 237 749 316.03%
Titanic 200 600 300.39%
Spider-Man 139 409 294.24%
Marvel’s The Avengers 220 623 283.18%
Frozen 150 400 266.67%
Iron Man 140 318 227.14%
X-Men 75 157 209.33%
Iron Man 3 200 409 204.50%
Guardians of the Galaxy 170 333 195.88%
X2: X-Men United 110 215 195.45%
Spider-Man 2 200 374 187.00%
Avengers: Age of Ultro 250 459 183.60%
Furious 7 353 190 184.78%
Iron Man 2 200 312 156.00%
Captain America: The Winter Soldier 170 260 152.94%
Ant-Man 130 180 138.46%
Spider-Man 3 258 337 130.62%
Captain America: The First Avenger 140 176 125.71%
Thor: The Dark World 170 206 121.18%
©IJRASET: All Rights are Reserved
857
X-Men Origins: Wolverine 150 180 120.00%
X-Men: Days of Future Past 200 234 117.00%
The Amazing Spider-Man 230 262 113.91%
X-Men: The Last Stand 210 234 111.43%
The Wolverine 120 132 110.00%
X-Men: First Class 160 146 91.25%
The Incredible Hulk 150 134 89.33%
The Amazing Spider-Man 2 255 202 79.22%
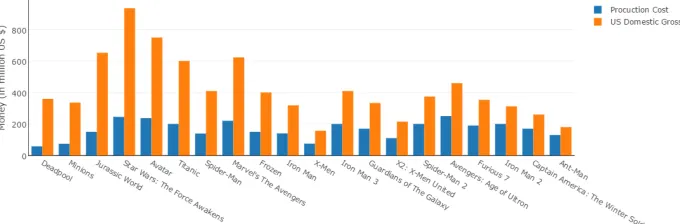
[image:4.612.128.477.237.348.2]To get a better sense of what we are talking about, we have presented the above data graphically. Plotly [15] has been used to create these illustrations.
Fig 1: The above diagram showcases the ratio of financial returns of some of the recent successful movies with respect to its production budget.
[image:4.612.139.479.488.600.2]The above figure clearly shows that Deadpool that return on investment of Deadpool at the US domestic box office is higher than any other movie out there. This further reinforces our point that the social media campaign of Deadpool made it one of the most highly profitable movies we know today. When compared to the highest grossing movies likes Avatar and The Avengers, which went on to make 2.7 billion and 1.5 billion US $ respectively, Deadpool still fares better due to its modest budget, marketing and well-chosen release date.
Fig 2: The above bar-chart shows the comparison of the production cost and the US domestic gross for some recent successful movies
The above chart clearly shows that despite not having the lowest budget of all the movies in the list, its returns can be easily compared with tent pole projects with 150 million US $ or more of investment in the making. Even after having such significantly high budgets, these returns on these films don’t even come anywhere close to Deadpool.
IV.DATASET
©IJRASET: All Rights are Reserved
858
query for the being more specific about what we needed. For example, we mentioned the topic, number of tweets and time period from which the data was required. Once we received the data, we had process to convert into useful form. This included removing redundant words, internet protocols, shortened link descriptions, numbers, English language articles, hash tags, @ symbols and other noises. This process was repeated every day for five weeks. The processed data was being accumulated for further use which included world cloud and sentiment analysis.
A. Word Cloud
A word cloud as seen above is representation of most used words in the tweets. The colour and size of the words is in respect to its frequency in the tweets. It enhances the process of analysis and provides ease to developers in figuring out the public sentiments.
B. Sentiment Analysis Bar Chart
A bar-chart was created to show the discordance of the positive and negative opinions on the social media.
V. METHODOLOGY
Our approach for opinion mining will be mostly based on positive or negative words in the tweets. We have used a tool called RStudio for doing our analysis. RStudio [11] is a free and open-source integrated development environment (IDE) for R. It includes a console, syntax-highlighting editor that supports direct code execution, as well as tools for plotting, history, debugging and workspace management. Now, we understand that sometimes negative words in a sentence could lead to a positive context like ‘hard to resist’ but it is important to note that in combining millions of tweets together, these occurrences will be minimal and can hence be neglected. These occurrences can be easily tackled by adding such phrases in the positive or negative word list, so that R clearly filters these tricky situations. We are also taking into account some other factors which, we believe, will have a huge impact on generating revenue at the box office. They are:
Movie Cast i.e. the actors involved
Movies fan base i.e. its popularity among the masses (mostly in case of franchise) Competition i.e. what other movies are releasing with it.
Critic Reviews
These are essential to the analysis because of the huge impact they have on viewers’ psyche. Without them, the output statistics can be highly variant.
VI.CASESTUDY
[image:5.612.246.413.538.687.2]Batman v Superman is one of the highly anticipated movies of 2016, which released on March 25th. Throughout the year leading up its debut, “Batman v Superman” was tweeted, blogged, or shared about over 180 million times on Facebook, Twitter, Instagram, Tumblr, Google+ and Wikipedia, according to social media tracking service ListenFirst Media [14]. Among 2015 and 2016 releases, that only trails “Avengers: Age of Ultron” (232 million) and “Star Wars: The Force Awakens” (273 million). We had been tracking the tweets related to it for two weeks. Three days before release, we accumulated some of the recent tweets and formed a word cloud (Fig. 1). This word cloud showed some of the words that were associated with the movie. Some of the words clearly specify the popular opinion of that particular time.
©IJRASET: All Rights are Reserved
859
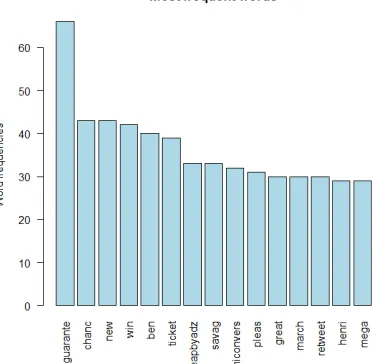
Based on these tweets, we also plotted a customized bar chart (Fig. 4) to see how the frequency of words are matched against each other.
Fig. 4 Bar chart showing words from the tweets on the X axis and their respective frequencies on the Y axis.
Since it was a highly anticipated movie with popular cast, the results were as we expected i.e. the positive words for the movie were way more than the negative words. Through these results, we concluded that the movie is easily going to cover its production cost. So we went ahead to calculate the sentiment score. We matched the words we obtained after processing the tweets against the predefined word banks of positive and negative words [12]. Here, each match for every word of individual tweets is given the value 1. Then all the positive 1’s and negative 1’s are added separately. Once we have the sums we apply following formula and determine analysis score on that basis:
Score= sum(pos.matches) – sum(neg.matches) Where, Score = average sentiment
sum(pos.matches) = sum of all the hits while matching positive word bank against a tweet sum(neg.matches) = sum of all the hits while matching negative word bank against a tweet
After Score is calculated, sentiment is defined as neutral, positive, and negative according to value of Score as zero, positive, and negative respectively.
This is the Breen’s approach of analysing sentiment [13].
[image:6.612.222.409.112.294.2]After this, we plotted the frequency vs analysis score on a graph to show the result. It is shown in Fig. 5 below
©IJRASET: All Rights are Reserved
860
The previous figure clearly illustrates that the positive keywords easily outweigh the negative keywords. The scores can be made far more accurate by putting more keywords in the positive and negative words list. Since we have already established that we did opinion mining for a few movies over a period of several weeks. Let’s go back to Batman v Superman. The thing that makes it interesting is that people have been anticipating this movie for a relatively long time and it’s been on and off development for somewhere near a decade. Naturally, when this project was announced, people got excited for it.
When we performed opinion mining for the movie, a few weeks before its release date, right after is final trailer dropped, there was a massive flux of positive reaction on social media. This was manifested in our findings showcased in the form of the bar-chart from Fig. 5
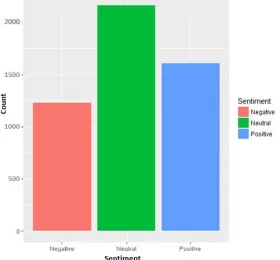
[image:7.612.236.376.259.389.2]However, one week after the release of the movie, when the critic reviews had already dropped, the trends regarding the movie started to change. We saw that some of the critic reviews and the opinions of the people who had already seen the movie started to sway the popular sentiment which we had seen before the release of the film. This sentiment was again reflected by doing sentiment analysis after its first week run. Consequently, these critic reviews and public opinions hurt the movie, and it suffered a 68% drop in its second weekend gross, which is one of the highest for any movie out there, despite having negligible competition. The following bar-chart shows the sentiment for the movie after its first week.
Fig. 6 Bar-chart showing the sentiment of Batman v Superman post release
We see that the opinion is fairly mixed, while some people really love the movie, many others deeply loathe. A significant number of the users have chosen to take the middle ground.
So, by doing a case study of Batman v Superman we saw that social media can be imperative in revealing the sentiment a film. It can also be used as a tool to see how long a movie can last at the box office and the loss it may suffer in the consecutive weeks after its release. Also, the online reviews have a huge play in swaying the popular opinion, which can consequently affect the box office collections in a positive or negative manner.
VII. CONCLUSIONS
We have barely scratched the surface, but our work leads us to believe that social media is an untapped potential for movie studios to gather a somewhat accurate sentiment of a movie. Not just a movie, sentiment analysis can be used for any other product, be it a new mobile application, an experimental software, some new gadget, a new flavor of a soft drink and so much more. With our work, we were able to correspond the social media trend of the film with the box office collections. We saw that the increasing negative sentiment for a movie correlates with the drop in its revenue after its first week of release. However, there can be other movies that have a strong social media presence before its release that is further enhanced by the positive initial reviews by the critics as well as the audience, which can easily make its return on investment ratio quite high. Our findings make it clear that social media sites like Twitter, Facebook, Reddit can be an indispensable instrument for collecting authentic and unambiguous sentiment towards a product, which can have widespread applications.
VIII. ACKNOWLEDGMENT
The authors would like to thank Mr. Navin Kumr Trivedi and Mr. Shashi Kant Mourya for providing their support and help during the research work. The authors would also be grateful to the reviewers for their valuable comments and suggestions in order to improve the quality of the paper.
REFERENCES
[1] (2016) Internet Live Stats website. [Online]. Available: http://www.internetlivestats.com/internet-users/
©IJRASET: All Rights are Reserved
861
[3] (2016) Statista website. [Online]. Available: http://www.statista.com/statistics/282087/number-of-monthly-active-twitter-users/
[4] Sameer Thigale, Tushar Prasad, Ustat Prasad Makhija, and Vibha Ravichandran, “Prediction of Box Office Success of Movies Using Hype Analysis of
Twitter Data,” International Journal of Inventive Engineering and Sciences (IJIES)., ISSN: 2319–9598, Volume-3 Issue-1, December 2014.
[5] Lei Shi, Neeraj Agarwal, Ankur Agrwal, Rahul Garg, and Jacob Spoelstra (2012), “Predicting US Primary elections with Twitter”. Stanford Network Analysis Project Website. [Online]. Available: http://snap.stanford.edu/social2012/papers/shi.pdf
[6] Yafeng Lu, Feng Wang, and Ross Maciejewski, “Business Intelligence from Social Media: A Study from the VAST Box Office Challenge, IEEE Computer Graphics and Applications (Volume:34 , Issue: 5), 23rd
May, 2014
[7] Sitaram Asur, and Bernardo A. Huberman (2010), “Predicting the Future with Social Media.” HP Labs website. [Online]. Available:
http://www.hpl.hp.com/research/scl/papers/socialmedia/socialmedia.pdf
[8] Felix Ming Fai Wong, Soumya Sen, and Mung Chiang, “Why Watching Movie Tweets Won’t Tell the Whole Story?,” arXiv:1203.4642v1 [cs.SI], 21st
March, 2012.
[9] (2016) Box Office Mojo website. [Online]. Available: http://www.boxofficemojo.com/movies/?id=deadpool2016.htm
[10] (2016) Box Office Mojo website. [Online]. Available: http://www.boxofficemojo.com/alltime/world/
[11] (2016) R Studio website. [Online]. Available: https://www.rstudio.com/products/rstudio/
[12] Bing Liu, Minqing Hu and Junsheng Cheng. "Opinion Observer: Analyzing and Comparing Opinions on the Web." Proceedings of the 14th International World Wide Web conference (WWW-2005), May 10-14, 2005, Chiba, Japan
[13] Jeffrey Breen, “Things I tend to forget,” jeffreybreen.wordpress.com, 4th
July, 2011. Wordpress website. [Online]. Available: https://jeffreybreen.wordpress.com/2011/07/04/twitter-text-mining-r-slides/
[14] (2016) Variety website. [Online]. Available: http://variety.com/2016/film/box-office/batman-v-superman-box-office-digital-tracking-1201739710/
![TABLE I: RETURN ON INVESTMENT OF SEVERAL RECENT SUCCESSFUL MOVIES [10]](https://thumb-us.123doks.com/thumbv2/123dok_us/8580394.860705/3.612.95.516.389.720/table-i-return-investment-recent-successful-movies.webp)