Gilkes, Oliver S. and Mishra, Rakesh
Comparison of passive and active methods for improving transient performance of turbocharged
engine systems
Original Citation
Gilkes, Oliver S. and Mishra, Rakesh (2006) Comparison of passive and active methods for
improving transient performance of turbocharged engine systems. In: Proceedings of Computing
and Engineering Annual Researchers' Conference 2006: CEARC’06. University of Huddersfield,
Huddersfield, pp. 16.
This version is available at http://eprints.hud.ac.uk/id/eprint/3799/
The University Repository is a digital collection of the research output of the
University, available on Open Access. Copyright and Moral Rights for the items
on this site are retained by the individual author and/or other copyright owners.
Users may access full items free of charge; copies of full text items generally
can be reproduced, displayed or performed and given to third parties in any
format or medium for personal research or study, educational or notforprofit
purposes without prior permission or charge, provided:
•
The authors, title and full bibliographic details is credited in any copy;
•
A hyperlink and/or URL is included for the original metadata page; and
•
The content is not changed in any way.
For more information, including our policy and submission procedure, please
contact the Repository Team at: [email protected].
COMPARISON OF PASSIVE AND ACTIVE METHODS OF
IMPROVING TRANSIENT PERFORMANCE OF TURBOCHARGED
ENGINE SYSTEMS
O. Gilkes1 and R. Mishra1
1 University of Huddersfield, Queensgate, Huddersfield HD1 3DH, UK
ABSTRACT
The drive to reduce engine emissions has placed an emphasis upon turbocharging especially with the trend of engine downsizing (C. Macrae, (2006), A. Lefebvre et al. (2005)). Turbocharged vehicles exhibit a weak point of poor drivability under transient running conditions. Previous work byY. Matsura et al (1992), has reviewed various methods of improving the transient engine performance. This paper compares the passive method of reducing the inertia of the compressor wheel and the active method of injecting air into the inlet manifold. The work has shown that both these methods improve the transient response of the turbocharger. The effect of the active system is shown to be greater than that of the passive method.
Keywords Turbocharged, Transient, Inertia, Air-Injection
1 INTRODUCTION
One of the most important challenges facing the modern engine development engineers is to improve vehicle economy and reduce the levels of green house gas emissions. Car manufactures are keen to improve in both these areas. In Europe through the ACEA agreement (A. Sauer et al (2005)) manufactures agreed to meet a new vehicle fleet average CO2 emissions level of 140g/km. Also targets that have been set by the European Union, Euro V which automotive manufacturers need to achieve by 2008 (Euractiv, (2006)) and soon after that Euro VI will be implemented further restricting the outputs of harmful emissions, European Federation of Transport and the Environment.
A method of improving the efficiency and in doing so reducing the harmful emissions of an Internal Combustion (IC) engines is to use a turbocharger. A turbocharger utilises energy from the exhaust gases and uses it to pressurise the inlet to the cylinders. This allows for the density of air in the cylinder to be greater than ambient. Allowing for the fuel to be burnt more efficiently and so reduce the harmful emissions of an engine.
Turbocharged vehicles exhibit a weak point of poor drivability under transient running conditions. The phenomenon known as “Turbo-lag” is particularly apparent in conditions where a sudden load change is applied at low engine speeds with rapid acceleration (i.e. standing start or acceleration-gear change in low revs). Quick changes in rack position/accelerator pedal do not result in instantaneous response of the turbocharger and consequently vehicle acceleration. This delay has the side effect of increased harmful emissions and engine efficiency deterioration. Reduced air flow in the combustion chamber while fuel is injected causes inadequate air fuel ratio (i.e. rich mixture). This results in an increased formation of emissions such as CO2 and NOx which contribute to environmental pollution. At low engine speeds there is a further operational complication due to the possibility of compressor going into the surge region, resulting in instability leading to engine failure.
This paper investigates two methods of reducing the turbo-lag using computer simulation. The first method simulated was to reduce the inertia of the turbine and compressor. The second method was the active method of injecting air into the inlet manifold of the engine.
2 ENGINE MODEL
The model has been developed within the computer software Ricardo WAVE. The WAVE software breaks down the modelling process into different sections, in cylinder analysis, manifold flow analysis and turbocharger. The diesel engine modelled is described in Table 1. The engine has a radial turbine and centrifugal compressor. The model includes Intake manifold system and complex silencer system.
The two main engine models used are mean value and cylinder by cylinder. Work (J. Karlsson et al. (1999)) has shown that for this particular application a “Cylinder by Cylinder” model, where each cylinder is modelled individually, would generate superior results over model types such as “Mean Value Models”. In mean value models the engine system is modelled as a whole and it does not provide the information on the pressure pulses generated by multi cylinder engines. For this application it is important to model the cylinders separately because it is necessary to accurately predict pressure output of the engine because it is directly affected by the response of the turbocharging system. Within the WAVE model each cylinder is modelled as part of the engine, shown as the orange circular symbols on Figure 2. The combustion and heat transfer are defined within this section of the model.
This model uses the Diesel Wiebe Function based for heat release as shown in Figure 1. This is the most appropriate heat release model as actual heat release profiles were not available. The burn duration over the engine speed range is adjusted using the model parameters. In this model heat transfer is calculated using the Woschni correlative model for convective heat transfer. This model assumes simple heat transfer from a confined volume surrounded on all sides by walls representing the cylinder head, cylinder liner, and piston face areas exposed to the combustion chamber. The Woschni model is based on Equation 1 (Ricardo Wave Knowledge Centre).
The manifolds have been modelled using ambients, ducts, orifices and junctions (shown as blue clouds, black lines, green blocks and blue blocks on Figure 2) one dimension fluid flow tools within the WAVE software package. Each different part of the manifold calculates the pressure and temperature through each section. The air injection system has also utilised the 1D modelling capability. To model the air injection system within Ricardo Wave a third ambient was used. This ambient was set to the required pressure for the simulation that was being undertaken. The air was directed into the inlet manifold very close to the cylinder.
To model the effects of the Turbocharger a map based simulation was developed using the compressor and turbine tools in the Ricardo WAVE package shown in Figure 2 as grey trapezoids. The maps are created by steady state operation condition as the data for a transient compressor map are not available. The steady state maps are considered to be adequate for the modelling as shown by previous studies (A. Lefebvre et al (2005)).
3 SIMULATION
STRATERGY
injected for the entire time of the transient period, similar to previous work experimental work carried out (C. Lee (2002)).
This transient model was then also used to simulate the effect that a change in inertia had upon the performance of the engine. This was done using different several different inertia values found as a percentage from the original compressor modelled. The values ranged from 1e-5kgm2 and increase in inertia of 10% to a decrease of 25%.
To asses the effect the changes that the air injection system and the reduction in compressor inertia had on the turbocharger system, pressure readings at the compressor outlet were taken. The reduction in the time taken for similar pressure increase is taken as an indicator of transient performance.
4 RESULTS
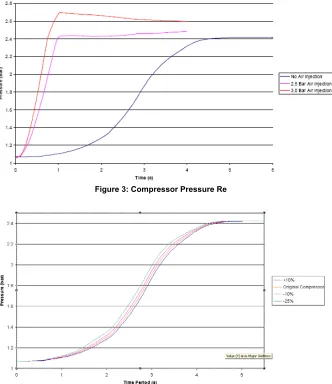
Figure 3 shows the pressure response of the compressor outlet with respect to time. The results show an initial delay in response before rapidly increasing to an almost steady state. The results show that when the air injection system is used the time taken for the system to reach a steady state is significantly reduced. This means that the air pressure going into the cylinders is higher at an earlier stage of the process which would ensure near ideal air/fuel ratio. The results followed the trend shown in other similar experimental work (C. Lee (2002)).
Figure 4 shows the pressure response of the various turbochargers with different inertia values. The results show that reducing the inertia of the system reduces the delay in the response of the turbocharger to the demand. The reduction in delay is however seen to be very small..
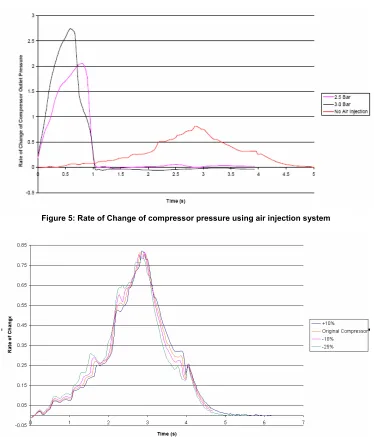
To obtain quantitative estimates rate of change of pressure has been plotted against time as shown in Figure 5 which shows the rate of change of the pressure response for the compressor outlet. The rate of change of pressure is shown to be much greater. It can be further seen that turbocharger reaches steady state much faster when air injection is used. The 3 bar air injection reduces the response time by three seconds. The rate of change for the change in inertia, Figure 6, shows only a small improvement when the inertia is reduced.
The above discussion indicates that both passive and active methods can be used to reduce turbo-lag, however, in reality reductions in the inertia of the system are very difficult to achieve. This can be achieved by using new materials and newer design methods. The active methods on the other hand bring additional complexity in terms of design of reliable systems which can be easily bolted on to the turbocharged engine systems. It is therefore important to carry on further research in both the methods although active methods look more promising. This paper has also highlighted the importance of using computer simulation in engine development. The work carried out in this paper would have been highly expensive to carry out if done experimentally.
5 CONCLUSIONS
This paper shows the modelling technique and the initial results of a transient turbocharged engine system. The initial results show that both active and passive methods have considerable promise in improving turbo-lag in IC engines. The main conclusions from this study are as given below.
1. Engine model developed for transient response simulation
2. Reduction in turbocharger system inertia improves transient Response
3. Air injection vastly improves transient response
4. Passive method provides reduction in turbo-lag, however, the active system yields far superior results
REFERENCES
C. MACRAE, (2006) Engine Expo Stuttgart
http://www.engine-expo.com/06engine_conf/pres/day_2/macrae.pdf
A. LEFEBVRE, S. GUILAIN, (2005) Modelling and Measurement of the Transient Response of a
Turbocharged SI Engine, SAE paper 2005-01-0691
C. LEE, N. CHOI, (2002) Effect of air injection on the characteristics of transient response in a turbocharged diesel engine, Int. J. Therm. Sci. 41, 63-71
W. KRIEGER, W. CARTELLIERI, (1991) Optimization of load response of a low emission heavy-duty diesel engine, Autotech Birmigham AVL LIST Gmbh, Austria
AMANDA SAUER, PHILIPP METTLER, FRED WELLINGTON, GABRIELA GRAB HARTMANN, (2005) World Resource Institute, Research Report: Transparency Issues with ACEA Agreement: Are investors driving blindly? http://climate.wri.org/aceatransparency-pub-4023.html
Euractiv, (2006) EU news and policy positions
http://www.euractiv.com/en/transport/euro-5-emissions-standards-cars/article-133325
European Federation of Transport and the Environment
http://www.transportenvironment.org/docs/Factsheets/2004/EURO5andEURO6Briefing.pdf
J.GALINDO, J.M. LUJAN, J.R. SERRANO, V. DOLZ, S. GUILAIN, (2004) Design of an exhaust manifold to improve transient performance of a high-speed turbocharged diesel engine, Experimental Thermal and Fluid Science, Vol.28, pages 863-875
Y. MATSURA, N. NAKAZAWA, Y. KOBAYASHI, H. OGITA, T. KAWATANI, (1992) Effects of Various Methods for Improving Vehicle Startability and Transient Response of Turbocharged Diesel Trucks, SAE Paper 920044
J. KARLSSON, J. FREDRIKSSON, (1999) Cylinder-by-Cylinder Engine Models Vs Mean Value Engine Models for Use in Powertrain Control Applications, SAE papper 1999-01-0906
Ricardo WAVE knowledge centre help files, Diesel: Combustion Data
JOHN B. HEYWOOD, (1988) Internal Combustion Engine Fundamentals, McGraw-Hill, Pg 506 fig10-9
Ricardo WAVE Knowledge centre help files, Engine Manual, Formulation and Basic Elements, 2.1.5 Heat Transfer
Figure 2: WAVE model with air injection system
Figure 3: Compressor Pressure Re
Engine Type 4 Stroke Diesel
Bore 78.1mm Stroke 82.0mm Number of Cylinders 4
[image:7.595.126.500.187.624.2]Combustion System Direct Injection Compression Ratio 22.0
Table 1: Engine Description
Figure 5: Rate of Change of compressor pressure using air injection system