2017 2nd International Conference on Artificial Intelligence: Techniques and Applications (AITA 2017) ISBN: 978-1-60595-491-2
Research on Abnormal Power Consumption Model Based on User
Multidimensional Compound Features
Qiu XIONG
1, Jin-peng CHEN
1, Guo-shi WU
1and An-gang ZHENG
2 1Beijing University of Posts and Telecommunications, Beijing, China2
China Electric Power Research Institute, Beijing, China
Keywords: SVM, LOF, Pearson correlation coefficient, Logistic regression, Abnormal electricity identification.
Abstract. Power loss is a serious problem for all power companies. To find effective means of abnormal electricity iidentification is a popular research field in recent years. This paper puts forward an anomalous electricity use model based on multi-dimensional compound features of electricity users. The support vector machine, local outlier factor, correlation measurement based on the similar user power load, and correlation change rate measurement based on the most relevant users—these four algorithms are adopted to extract four-dimensional compound features of anomalous electricity use from the perspective of global anomaly, local anomaly, regional space, and time sequence. Next, the logistic regression (LR) model is trained based on the compound features. After training, the LR model is adopted as the final anomalous electricity use identification model. Analysis of the practical power load data of users suggests that the LR model combine respective advantages of the four-dimensional compound features. Detection of anomalies using the LR model is an effective approach, which can reliably and accurately identify residents’ anomalous electricity use. From the accuracy rate, recall rate, precision rate and scores of F1, it can be seen that the LR model is significantly superior to SVM.
Introduction
Nowadays, with the development in economy and electricity using, the electricity power system gets a leap development. However, the electricity power loss becomes a serious problem since it directly affects companies’ profit and development. For this reason, techniques based on data mining theories to detect abnormal electricity using and electricity fraud have been mentioned in these years. Recently, the way to check Non-Technical Loss can be divided into two categories: Clustering and Classification. In the reference [1], Pearson correlation coefficient, Bayesian network and Decision tree were mentioned to detect electricity stealing; In the reference [2], Fuzzy clustering algorithms was used to cluster residential electricity power using to find abnormal electricity using. Classification is a supervise learning method. Reference [3,4] introduced support vector machine (SVM), and fuzzy inference systems to combine professional knowledge into the model to find abnormal electricity using. Reference [5] using extreme learning machine (ELM) and OS-ELM algorithm to improve the precision of abnormal electricity identification and compared the result with support vector machine. Reference [6] used neural network to classify power load curve.
For analyzing electricity data and power stealing behavior, and improving the precision and accuracy of abnormal detection, an abnormal power using model, which based on multi-dimension was introduced in this paper. It has a higher precision in abnormal electricity identification.
Compound Feature Extraction
Feature for Abnormal Power Consumption Based on SVM
load, yi represents label of abnormal electricity identification. With these notations, an optimization
problem in abnormal electricity using support vector machine can be shown in formula (1):
2 1 2 , , 1 min
. . ( ) 1 , 1, 2, 3, ,
0, 1, 2, 3, ,
N i w b i i i i w C
s t y w x b i N
i N ξ ξ ξ ξ = + ⋅ + ≥ − = ≥ =
∑
(1)Optimizing a support vector machine problem can be solved by its dual problem (2):
1 1 1
1 1
min ( )
2
. . 0
0 , 1, 2, ,
N N N
i j i j i j i
i j i
N
i i i
i
y y x x
s t y
C i N
α α α
α α α = = = = ⋅ − = ≤ ≤ =
∑∑
∑
∑
(2)By introducing kernel function K(xi, xj), nonlinear problems can be transferred to linear problems.
After solving it, optimal solutions a* and b* are also the optimal solutions for the non-linear support vector machine problem. Target function and classification decision function are corresponding to formula (3):
1 1 1
1
( ) ( , )
2
N N N
i j i j i j i
i j i
Wα α α y y K x x α
= = =
=
∑∑
−∑
1 1
( ) ( ) ( ) ( , )
N N
i i i i i i
i i
f x sign a yφ x φx b sign a y K x x b
∗ ∗
∗ ∗ ∗ ∗
= =
= ⋅ + = +
∑
∑
(3)Model C-SVC in package LIBSVM[8] are used to do binary classification, which can get the abnormal electricity identification label for each user and the probability for abnormal electricity using level[9]. The probability calculation function can be shown as formula (4):
,
1 Pr( 1| ) ( )
1 exp( )
A B
y x P f
Af B
= ≈ ≡
+ + (4)
The main idea for this algorithm is to find a sigmoid function, which images the SVM output into range [0, 1]. If the point near to the hyperplane, the probability that this model make a correct prediction is higher; Otherwise, the probability is lower. This probability describes the level of abnormal electricity power using for each user by calculate the distance for each point and the SVM hyperplane from global data.
Local Outlier Factor
Local outlier factor algorithm (LOF) is a kind of unsupervised learning method [10]. The main idea of LOF algorithm is comparing a point’s local density and its adjacent object local density. Local density can be calculated by measuring the distance between a point and all other points. If the density of a certain point is smaller than its adjacent points, then its local outlier factor is higher than normal, which means it could be an outlier with a higher chance; Otherwise, mostly it can be a normal object. The local outlier factor calculation function is shown as formula (5):
( ) ( ) ( ) ( ) ( ) ( ) / ( ) ( ) ( ) k k k k lrd o lrd p
o N p o N p k
k k
k k
lrd o
LOF p lrd p
N p N p
∈ ∈
=
∑
=∑
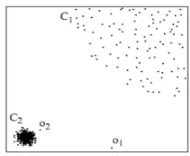
(5) A data point p’s local outlier factor shows the average value of the local reachable density in its adjacent space Nk(p) and its own local reachable density. If the density of p is lower than the density
different density. If predict O2 by using C1’s density, then it is a normal point. However, O2 actually is an outlier.
[image:3.612.147.242.99.177.2]
Figure 1. Abnormal points in different density. Figure 2. Examples of SVM misclassification.
From features discussed above, LOF algorithm is able to identify those misclassified objects by SVM. As shown in figure 2, C1 represents abnormal users, C2 represents normal users and hyperplane w*x + b = 0 is a plane from SVM. For points P1 and P2, although the SVM model predict them as normal users, they are actually abnormal users since they are not in either clusters. Using LOF could avoid this kind of misclassification error and identify those abnormal users. Since LOF has these advantages, using LOF to detect abnormal behaviors from local data among electricity power customers is more efficient and more precise.
Correlation Measurement Based on the Similar User Power Load
Pearson correlation coefficient is a measurement to check the correlation between two variables X and Y. The definition for Pearson correlation coefficient between two random variables X and Y is the quotient between the product of their covariance and the product of their standard deviation, which is shown in formula (6):
[
]
,
( )( )
cov( , )
X Y
X Y X Y
E X X Y Y
X Y µ µ
ρ
σ σ σ σ
− −
= =
_
cov( , _ )
_
x x mean x x mean similar r
σ σ
=
(6) From the correlation definition, this coefficient could be used to find the similarity between each user. Especially for those users whom live in the same district. They usually have a similar power load. The linear correlation between a user and other users in the same district can be a measurement to check abnormal electricity using. As shown in formula (6), x represents the power load for a certain user; x_mean represents the mean of power load in that district. This measurement describes abnormal electricity using level from a geographical perspective. If a user has a different power load compare with those users whom live in the same district, this user could be an abnormal user.
Correlation Change Rate Measurement Based on the Most Relevant Users
Similarly, data in a certain period can be evenly divided to two period D1 and D2 by their date. D1 is used to find the highest correlation coefficient rij for each user i and user j from other users, which
means the correlation between user i and user j is the largest. Their correlation coefficient is defined as D1_rij. D2 is used to calculate the correlation coefficient between each user i and its most
correlated user j, which is defined as D2_rij. After getting D1_rij and D2_rij, changing rate from
D1_rij to D2_rij can be treat as a new feature: change_rate. As shown in formula (7). This feature
describes users’ abnormal level from a time perspective. When users’ power load has a significant difference with their the most earliest correlated users’ electricity load, these users can be treated as abnormal users.
(
2 _ 1_)
_
1_
ij ij
ij abs D r D r change rate
D r
− =
Abnormal Power Consumption Model Based on Compound Features
Data Collection
[image:4.612.93.519.147.189.2]Data using here for detecting abnormal electricity using is from a power supply company in a province. It includes automatic meter reading data within period from Jan 1st 2015 to Dec 12th 2016 for 3 districts. Figure 3 shows procedures for preprocessing data:
Figure 3. Data preprocessing flowchart.
Filtering and Selection
Since the raw data is from a power supply company, which includes the automatic meter reading data, it contains several situations may affect the model, such as data missing, wrong data and duplicate data. These problems can be solved by deleting all data where the power consumption is 0.
Missing Value Padding
Although most of missing data can be cleaned by data filtering and features selection, missing value still can be found in the dataset for most of times. For these missing values, they can be replaced by the mean of that period.
Features Extraction
To extract compound features, first step is to extract users’ electricity power load. It can be shown as xi = {xij, j = 1,2,…,D}, where i represents i-th user, j represents j-th day and D represents the total
number of days. The whole dataset can be represented as X = {xi, I = 1,2,…,N}, and X is the daily power load and N is the total number of users. Correlation measurement feature and the changing rate can be extracted from daily power pattern data.
Since the SVM model’s performance in extracting abnormal electricity using probability and finding local abnormal outlier is not good in high-dimensional daily power load data, users’ monthly power load, which is from users’ daily power load data, should be used into the model since it is in a smaller dimensional space. Monthly power load represents as the daily average electricity consumption of the month, which is shown as following formula (8):
1
1
k ik
k k
P z
D D
+
+
=
− (8)
In formula 8, Pk+1 represents the monthly total electricity consumption and Dk+1 - Dk represents the
total number of days in that month. The notation of monthly power load represents as zi = {zik, k =
1,2,…,H}, where H is the total number of months, zik represents the monthly power load for the i-th
user in k-th month. Based on this concept, the notation monthly power load can be represent as Z = {zi, i = 1,2,…,N}. With these information and notations, the local outlier features and the abnormal
electricity identification probability can be gained from monthly power load data into local outlier algorithm and SVM model.
Data Normalization
Different dimensional features usually have different measurement unit. To eliminate the side effect from this difference, data normalization is indispensable for certain features.
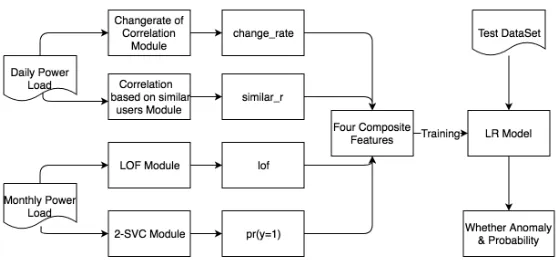
Logistic Regression from a Four-Dimensional Features
Figure 4. Abnormal electricity detection flowchart.
Logistic regression is a generally linear regression analysis model, which can make prediction and classification for binary labels from single or multiple variables. The probability density function is shown as following:
1
( ) ( )
1 T
T
x h x g x
e θ = θ = −θ
+ (10)
As shown in formula (11), θTxis the classification boundary, which is the product of each variable
and its corresponding regression parameter; g(z) is a logistic function (sigmoid function), which shown in formula (11). The result of h xθ( ) has a special meaning: when the probability for a certain user is greater than 0.5, the user can be considered as an abnormal user.
(11)
Analysis of Experimental Results
Identification of anomalous electricity use is in nature an issue of binary classification. The LR model finally obtained is actually a binary classifier. In the field of data mining, the confusion matrix can be used to evaluate the confidence level of a classifier. With the definition of the confusion matrix, the accuracy rate, precision rate, recall rate and other model evaluation indexes can be derived. However, when test samples are disproportional, it is unreliable to evaluate a model using the accuracy rate. The precision rate and the recall rate reflect performance of the classifier in two aspects. Comprehensive evaluation of a classifier’s performance is impossible with a sole index. In order to neutralize influence of the accuracy rate and the recall rate, F1 is introduced as a comprehensive index to evaluate a classifier more systematically.
(
) (
)
1 2* * /
F = Precision Recall Precision+Recall
[image:5.612.166.445.64.198.2](12) In this paper, automatic data logging of authentic users in three transformer areas of an electricity supply company provides experimental data to verify validity of the model built in this paper. Table 1 presents the specific data.
Table 1. Three transformer area’s data. transformer areas
ID
Number of users before filtering
Number of users after filtering
Abnormal power users
1000103440 757 596 299
220261291 181 150 76
220265495 207 157 79
Table 2. Compare the 2-SVC model and the LR model.
transformer areas ID accurate recall precision F1-score
2-SVC LR 2-SVC LR 2-SVC LR 2-SVC LR
1000103440 0.89 0.93 0.81 0.93 0.93 0.95 0.87 0.94 220261291 0.85 0.95 0.80 0.95 0.90 0.95 0.85 0.95 220265495 0.83 0.90 0.95 0.96 0.77 0.88 0.85 0.92
Average 0.86 0.93 0.85 0.95 0.87 0.93 0.86 0.94
Experimental results suggest that the average accuracy rate of 2-SVC in identifying model anomalies is 0.86; the average recall rate is 0.85; and the average precision rate is 0.87. In terms of these evaluation indexes, the LR model is obviously superior to 2-SVC in that the average accuracy rate, recall rate and precision rate of the former reach 0.93, 0.95 and 0.93, respectively. As compared with 2-SVC, the LR model improves performance of the three indexes by 6% to 10%. As mentioned above, it is unreasonable to evaluate a model with the precision rate or the recall rate alone. In order to accommodate to both the precision rate and the recall rate of the classification model, F1 can be employed to measure quality of the classification model. The last column of Table 4 compares scores of F1. It can be observed that scores of F1 increase by 8% from 0.86 to 0.94. These data suffice to prove that the anomalous electricity use evaluation indexes obtained through LR’s combination of the four models synthesize advantages of various indexes, thus improving the model’s identification capability of anomalous electricity use.
Conclusion
To sum up, this paper puts forward an anomalous electricity use model based on multi-dimensional compound features of electricity users. Through data preprocessing, the power load data of users are transformed into the daily power load data and the monthly power load data. The daily power load data are applied to two algorithm modules based on the correlation measurement; while the monthly power load data are applied to the support vector machine and the local outlier factor module. Then, a four-dimensional LR model is built with compound features of anomalous electricity use as independent variables and whether electricity use is anomalous as the dependent variable. The LR model thus built is adopted as the final anomalous electricity use identification model. Following that, residents’ electricity use data in three transformer areas of an electricity supply company are used to verify validity and accuracy of the model. Results suggest that detection of anomalies using the LR model is an effective approach, which can reliably and accurately identify residents’ anomalous electricity use. From the accuracy rate, recall rate, precision rate and scores of F1, it can be seen that the LR model is significantly superior to SVM.
Acknowledgement
This work is supported by National Natural Science Foundation of China under Grant No.61702043 and Fundamental Research Funds for the Central Universities under Grant No.500417062.
References
[1] Monedero I, Biscarri F, León C, et al. Detection of frauds and other non-technical losses in a power utility using Pearson coefficient, Bayesian networks and decision trees[J]. International Journal of Electrical Power & Energy Systems. 2012, 34(1): 90-98.
[3] Nagi J, Yap K S, Tiong S K, et al. Improving SVM-Based Nontechnical Loss Detection in Power Utility Using the Fuzzy Inference System[J]. IEEE Transactions on Power Delivery. 2011, 26(2): 1284-1285.
[4] Nagi J, Yap K S, Tiong S K, et al. Nontechnical Loss Detection for Metered Customers in Power Utility Using Support Vector Machines[J]. IEEE Transactions on Power Delivery. 2010, 25(2): 1162-1171.
[5] Nizar A H, Dong Z Y. Identification and detection of electricity customer behaviour irregularities[C]. 2009.
[6] Galván J R, Elices A, Ingeniería I, et al. System for Detection of Abnormalities and Fraud in Customer Consumption[J].
[7] Cortes C, Vapnik V. Support-Vector Networks[M]. Kluwer Academic Publishers, 1995: 273-297.
[8] Chang C C, Lin C J. LIBSVM: A library for support vector machines[M]. ACM, 2011: 1-27.
[9] Platt J C. Probabilistic Outputs for Support Vector Machines and Comparisons to Regularized Likelihood Methods[J]. Advances in Large Margin Classifiers. 1999, 10(4): 61-74.