2017 2nd International Conference on Information Technology and Management Engineering (ITME 2017) ISBN: 978-1-60595-415-8
Two-Archive2 Algorithm for Large-Scale Polygon Targets Observation
Scheduling Problem
Xiao-meng LI
*College of Information System and Management, National University of Defense Technology, Changsha, China
*Corresponding author
Keywords: Earth observation, Large-scale polygon targets, Two_Arch2, Inverted generational
distance (IGD).
Abstract. In the case of observing a single polygon target for a specified period of time with multiple earth observation satellites, select different observation plans will result in different regional coverage effects. How to schedule the observing scheme, so that the observing activities can achieve the required coverage with less satellite resources, meanwhile minimize the revisit rate of observation area in the shortest time, is a major optimization problem. This paper explores the modeling and solving method of this optimization problem. Firstly, the basic mathematical model is established, including the constraint condition and four optimization objectives. After that, target discretization method is introduced to calculate the regional coverage. Two-Archive2 algorithm (i.e., Two_Arch2) is chosen as the multi-objective evolutionary algorithm to solve this problem. The model and the solution method is used for solving a practical multi-satellite regional observation problem. The validity of the model and the algorithm is verified by the experimental results.
Introduction
Earth observation is the gathering of information about planet Earth’s physical, chemical and biological systems via remote sensing technologies supplemented by earth surveying techniques, encompassing the collection, analysis and presentation of data [1]. With the development of aerospace industry, the number of satellites on orbit continuously increased, earth observation began from a single-satellite observations on point targets evolve to multi-satellite observations of polygon targets.
Earth observation resources are scarce resources because they are costly, the overall cost of R&D, use, maintenance and delivery will be a very large number. In recent years, Earth observation has become technologically increasingly sophisticated. A slight increase in task planning for terrestrial imaging means a significant reduction in cost, with significant economic implications.
It is difficult for satellites to achieve coverage of polygon targets by single imaging due to the size of the field of view (FOV). Therefore, it is necessary to decompose the polygon target before the imaging task planning. By decomposing the polygon target into meta-tasks, meta-tasks are assigned to multi-satellite resources through planning, while, in the form of strips, the distribution of strips over polygon targets is used for realizing the coverage of the whole area.
At present, most of researches on the multi-satellite scheduling are based on the observation of point targets, while the researches based on polygon target observation are still relatively few.
Relevant articles currently include C. Rivett and C. Pontecorvo [2], who examined the problem of observing a polygon target of multiple satellites. They set up a planning model for multi-satellite monitoring of polygon targets and solved them with linear programming software. But only discussed on small-scale polygon targets, there is no solution for large-scale polygon targets observation by multi-satellite coordination.
method, which requires that the task strips must be parallel to the direction of satellite movement. Obviously, different satellite orbit and orbital cycles will lead to the direction of decomposed strip is inconsistent, resulting in crossover between different strips.
How to decompose the polygon target reasonably to ensure the maximum coverage with the minimum number of satellite resources in the shortest time and reduce the crossover rate of strips is the goal of this scheduling problem. On account of this is a many-objective optimization problem (ManyOPs) which usually refer to those multi-objective problems (MOPs) with more than three objectives, its large numbers of objectives pose challenges to multi-objective evolutionary algorithms (MOEAs) in terms of convergence, diversity, and complexity. Most existing MOEAs can only perform well in one of those three aspects. In view of this, we aim to find a more balanced MOEA on ManyOPs in all three aspects at the same time. Among the existing MOEAs, we found an improved two-archive algorithm (i.e., Two_Arch2) [3] for ManyOPs in this paper, which has a good performance on convergence, diversity, and complexity at the same time. The main idea of this algorithm is to maintain two archives during evolutionary search, where each archive promotes convergence (CA) and diversity (DA) separately. We select this MOEA to solve large-scale polygon targets observation scheduling problem.
The remainder of the paper is organized as follows. We firstly describe the scheduling problem and build the model in section II. In Section III, we will display and evaluate the results of the algorithm. Finally, Section IV gives the conclusion and future work.
[image:2.612.98.519.376.678.2]Problem Formulation
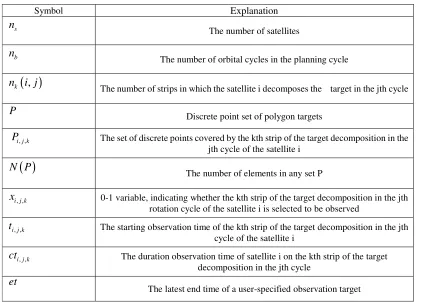
Table 1. Data symbolic representation.
Symbol Explanation
The number of satellites
The number of orbital cycles in the planning cycle
The number of strips in which the satellite i decomposes the target in the jth cycle
Discrete point set of polygon targets
The set of discrete points covered by the kth strip of the target decomposition in the jth cycle of the satellite i
The number of elements in any set P
0-1 variable, indicating whether the kth strip of the target decomposition in the jth rotation cycle of the satellite i is selected to be observed
The starting observation time of the kth strip of the target decomposition in the jth cycle of the satellite i
The duration observation time of satellite i on the kth strip of the target decomposition in the jth cycle
The latest end time of a user-specified observation target
In this paper, the observation task is decomposed into meta-tasks by the tracing method, the main information of a meta-task can be seen as follow:
a. The longitude and latitude coordinates of strip vertexes. b.The start observation time of strip.
(
,)
k
n i j
s
n
b
n
P
, ,
i j k
P
( )
N P
, ,
i j k
x
, ,
i j k
t
, ,
i j k
ct
c. The start observation side-swing angle of strip. d.The duration observation time of strip.
Because of the difference between the orbit of different satellites, for the same observation target may decompose into strips with different direction. Meanwhile, owing to the range of the side-swing angle is different, the width of the strip after decomposing is also various. Therefore, the number of meta-tasks generated by the target decomposition is enormous, and the crossover phenomenon between these meta-tasks is also inevitable. How to choose fewer tasks from meta- tasks set to reduce regional repeated observation is the main difficulty of this problem. In the subsections, the problem has been formulated and the symbolic representation is shown in Table 1.
Constraint Satisfaction Model
Eq. 1 shows that for the same satellite, the same rotation cycle can only select a strip to observe, which is because non-agile satellites only have side-swing maneuverability. Eq. 2 is the latest end time constraint, it requires that the observation end time for all strips must be less than the observation deadline by the polygon target.
(, )
, , 1
1 1, 2,..., 1, 2,..., k
n i j
i j k s b
k
x i n j n
=
≤ = =
∑
(1)). , ( ,..., 2 , 1 ,..., 2 , 1 ,..., 2 , 1 , , ,
, ct et i n j n k n i j
tijk+ ijk ≤ = s = b = k
(2)
Objective Function Model
The four optimization objectives represent minimizing the number of selected strips, minimizing crossover rate, maximizing target coverage rate, and minimizing task completion time.
. min 1 1 ) , ( 1 , ,
∑∑ ∑
= = =s b k
n i n j j i n k k j i x (3) . ) ( min 1 1 ) , ( 1 , , = = =
∩ ∩ ∩
s b kn i n j j i n k k j i P S C (4)
(
)
. max 1 1 ) , ( 1 , , = = =∪ ∪ ∪
s b kn i n j j i n k k j i P S C (5)
(
)
(
)
. maxmin xi,j,k ti,j,k+cti,j,k (6)
Equation S
(
Pi,j,k)
and C(
Pi,j,k)
can be explained by Eq. 7 and Eq. 8 (S(
Pi,j,k)
used for indicatingwhether a strip is selected, and C
(
Pi,j,k)
means coverage rate).(
)
, , , ,, ,
, ,
1
0
i j k i j k i j k
i j k
P x S P x = = ∅ =
(7)
(
)
(
)
( )
, , , ,
i j k i j k
N P C P
N P
Target Discretization
The discretization of the target is mainly to facilitate the calculation of coverage and crossover rate. It can describe the target through a series of discrete points, and avoid the integration of area, which makes the calculation more convenient and quick.
The discretization process mainly adopts the method of equidistant scattered points, and the precision is controlled by the distance between the discrete points. The more dense the discrete points are, the higher the precision is, but the computational complexity is also increased. Figure 1. gives the schematic diagram of area discretization.
Figure 1. Schematic diagram of area discretization.
The calculation of the crossover rate Cri,j,k of the candidate stripPi,j,k versus the selected strip set
mainly by the following Eq. 9, Where p is the discrete point, Pclis thel th selected strip, andlc is the number of strips.
, ,
1
, ,
1
( )
c
c
l i j k l
l
i j k l
l l
N p p P p Pc
Cr
N Pc
=
=
∈ ∧ ∈
=
∪
∪
(9)
Figure 2. shows the schematic diagram of cross-coverage, where the blue part represents the cross-coverage area.
Figure 2. Schematic diagram of cross-coverage area.
Experimental Results
Test Problem
rectangular large-scale area as the target area to be observed. Strip information includes the latitude and longitude coordinates of vertexes, start observation time and duration observation time, satellite and rotation cycle number. Using three earth observation satellites for imaging and generating multiple meta-tasks by pretreatment. According to the constraints, tasks that do not meet the requirements are deleted and finally 40 strips are selected as input, it means either individual in population has 40 decision variables, their bounds are between 0 and 1, if the strip is selected, its decision variable value takes 1, otherwise the value takes 0. The number of optimization objectives is set to 4, including minimizing the number of selected strips, minimizing crossover rate, maximizing target coverage rate and minimizing task completion time.
Results and Discussion
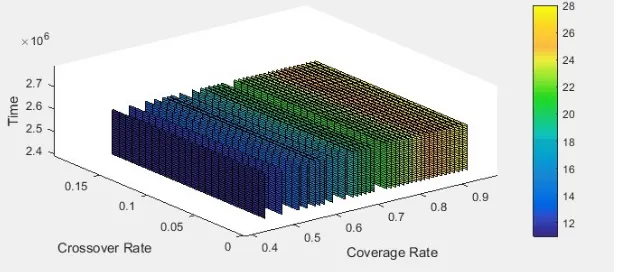
The proposed Two_Arch2 procedure was coded in C# and implemented on a computer with a 1.70 GHz Core (TM) 2 Duo processor with 4.0 GB of RAM memory. In the experiments, we use the same reproduction operators (crossover rate (pc = 1) and mutation rate (pm = 0.1)). The maximum sizes of CA and DA are 30 and 40. Except for test problems with special structures, the Pareto front of a practical problem is usually unknown. Accordingly, the unknown Pareto front is approximated by selecting non-dominated solutions among solution space obtained by run of Two_Arch2 with 100 population size and 500 generations. The approximated Pareto front is shown as four dimension slice graph in Figure 3. All the experiments are repeated for 20 independent runs.
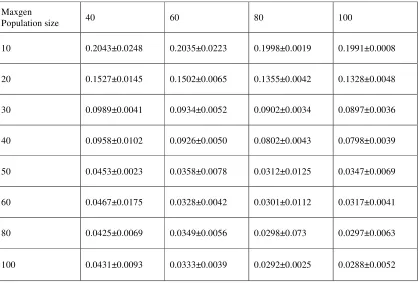
Table 2. shows the mean and standard deviation IGD-metric of obtained solutions in 20 runs. The number of generations ranges from 10 to 100, population sizes in turn are 40, 60, 80, 100. When the population size increased from 80 to 100, the IGD value did not significantly reduce, taking into account the calculation of the problem, select a smaller population size can get relatively satisfactory results. Similarly, when the maximum number of iterations reaches 50, increasing the number of iterations does not result in a significantly lower IGD, consider of computational complexity, it is not necessary to choose higher iteration number.
[image:5.612.153.463.489.625.2]Figure 4. shows the parallel coordinate plots of the best solution sets obtained by Two_Arch2 with the minimum number of IGD value on the same number of generations. As we can see from the figure, with the increase number of the iterations, the convergence of the solution is gradually become better, although from the point of view of diversity is slightly worse than the results with fewer number of iterations, but also has a good effect.
Figure 4. Parallel coordinate plots of the best solution.
Table 2. The mean and standard deviation IGD-metric of obtained solutions in 20 runs. Maxgen
Population size 40 60 80 100
10 0.2043±0.0248 0.2035±0.0223 0.1998±0.0019 0.1991±0.0008
20 0.1527±0.0145 0.1502±0.0065 0.1355±0.0042 0.1328±0.0048
30 0.0989±0.0041 0.0934±0.0052 0.0902±0.0034 0.0897±0.0036
40 0.0958±0.0102 0.0926±0.0050 0.0802±0.0043 0.0798±0.0039
50 0.0453±0.0023 0.0358±0.0078 0.0312±0.0125 0.0347±0.0069
60 0.0467±0.0175 0.0328±0.0042 0.0301±0.0112 0.0317±0.0041
80 0.0425±0.0069 0.0349±0.0056 0.0298±0.073 0.0297±0.0063
[image:6.612.99.517.426.709.2]Conclusion
In this paper, a large-scale polygon targets observation scheduling problem was proposed, owing to this is a ManyOPs which usually refer to MOPs with more than three objectives, an effective Two-Archive2 algorithm was proposed, which can cope with ManyOPs with satisfactory convergence, diversity, and complexity. The experimental results demonstrate that Two_Arch2 has a good performance for solving this schedule problem. But there are still some shortcomings, firstly, when the problem is modeled, only the constraints of time window and satellite orbit are considered, the limiting factors such as weather, cloud over, and sensor load are not taken into account. Meanwhile, in the calculation of coverage and crossover rate, due to the use of discrete point division method, resulting in a large amount of calculation. In the process of population evolution also need to repeat the calculation of the objective value. In practical problems, consider of the demand timeliness, this method can not be applied well to the emergency scheduling problem. In the future, the following works can be made. Initially, finding a better method to calculate the coverage rate of the polygon targets is essential, Additionally, it is necessary to find a new multi-objective evolutionary algorithm or a reasonable improvement of the existing algorithm, in order that it can better solve this practical problem.
References
[1] Frančula, Nedjeljko. International Journal of Applied Earth Observation and Geoinformation[M]//International journal of applied earth observation and geoinformation. International Institute for Aerial Survey and Earth Sciences, 1999:351–358.
[2] Rivett C, Pontecorvo C. Improving satellite surveillance through optimal assignment of assets[J]. Improving Satellite Surveillance Through Optimal Assignment of Assets, 2003.
[3] Li B, Li J, Tang K, et al. An improved Two Archive Algorithm for Many-Objective optimization[C]//Evolutionary Computation. IEEE, 2014:2869-2876.
[4] Zitzler E, Künzli S. Indicator-Based Selection in Multiobjective Search[J]. Lecture Notes in Computer Science, 2004, 3242:832-842.
[5] Zitzler E, Thiele L. Multiobjective optimization using evolutionary algorithms—A comparative case study[M]//Parallel Problem Solving from Nature—PPSN V. Springer Berlin Heidelberg, 1998:292-301.
[6] Zhang Q, Zhou A, Zhao S, et al. Multiobjective optimization Test Instances for the CEC 2009 Special Session and Competition[J]. University of Essex, 2008.
[7] Globus A, Lohn J, Crawford J, et al. Scheduling Earth Observing Fleets Using Evolutionary Algorithms: Problem Description and Approach[J]. Proceedings of International Nasa Workshop on Planning & Scheduling for Space, 2003:27-29.
[8] Rudolph G, Trautmann H, Sengupta S, et al. Evenly Spaced Pareto Front Approximations for Tricriteria Problems Based on Triangulation[M]//Evolutionary Multi-Criterion Optimization. 2013:443-458.
[9] Lin W C, Liu C Y, Liao D Y, et al. Daily imaging scheduling of an Earth observation satellite[J]. Systems Man & Cybernetics Part A Systems & Humans IEEE Transactions on, 2003, 2(2):1886-1891 vol.2.
[11] Ishibuchi H, Tsukamoto N, Nojima Y. Evolutionary many-objective optimization: A short review[C]// International Workshop on Genetic and Evolving Systems. 2008:266-271.
[12] Knowles J, Corne D. On metrics for comparing nondominated sets[C]// Evolutionary Computation, 2002. CEC '02. Proceedings of the 2002 Congress on. IEEE, 2002:711-716.