R E S E A R C H A R T I C L E
Open Access
Bone turnover and periprosthetic bone loss
after cementless total hip arthroplasty can
be restored by zoledronic acid: a
prospective, randomized, open-label,
controlled trial
Tsan-Wen Huang
1,2,7, Chao-Jan Wang
2,4,6, Hsin-Nung Shih
2,3,6, Yuhan Chang
2,3,6, Kuo-Chin Huang
2,5,8,
Kuo-Ti Peng
1,2,7and Mel S. Lee
2,5*Abstract
Background:Although the loss of bone mineral density (BMD) after total hip arthroplasty (THA) is a known problem, it remains unresolved. This study prospectively examined the effect of zoledronic acid (ZA) on bone turnover and BMD after cementless THA.
Methods:Between January 2010 and August 2011, 60 patients who underwent cementless THA were randomly
assigned to receive either ZA infusion or placebo (0.9% normal saline only) postoperatively. ZA was administered at 2 day and 1 year postoperatively. Periprosthetic BMD in seven Gruen zones was assessed preoperatively and at given time points for 2 years. Serum markers of bone turnover, functional scales, and adverse events were recorded.
Results:Each group contained 27 patients for the final analysis. The loss of BMD across all Gruen zones (significantly in zones 1 and 7) up to 2 years postoperatively was noted in the placebo group. BMD was significantly higher in the ZA group than in the placebo group in Gruen zones 1, 2, 6, and 7 at 1 year and in Gruen zones 1, 6, and 7 at 2 years (p< 0.05). Compared with baseline measures of BMD, the ZA group had increased BMD in zones 1, 2, 4, 5, 6, and 7 at 1 year and in zones 1, 4, 6, and 7 at 2 years (p< 0.05). Serum bone-specific alkaline phosphatase and N-telopeptide of procollagen I levels were significantly increased at 6 weeks in the placebo group and decreased after 3 months in the ZA group. A transient decrease in osteocalcin level was found at 6 months in the ZA group. Functional scales and adverse events were not different between the two groups.
Conclusions:The loss of periprosthetic BMD, especially in the proximal femur (zones 1 and 7), after cementless THA could be effectively reverted using ZA. In addition, bone turnover markers were suppressed until 2 years postoperatively following ZA administration.
Trial registration:Chang Gung Memorial Hospital Protocol Record 98-1150A3, Prevention of Periprosthetic Bone
Loss After Total Hip Replacement by Annual Bisphosphonate Therapy, has been reviewed and will be made public on ClinicalTrials.gov. Trial registration number: NCT02838121. Registered on 19 July, 2016.
Keywords:Cementless total hip arthroplasty, Bone mineral density, Bisphosphonate, Stress shielding, Zoledronic acid, Bone turnover markers
* Correspondence:[email protected] 2Chang Gung University, Taoyuan, Taiwan
5Department of Orthopaedic Surgery, Kaohsiung Chang Gung Memorial Hospital, No. 123, Dapi Rd., Niaosong District, Kaohsiung City 83301, Taiwan Full list of author information is available at the end of the article
Background
Cementless total hip arthroplasty (THA) has become popular in recent decades [1, 2], but its long-term stabi-lity may be limited by progressive bone loss around the prosthetic implant [3, 4]. Periprosthetic bone loss is associated with reduced bone mineral density (BMD) in the periprosthetic Gruen zones [5–7] and may increase the risk of migration, implant loosening, and peripros-thetic fractures [8].
A reduction in BMD, especially in the calcar region, is a common sequela of THA [6, 9–11]. Thus, preserving bone mineral content is important. Bisphosphonates are anti-resorptive agents that promote bone mineralization and inhibit farnesyl pyrophosphate synthase [12]. Their protective effects after joint arthroplasty have been shown in recent meta-analysis studies [13–15] wherein the periprosthetic BMD continued to increase by 9.40% at 18–70 months after discontinuation of bisphospho-nate therapy.
Zoledronic acid (ZA), a third-generation bisphospho-nate, is several times more potent than the first- or second-generation bisphosphonates. It is well tolerated and can rapidly lower bone turnover rates in children and adults at high risk of fractures [16–19]. In the pi-votal Health Outcomes and Reduced Incidence with ZA Once-Yearly Trial (HORIZON-PFT), a once-yearly infu-sion of 5-mg intravenous ZA for a 3-year period signifi-cantly reduced the risk of vertebral fractures by 70%, hip fractures by 41%, and non-vertebral fractures by 25% in post-menopausal women with osteoporosis [20]. ZA protects against osteoporotic fractures [21]. Recently, two studies demonstrated the efficacy of ZA in patients who underwent cementless THA [22, 23], but ZA was administered on different schedules, leaving questions about the optimal dose timing of ZA unanswered.
In the present study, we administered ZA during the early postoperative period after cementless THA, and as a booster dose at 1 year postoperatively. The effects of ZA on periprosthetic BMD and functional outcome measures were assessed prospectively. Add-itionally, we examined safety concerns surrounding the dosing of ZA.
Methods
Study design
This prospective, randomized, open-label clinical trial was registered in ClinicalTrials.gov (NCT02838121). The Institutional Review Board of the study institution approved the study protocol (Reference number 98-1150A3), which adhered to the Declaration of Helsinki. All of the study participants provided written informed consent.
Based on Arabmotlagh et al. [10], the assumption of mean BMD change was −8% in the placebo group and
6% in the ZA group, with a standard deviation (SD) of 15%. Power analysis indicated that 25 patients were required, per group, to achieve a power of 0.9 with a 5% significance level. To avoid drop off and loss to follow-up, we recruited 30 patients in each grofollow-up, for a total study sample of 60 patients. The assumptions were proven to be adequate because a similar sample size was reported by another prospective randomized trial [22]. Eligible patients were randomly assigned to either the ZA or placebo groups by an envelope drawing.
On the day following cementless THA, and at 1-year post-THA, the ZA group received 5 mg ZA (Aclasta®; Novartis Pharmaceuticals Corporation) via intravenous infusion with 0.9% normal saline (500 mL). The control group received only an intravenous saline infusion. All patients received oral calcium (600 mg) and vitamin D3 supplements (800 IU) daily throughout the course of the study [24]. Follow-up for radiographic and functional as-sessments was conducted at 2, 6, and 12 weeks, 6 months, and 1 and 2 years postoperatively.
Patients
Patients aged 35–85 years undergoing THA, who received dual-energy x-ray absorptiometry (DXA) scanning within the 3 months preceding surgery, were considered for enrollment. Exclusion criteria included use of bispho-sphonates during the preceding 2 years; uncontrolled seizure disorders; invasive malignancy within the preceding 5 years; osteogenesis imperfect; multiple myeloma; Paget’s disease; iritis; uveitis; diabetic neu-ropathy/retinopathy; active primary hyperthyroidism; Aspartate aminotransferase (AST), alanine amino-transferase (ALT), or bone-specific alkaline phosphat-ase levels more than twice the normal limit; serum calcium level >11 mg/dL; hypocalcemia; renal insuffi-ciency (creatinine clearance ≤35 mL/min); use of in-vestigational drugs; and the use of hip protectors or implants on the contralateral hip joint.
The patients’ demographic data, body mass index, pre-operative diagnoses, and baseline characteristics were recorded.
Total hip arthroplasty
Assessments
An experienced clinician, blinded to group assignment and patients’ demographic data, performed all radio-graphic and clinical assessments.
On each follow-up visit, radiographic evaluation of the total hip prosthesis was performed on each standard antero-posterior views of the pelvis and lateral views of the operated hip according to methods described by Engh et al. [27] and Johnston et al. [28]. The vertical distance between the lateral shoulder of the prosthesis and the superior tip of the greater trochanter on the radiograph was measured. This served as the reference distance for monitoring implant migration. At each study visit, this distance was measured and recorded.
The patients underwent DXA scanning of the operated hip using a densitometer (Hologic Inc., Waltham, MA) for quantifying bone mass and density changes [7]. To estimate the precision of the densitometer, double measurements involving repositioning of the patient and the scanner between the first and second scans were made in 10 patients [29]. The DXA method had a mea-surement error of 1%–3% in Gruen zones. BMD was measured in the frontal plane, throughout seven Gruen zones, and changes in BMD ratios from baseline were estimated for each zone.
Functional assessments included the Hip Harris Score (HHS), UCLA activity score, Short-Form (SF)-12 Physical Component Summary (PCS), and SF-12 Mental Component Summary (MCS). Renal function (glomeru-lar filtration rate [GFR] and creatinine level), hepatic function (AST and ALT), serum calcium, and levels of bone turnover biomarkers (osteocalcin, bone-specific al-kaline phosphatase, and N-telopeptide of procollagen I) were also assessed [30, 31].
Complications, including reported need for analgesics, were recorded. Any medical or surgical event that com-promised clinical recovery was defined and recorded as an adverse event. A relatively poorer and slower func-tional recovery beyond 3 months and an HHS score <80 were considered adverse events.
The primary endpoint was the change in peripros-thetic BMD, between baseline and all other time points. Secondary endpoints included radiologic analyses, implant migration, levels of serum markers for bone metabolism, functional outcomes, and safety and tolerability of the experimental drug.
Statistical analysis
Values are presented as mean (±SD). Group differences were analyzed using independent-samples t-test. Time-based differences were analyzed by repeated measures analysis of variance (ANOVA) using a general linear model with Greenhouse-Geisser correction. Significance was set atp< 0.05. Post hoc comparisons were performed
using Bonferroni corrections for multiple comparisons. SPSS software version 13.0 (SPSS Inc., Chicago, IL) was used for all analyses.
Results
Patient demographics
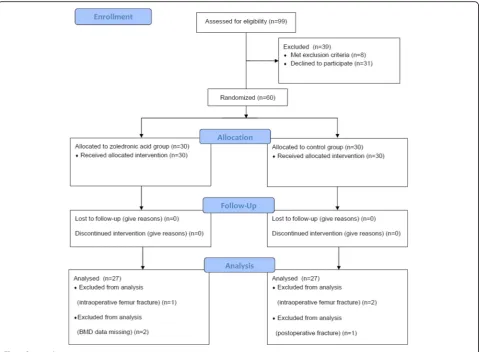
Between January 2010 and August 2011, 60 patients were enrolled. Following randomization into either the ZA or placebo control groups, four patients (one in the ZA group and three in the control group) were excluded due to periprosthetic fractures and an additional two (both from the ZA group) were excluded due to missing BMD data at 1 year (Fig. 1). Each group had 27 patients for the final analysis and no significant differences in baseline characteristics were found between the two groups (Table 1).
Radiographic analysis
All implants showed stable osteo-integration without evidence of early or late migration. There were no radio-lucent lines at the prosthesis-bone interface of the cups and stems, and no pedestal formation in any stem, in either group.
Bone mineral density
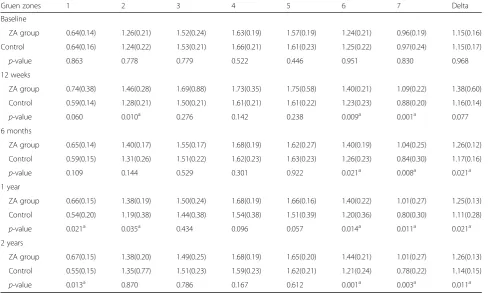
At baseline, both groups had similar BMD. The delta BMD at each time point revealed that at 12 weeks, the ZA group had significantly higher BMD than the control group in Gruen zones 2, 6, and 7. Increases in BMD per-sisted at 6 months in zones 6 and 7, at 1 year in zones 1, 2, 6, and 7, and at 2 years in zones 1, 6, and 7 (Table 2). The BMD changes from baseline (BMD ratio) were significantly higher for the ZA group in Gruen zones 2, 4, 6, and 7 at 12 weeks; in zones 1, 6, and 7 at 6 months; in zones 1, 2, 4, 5, 6 and 7 at 1 year, and in zones 1, 4, 6, and 7 at 2 years (Table 3).
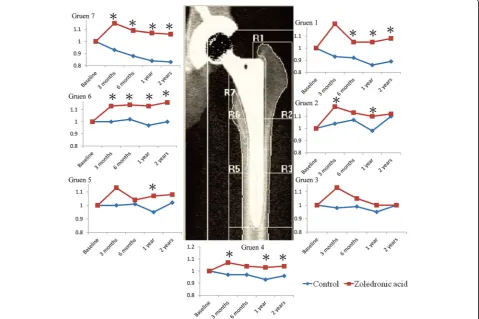
Time-based BMD differences in each Gruen zones were analyzed by repeated measure ANOVA (Fig. 2). In zone 1, the mean BMD change was 111% in the ZA group and 88% in the control group (95% CI, 10%–36%; p= 0.001). In zone 2, the mean BMD change was 114% (ZA) and 103% (control) (95% CI, 2%–20%; p= 0.018). In zone 4, the mean BMD change was 105% (ZA) and 95% (control) (95% CI, 5%–15%; p= 0.001). In zone 5, the mean BMD change was 108% (ZA) and 99% (con-trol) (95% CI, 1%–18%;p= 0.024). In zone 6, the mean BMD change was 114% (ZA) and 98% (control) (95% CI, 7%–25%; p= 0.001). In zone 7, the mean BMD change was 110% (ZA) and 84% (control) (95% CI, 14%–37%;p< 0.001).
Functional outcomes
groups at any point in the study. However, the within-group functional scores changed significantly throughout the study period (p< 0.001) (Table 4). HHS increased significantly from baseline to 6 weeks, and thereafter up to 2 years, in both groups (p< 0.001). SF-12 (PCS) scores were lower at 2 weeks compared to baseline (p< 0.001), but increased significantly from baseline to 12 weeks, and thereafter up to 2 years, in both groups (p< 0.001).
The SF-12 (MCS) scores of both groups were signifi-cantly lower at 1 year compared to 6 weeks (p< 0.05). Compared to baseline, the UCLA scores of both groups were significantly lower at 2 and 6 weeks (p< 0.01), but significantly increased by 1 year (p< 0.001).
Renal and hepatic function and serum calcium levels
There were no significant differences in creatinine levels between the two groups at baseline or at any time point throughout the study. GFR increased within both groups between baseline and 6 months (p< 0.01) and baseline and 1 year (p< 0.001) (Table 5). The AST and ALT values at baseline and at 6 and 12 weeks were within normal limits and had no group differences were rea-lized at any time point. Serum calcium levels were simi-lar in both groups at all time points.
Biomarkers of bone turnover
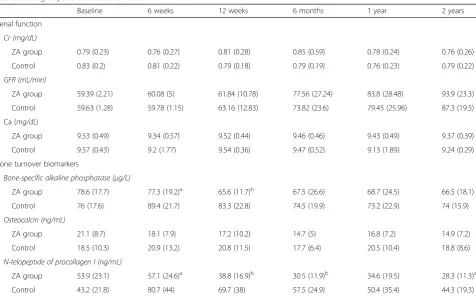
There was a significant reduction, from baseline, in levels of bone-specific alkaline phosphatase for the ZA group at 12 weeks, 6 months, 1 year, and 2 years postop-eratively (p< 0.01). In the control group, bone-specific
[image:4.595.59.539.87.439.2]Fig. 1Patient disposition
Table 1Patient demographics and surgical results ZA group (n= 27)
Control group (n= 27) Age (years), mean (SD) 60.1 (11.7) 59.4 (13.3)
Sex, female:male 15:12 14:13
BMI (kg/m2), mean (SD) 26 (4) 25 (5)
Operation time (minutes),
mean (SD)a 118 (27) 103 (17)
Blood loss (mL), mean (SD) 502 (312) 387 (162)
Diagnosis (OA/AVN) 16/11 17/10
BMIbody mass index,SDstandard deviation,ZAzoledronic acid,OAosteoarthritis, AVNavascular necrosis
a
[image:4.595.56.293.591.706.2]alkaline phosphatase was significantly increased at 6 and 12 weeks postoperatively (p< 0.05) (Table 5). In the ZA group, osteocalcin was significantly reduced between baseline and 6 months, 1 year, and 2 years (p< 0.05). The control group demonstrated significant
increases in osteocalcin between baseline and 1 year (p< 0.05).
[image:5.595.56.549.100.393.2]In the ZA group, levels of N-telopeptide of procolla-gen I were significantly reduced from baseline at 12 weeks, 6 months, 1 year, and 2 years postoperatively
Table 2Mean (SD) BMD (g/cm2) for both groups in all gruen zones
Gruen zones 1 2 3 4 5 6 7 Delta
Baseline
ZA group 0.64(0.14) 1.26(0.21) 1.52(0.24) 1.63(0.19) 1.57(0.19) 1.24(0.21) 0.96(0.19) 1.15(0.16)
Control 0.64(0.16) 1.24(0.22) 1.53(0.21) 1.66(0.21) 1.61(0.23) 1.25(0.22) 0.97(0.24) 1.15(0.17)
p-value 0.863 0.778 0.779 0.522 0.446 0.951 0.830 0.968
12 weeks
ZA group 0.74(0.38) 1.46(0.28) 1.69(0.88) 1.73(0.35) 1.75(0.58) 1.40(0.21) 1.09(0.22) 1.38(0.60) Control 0.59(0.14) 1.28(0.21) 1.50(0.21) 1.61(0.21) 1.61(0.22) 1.23(0.23) 0.88(0.20) 1.16(0.14)
p-value 0.060 0.010a 0.276 0.142 0.238 0.009a 0.001a 0.077
6 months
ZA group 0.65(0.14) 1.40(0.17) 1.55(0.17) 1.68(0.19) 1.62(0.27) 1.40(0.19) 1.04(0.25) 1.26(0.12) Control 0.59(0.15) 1.31(0.26) 1.51(0.22) 1.62(0.23) 1.63(0.23) 1.26(0.23) 0.84(0.30) 1.17(0.16)
p-value 0.109 0.144 0.529 0.301 0.922 0.021a 0.008a 0.021a
1 year
ZA group 0.66(0.15) 1.38(0.19) 1.50(0.24) 1.68(0.19) 1.66(0.16) 1.40(0.22) 1.01(0.27) 1.25(0.13) Control 0.54(0.20) 1.19(0.38) 1.44(0.38) 1.54(0.38) 1.51(0.39) 1.20(0.36) 0.80(0.30) 1.11(0.28)
p-value 0.021a 0.035a 0.434 0.096 0.057 0.014a 0.011a 0.021a
2 years
ZA group 0.67(0.15) 1.38(0.20) 1.49(0.25) 1.68(0.19) 1.65(0.20) 1.44(0.21) 1.01(0.27) 1.26(0.13) Control 0.55(0.15) 1.35(0.77) 1.51(0.23) 1.59(0.23) 1.62(0.21) 1.21(0.24) 0.78(0.22) 1.14(0.15)
p-value 0.013a 0.870 0.786 0.167 0.612 0.001a 0.003a 0.011a
a
statistically significant difference between ZA and control groups BMDbone mineral density,SDstandard deviation,ZAzoledronic acid
Table 3Mean (SD) bone mineral density ratio (the BMD changes from baseline) for each group by gruen zone at different time points
Gruen zones 1 2 3 4 5 6 7
12 weeks
ZA group 1.20(0.74) 1.18(0.28)a 1.13(0.62) 1.07(0.23)a 1.13(0.41) 1.13(0.13)a 1.15(0.21)a
Control 0.93(0.14) 1.04(0.12) 0.98(0.08) 0.97(0.04) 1.00(0.07) 1.00(0.15) 0.93(0.22)
6 months
ZA group 1.05(0.19)a 1.13(0.12) 1.05(0.21) 1.04(0.07) 1.04(0.18) 1.14(0.12)a 1.09(0.20)a
Control 0.92(0.18) 1.07(0.19) 0.99(0.08) 0.97(0.06) 1.01(0.07) 1.02(0.18) 0.88(0.29)
1 year
ZA group 1.05(0.19)a 1.10(0.10)a 1.00(0.09) 1.03(0.08)a 1.07(0.12)a 1.13(0.13)a 1.07(0.22)a
Control 0.86(0.24) 0.98(0.25) 0.95(0.22) 0.93(0.20) 0.95(0.24) 0.97(0.28) 0.84(0.29)
2 years
ZA group 1.08(0.21)a 1.12(0.11) 1.00(0.11) 1.04(0.09)a 1.08(0.15) 1.16(0.13)a 1.06(0.22)a
Control 0.89(0.14) 1.10(0.46) 1.00(0.08) 0.96(0.07) 1.02(0.10) 1.00(0.19) 0.83(0.20)
a
[image:5.595.56.539.532.715.2]Fig. 2Bone mineral density changes in the zoledronic acid and control groups in Gruen zones
Table 4Clinical assessments in each group at different time intervals (n= 54)
Preop 2 week 6 week 3 months 6 months 1 year 2 years
N mean ± SD N mean ± SD N mean ± SD N mean ± SD N mean ± SD N mean ± SD N mean ± SD
Harris hip score
Group ZA 27 60.31 ± 10.49 27 56.23 ± 14.06 27 70.96 ± 13.03a 27 77.93 ± 10.63a 27 83.60 ± 7.52a 27 86.34 ± 7.08a 27 90.18 ± 2.11a Group N/S 27 60.88 ± 11.63 27 58.80 ± 10.13 27 71.08 ± 12.26a 27 79.89 ± 9.42a 27 81.50 ± 9.87a 27 85.16 ± 7.28a 27 87.67 ± 5.44a SF-12(PCS)
Group ZA 27 27.53 ± 10.13 27 18.96 ± 7.48a 27 28.23 ± 11.35 27 40.01 ± 13.54a 27 48.09 ± 6.95a 27 51.29 ± 4.45a 27 53.69 ± 3.79a Group N/S 27 29.16 ± 11.31 27 21.37 ± 8.34a 27 27.79 ± 11.99 27 42.12 ± 10.61a 27 48.96 ± 7.90a 27 50.53 ± 6.95a 27 52.50 ± 4.16a SF-12(MCS)
Group ZA 27 57.65 ± 12.57 27 60.87 ± 9.51 27 59.23 ± 10.59 27 60.3 ± 6.86 27 58.85 ± 4.95 27 58.49 ± 4.07 27 58.61 ± 5.98 Group N/S 27 59.17 ± 11.99 27 60.08 ± 7.29 27 63.72 ± 3.84 27 59.9 ± 4.77 27 55.97 ± 8.34 27 56.96 ± 7.20 27 59.01 ± 4.05 UCLA activity score
Group ZA 27 3.96 ± 1.16 27 2.56 ± 0.80a 27 3.41 ± 0.97a 27 4.22 ± 0.93 27 4.63 ± 1.15 27 5.74 ± 1.06a 27 7.00 ± 0.90a Group N/S 27 4.33 ± 1.59 27 2.56 ± 0.70a 27 3.44 ± 0.97a 27 4.52 ± 0.94 27 4.70 ± 0.95 27 5.52 ± 1.19a 27 6.50 ± 0.74a
Statistically significant difference between ZA and control groups
a
significant difference between each time point and baseline
[image:6.595.58.536.510.706.2](p< 0.05). In the control group, these levels significantly increased from baseline at 6 weeks, 12 weeks, and at 6 months postoperatively (p< 0.05). There were signifi-cant differences in bone turnover biomarkers between the ZA and control groups (Table 5).
Adverse events
Complications included fever (n= 3) and hypocalcemia (n= 1) but were mild-to-moderate in severity, and be-lieved to be related to the investigational drug. No pa-tient sustained osteonecrosis of the jaw or atypical femoral fracture. Three patients (one in the ZA group and two in the control group) had intra-operative peri-prosthetic fractures, and one (control) subject had post-operative periprosthetic fracture. These individuals were excluded from the final analysis.
Discussion
The present study shows that ZA infusions on the day after cementless THA, and as a booster at 1 year posto-peratively, significantly reduced periprosthetic femoral BMD loss. In the control group, BMD decreased signifi-cantly in Gruen zones 1 and 7 up to 2 years postopera-tively. In contrast, for the ZA group, BMD significantly increased in all Gruen zones (except for zone 3) between
baseline and 1 year postoperatively. At 2 years postope-ratively it remained significantly increased in zones 1, 6, and 7. The greatest effect of ZA was observed in the proximal femur at 2 years, with BMD changes of +6% (control: −17%) in zone 7 and +8% (control: −11%) in zone 1. However, this improvement does not necessarily reflect better functional outcomes.
[image:7.595.61.538.106.403.2]Only two reports have previously studied ZA in pa-tients after cementless THA. Scott et al. [23] reported that ZA significantly prevented BMD loss in Gruen zones 1, 4, and 6 at 1 year, and in zones 1 and 6 at 2 years. However a decrease in BMD was still evident in zone 7 (calcar region) at 1 and 2 years. Our results were different. We found increased BMD after ZA across all Gruen zones at 1 year (though this difference did not rise to the level of statistical significance for zone 3), in-cluding Gruen zone 7. We thought the difference may be related to differences in Scott et al.’s timing of ZA administration (2 weeks postoperatively), or differences among the various types of prosthesis (two types of modular stems). The present study always administered ZA at 2 days postoperatively and used only one type of prosthesis. Periprosthetic BMD varies as a function of stem type. Patients with large and stiff femoral stems ex-perience greater stress shielding, which results in more
Table 5Mean serum creatinine (Cr) level, glomerular filtration rate (GFR), and bone turnover biomarkers in the ZA (zoledronic acid) and control groups as a function of time
Baseline 6 weeks 12 weeks 6 months 1 year 2 years
Renal function
Cr (mg/dL)
ZA group 0.79 (0.23) 0.76 (0.27) 0.81 (0.28) 0.85 (0.59) 0.78 (0.24) 0.76 (0.26)
Control 0.83 (0.2) 0.81 (0.22) 0.79 (0.18) 0.79 (0.19) 0.76 (0.23) 0.79 (0.22)
GFR (mL/min)
ZA group 59.39 (2.21) 60.08 (5) 61.84 (10.78) 77.56 (27.24) 83.8 (28.48) 93.9 (23.3)
Control 59.63 (1.28) 59.78 (1.15) 63.16 (12.83) 73.82 (23.6) 79.45 (25.96) 87.3 (19.5)
Ca (mg/dL)
ZA group 9.53 (0.49) 9.34 (0.57) 9.52 (0.44) 9.46 (0.46) 9.43 (0.49) 9.37 (0.39)
Control 9.57 (0.43) 9.2 (1.77) 9.54 (0.36) 9.47 (0.52) 9.13 (1.89) 9.24 (0.29)
Bone turnover biomarkers
Bone-specific alkaline phosphatase (μg/L)
ZA group 78.6 (17.7) 77.3 (19.2)a 65.6 (11.7)b 67.5 (26.6) 68.7 (24.5) 66.5 (18.1)
Control 76 (17.6) 89.4 (21.7) 83.3 (22.8) 74.5 (19.9) 73.2 (22.9) 74 (15.9)
Osteocalcin (ng/mL)
ZA group 21.1 (8.7) 18.1 (7.9) 17.2 (10.2) 14.7 (5) 16.8 (7.2) 14.9 (7.2)
Control 18.5 (10.3) 20.9 (13.2) 20.8 (11.5) 17.7 (6.4) 20.5 (10.4) 18.8 (8.6)
N-telopeptide of procollagen I (ng/mL)
ZA group 53.9 (23.1) 57.1 (24.6)a 38.8 (16.9)b 30.5 (11.9)b 34.6 (19.5) 28.3 (11.3)a
Control 43.2 (21.8) 80.7 (44) 69.7 (38) 57.5 (24.9) 50.4 (35.4) 44.3 (19.3)
a
significant difference between groups (P< 0.05)
b
resorption of the proximal femur [15]. The modular femoral prosthesis has a larger proximal implant seg-ment (for the neck-body taper junction) and is stiffer proximally. Proximal stiffness mismatches may increase proximal femoral stress shielding and subsequent bone loss. Moreover, more proximal bone loss occurs in femur preparation for larger femoral prosthesis. A femur with less bone mass is less stiff, relative to the implanted stem, and this will increase stress-related bone resorption [32]. In this study, we used a flat and double-tapered non-modular femoral stems. This design decreases the cross-sectional area moment of inertia and achieves initial stability by wedging into the proximal femur. It is consi-derably less stiff than the modular design and prevents periprosthetic bone loss.
In the second study, ZA (4 mg) was administered on the first postoperative day to 25 patients after cementless THA. Periprosthetic BMD was not analyzed but ZA improved the initial fixation of the cementless implant and prevented early implant migration, compared to 24 control patients [22]. The current study also used ZA in the acute postoperative period and did not find severe adverse events related to the drug. ZA infusion was deemed safe during the acute phase after THA. Taken together, early timing for postoperative ZA treatment may be a safe and effective means of preventing BMD loss after cementless THA.
Since periprosthetic bone loss is most pronounced in the early postoperative period [9], administering bispho-sphonates soon after surgery is logical [22]. Ericksen and colleagues reported that the timing of the first ZA infu-sion changes BMD for patients who recently underwent hip surgery [33]. At 1 year postoperatively, all patients treated with ZA had increased BMD except for the group that received an early dose (≤2 weeks postopera-tively). This group also demonstrated worse anti-fracture outcomes. While the current findings seem to contradict those of Ericksen et al., the patients in their study who received ZA≤2 weeks after surgery had a higher risk of mortality due to older age and a greater number of co-morbidities. Moreover, their study had a smaller sample size and therefore group heterogeneity may have affected their findings. The current study provides a consolidated examination of BMD and revealed biochemical data sup-porting the use of ZA in the early postoperative period (2 days postoperatively). Since THA or bipolar hemiar-throplasty are common surgeries for patients with hip fractures, early initiation of ZA or other bisphosphonates is practical and may lead to superior outcomes.
In their meta-analysis, Bhandari et al. [13] suggested that bisphosphonates had a beneficial effect in maintai-ning periprosthetic BMD after THA or total knee arthroplasty. Arabmotlagh et al. [10] reported long-standing beneficial effects of alendronate in the prevention
of periprosthetic bone loss 6 years after cementless THA. A single-dose of ZA can restore BMD beyond 1 year, with an effect comparable to that obtained with three annual ZA infusions [34]. In addition, ZA can prevent bone loss for long time periods. The HORIZON-PFT study reports a 6.02% increase in total hip BMD in patients, at risk of hip fractures, following 3 years of annual ZA treatment [19, 35]. Improvements in BMD continued for 6 years in these patients, suggesting a lasting effect of ZA.
Measuring serum calcium levels during ZA treatment is recommended [23]. In this study, both groups were administered oral calcium supplements. Serum calcium levels were within normal range throughout the study period (Table 5). Since ZA can lead to reduced serum calcium levels 6 weeks after its administration, providing calcium supplements is imperative.
Previous studies report short-term increases in creati-nine after treatment, which typically resolve quickly, and without long-term impact on renal function [35]. In this study, there were no significant differences in renal func-tion between the ZA and control groups, supportive of improved GFR over time.
This study found that bone turnover markers were sig-nificantly altered by the administration of ZA. Decreased bone turnover markers may contribute to the develop-ment of complications such as bisphosphonate-induced osteonecrosis of the jaw (ONJ) [23, 36] or atypical fe-moral fractures [37, 38]. ZA was administered over two doses in this study. This dosing was different from past studies of fracture prevention or studies that reported on complications such as ONJ and atypical femoral frac-tures related to prolonged use of bisphosphonates. Ex-tending the current study period will be beneficial since our data revealed changes in bone turnover markers to-ward the conclusion of the study. By following patients for more than 2 years, we may learn more about these changes, as well as the risks of bisphosphonate-related complications.
subjects. A future studies should clarify the effects of vitamin D levels.
Conclusions
In conclusion, initiation of ZA treatment in the acute postoperative period preserves periprosthetic BMD in the proximal femur (zones 1 and 7). ZA may be effective prophylaxis against periprosthetic bone loss and implant migration. Future large-scale, longitudinal studies are necessary to demonstrate clinical effectiveness and in-vestigate the risk of treatment-related complications.
Abbreviations
ALT:Alanine aminotransferase; ANOVA: Analysis of variance; AST: Aspartate aminotransferase; BMD: Bone mineral density; DXA: Dual-energy x-ray ab-sorptiometry; GFR: Glomerular filtration rate; HHS: Hip Harris Score; MCS: Mental Component Summary; PCS: Physical Component Summary; SD: Standard deviation; SF-12: Short-Form-12; THA: Total hip arthroplasty; ZA: Zoledronic acid
Acknowledgments
We thank Ms. Yu-Shuan Lin for recording radiographic and functional data and for assisting with the statistical analyses.
Funding
This study (CZOL446HTW07T study) was sponsored by Novartis. No additional grant support was provided.
Availability of data and materials
The dataset supporting the conclusions of this article is included within the article. Participants did not consent to public release of their data. However, data can be made available on request for researchers who meet the criteria for access to confidential data from the Department of Orthopaedic Surgery, Chang Gung Memorial Hospital, Chiayi, Taiwan.
Authors’contributions
MSL and H-NS contributed substantially to the conception and design of the study. C-JW, YC, K-CH, and K-TP analyzed and interpreted the data. T-WH drafted the article and revised it critically for important intellectual content. All authors reviewed and edited the manuscript and approved the final version of the manuscript.
Competing interests
All authors declare that they have no competing interests.
Consent for publication
Consents regarding individual details, images, and videos have been obtained from all patients.
Ethics approval and consent to participate
This prospective, randomized, open-label, single-center clinical trial with 1:1 allocation was registered in the public registry ClinicalTrials.gov (Reference number NCT02838121). The Institutional Review Board of the study institution approved the study protocol (Reference number 98-1150A3), and all patients provided signed informed consent.
Publisher’s Note
Springer Nature remains neutral with regard to jurisdictional claims in published maps and institutional affiliations.
Author details
1Department of Orthopaedic Surgery, Chang Gung Memorial Hospital, Chiayi, Taiwan.2Chang Gung University, Taoyuan, Taiwan.3Department of Orthopaedic Surgery, Chang Gung Memorial Hospital, Linkou, Taiwan. 4Department of Diagnostic and Interventional Radiology, Chang Gung Memorial Hospital, Linkou, Taiwan.5Department of Orthopaedic Surgery, Kaohsiung Chang Gung Memorial Hospital, No. 123, Dapi Rd., Niaosong
District, Kaohsiung City 83301, Taiwan.65 Fu-Hsin Street, Kweishan, Taoyuan, Taiwan.7No. 6, West Section, Chia-Pu Road, Pu-Tzi City, Chia-Yi Hsien 613, Taiwan.8No. 123, Dapi Rd., Niaosong District, Kaohsiung City 83301, Taiwan.
Received: 15 February 2017 Accepted: 12 May 2017
References
1. Stephen R, Burnett J. Total hip arthroplasty: techniques and results. BCMJ. 2010;52:455–64.
2. Markel DC, Hoard DB, Porretta CA. Cemented total hip arthroplasty with Boneloc bone cement. J South Orthop Assoc. 2001;10:202–8. 3. Chen G, Shukeir N, Potti A, et al. Up-regulation of Wnt-1 and beta-catenin
production in patients with advanced metastatic prostate carcinoma: potential pathogenetic and prognostic implications. Cancer. 2004;101:1345–56. 4. Yamada H, Yoshihara Y, Henmi O, et al. Cementless total hip replacement:
past, present, and future. J Orthop Sci. 2009;14:228–41.
5. Oh I, Harris WH. Proximal strain distribution in the loaded femur. An in vitro comparison of the distributions in the intact femur and after insertion of different hip-replacement femoral components. J Bone Joint Surg Am. 1978;60:75–85.
6. Alm JJ, Makinen TJ, Lankinen P, et al. Female patients with low systemic BMD are prone to bone loss in Gruen zone 7 after cementless total hip arthroplasty. Acta Orthop. 2009;80:531–7.
7. Iolascon G, Di Pietro G, Capaldo A, et al. Peri-prosthetic bone density as outcome of therapeutic response. Clin Cases Miner Bone Metab. 2010;7:27–31.
8. Aro HT, Alm JJ, Moritz N, et al. Low BMD affects initial stability and delays stem osseointegration in cementless total hip arthroplasty in women: a 2-year RSA study of 39 patients. Acta Orthop. 2012;83:107–14.
9. Venesmaa PK, Kröger HP, Miettinen HJ, et al. Monitoring of peri-prosthetic BMD after uncemented total hip arthroplasty with dural-energy X-ray absorptiometry –a 3-year follow-up study. J Bone Miner Res. 2001;16:1056–61.
10. Arabmotlagh M, Pilz M, Warzecha J, et al. Changes of femoral periprosthetic bone mineral density 6 years after treatment with alendronate following total hip arthroplasty. J Orthop Res. 2009;27:183–8.
11. Smolders JM, Hol A, Rijnders T, et al. Changes in bone mineral density in the proximal femur after hip resurfacing and uncemented total hip replacement: A prospective randomised controlled study. J Bone Joint Surg (Br). 2010;92:1509–14.
12. Ott SM. What is the optimal duration of bisphosphonate therapy? Cleve Clin J Med. 2011;78:619–30.
13. Bhandari M, Bajammal S, Guyatt GH, et al. Effect of bisphosphonates on periprosthetic bone mineral density after total joint arthroplasty. A meta-analysis. J Bone Joint Surg Am. 2005;87:293–301.
14. Lin T, Yan SG, Cai XZ, et al. Bisphosphonates for peri-prosthetic bone loss after joint arthroplasty: a meta-analysis of 14 randomized controlled trials. Osteoporos Int. 2012;23:1823–34.
15. Knusten AR, Ebramzadeh E, Longjohn DB, et al. Systematic analysis of bisphosphonate intervention on periprosthetic BMD as a function of stem design. J Arthroplasty. 2014;29:1292–7.
16. Yoshimura M, Kohno N, Yamada K, et al. (89)Sr imaging with bremsstrahlung in patients with metastatic breast cancer. Clin Nucl Med. 2012;37:1035–40. 17. Rakel A, Boucher A, Ste-Marie LG. Role of zoledronic acid in the prevention
and treatment of osteoporosis. Clin Interv Aging. 2011;6:89–99. 18. Simm PJ, Johannesen J, Briody J, et al. Zoledronic acid improves bone
mineral density, reduces bone turnover and improves skeletal architecture over 2 years of treatment in children with secondary osteoporosis. Bone. 2011;49:939–43.
19. Orwoll ES, Miller PD, Adachi JD, et al. Efficacy and safety of a once-yearly i.v. Infusion of zoledronic acid 5 mg versus a once-weekly 70-mg oral alendronate in the treatment of male osteoporosis: a randomized, multi-center, double-blind, active-controlled study. J Bone Miner Res. 2010;25:2239–50.
20. Black DM, Delmas PD, Eastell R, et al. HORIZON Pivotal Fracture Trial, Once-yearly zoledronic acid for treatment of post-menopausal osteoporosis. N Engl J Med. 2007;356:1809–22.
22. Friedl G, Radl R, Stihsen C, et al. The effect of a single infusion of zoledronic acid on early implant migration in total hip arthroplasty. A randomized, double-blind, controlled trial. J Bone Joint Surg Am. 2009;91:274–81. 23. Scott DF, Woltz JN, Smith RR. Effect of Zoledronic acid on reducing femoral
bone mineral density loss following total hip arthroplasty: preliminary results of a prospective randomized trial. J Arthroplasty. 2013;28:671–5. 24. Lambrinoudaki I, Vlachou S, Galapi F, et al. Once-yearly zoledronic acid in
the prevention of osteoporotic bone fractures in post-menopausal women. Clin Interv Aging. 2008;3:445–51.
25. Lee MS. Minimally invasive total hip arthroplasty. Formosan J Musculoskeletal Dis. 2011;2:41–4.
26. Chen D, Hu C, Chang Y, et al. Comparison of clinical outcome in primary total hip arthroplasty by conventional antero-lateral trans-gluteal or 2-incision approach. J Arthroplasty. 2009;24:528–32.
27. Engh CA, Massin P, Suthers KE. Roentgenographic assessment of the biologic fixation of porous-surfaced femoral components. Clin Orthop Relat Res. 1990;257:107–28.
28. Johnston RC, Fitzgerald Jr RH, Harris WH, et al. Clinical and radiographic evaluation of total hip replacement. A standard system of terminology for reporting results. J Bone Joint Surg Am. 1990;72:161–8.
29. Bodén H, Adolphson P. No adverse effects of early weight bearing after uncemented total hip arthroplasty: a randomized study of 20 patients. Acta Orthop Scand. 2004;75:21–9.
30. Kamiya N, Suzuki H, Endo T, et al. Clinical usefulness of bone markers in prostate cancer with bone metastasis. Int J Urol. 2012;19:968–79. 31. Savarino L, Granchi D, Cenni E, et al. Systemic cross-linked N-terminal
telopeptide and procollagen I C-terminal extension peptide as markers of bone turnover after total hip arthroplasty. J Bone Joint Surg (Br). 2005;87:571–6.
32. Glassman AH, Bobyn JD, Tanzer M. New femoral designs: do they influence stress shielding? Clin Orthop Relat Res. 2006;453:64–74.
33. Eriksen EF, Lyles KW, Colon-Emeric CS, et al. Anti-fracture efficacy and reduction of mortality in relation to timing of the first dose of zoledronic acid after hip fracture. J Bone Miner Res. 2009;24:1308–13.
34. Reid IR, Black DM, Eastell R, et al. HORIZON Pivotal Fracture Trial and HORIZON Recurrent Fracture Trial Steering Committees, Reduction in the risk of clinical fractures after a single dose of zoledronic Acid 5 milligrams. J Clin Endocrinol Metab. 2013;98:557–63.
35. Black DM, Reid IR, Boonen S, et al. The effect of 3 versus 6 years of zoledronic acid treatment of osteoporosis: a randomized extension to the HORIZON-Pivotal Fracture Trial (PFT). J Bone Miner Res. 2012;27:243–54.
36. Mehrotra B, Ruggiero S. Bisphosphonate complications including osteonecrosis of the Jaw. Hematol Am Soc Hematol Educ Program. 2006;515:356–60.
37. Shane E, Burr D, Abrahamsen B, et al. Atypical subtrochanteric and diaphyseal femoral fractures: second report of a task force of the American Society for Bone and Mineral Research. J Bone Miner Res. 2014;29:1–23.
38. Unnanuntana A, Saleh A, Mensah KA, et al. Atypical femoral fractures: what do we know about them? AAOS Exhibit Selection. J Bone Joint Surg Am. 2013;95:1–13. e8.
• We accept pre-submission inquiries
• Our selector tool helps you to find the most relevant journal
• We provide round the clock customer support
• Convenient online submission
• Thorough peer review
• Inclusion in PubMed and all major indexing services
• Maximum visibility for your research
Submit your manuscript at www.biomedcentral.com/submit