Proximity Data
Muhammad Awais Azam†School of Engineering and Information Sciences Middlesex University, London, UK
Jonathan Loo
School of Engineering and Information Sciences Middlesex University, London, UK
Sardar Kashif Ashraf Khan
School of Engineering and Information Sciences Middlesex University, London, UK
Usman Naeem
School of Architecture, Computing and Engineering University of East London, UK
Muhammad Adeel
School of Electronics Engineering and Computer Sciences Queen Mary University of London, UK
Waleed Ejaz
Department of Information and Communication Engineering Sejong University, Seoul, Republic of Korea
Abstract
Over the years, wireless enabled mobile devices have become an important part of our daily activities that can provide rich contextual information about the location and environment of an individual (for example who is in your proximity? and where are you?). Advancement in technology has opened several horizons to analyse and model this contextual information for human behaviour understand-ing. Objective of this research work is to utilise this information from wireless proximity data to find repeated patterns in daily life activities and individual behaviours. These repeated patterns can give information about the unusual activities and behaviour of an individual. To validate and further investigate this concept, we used Bluetooth proximity data in this paper. Repeated activity patterns and behaviour of low entropy mobile people are detected by using two different techniques, N-gram
Journal of Wireless Mobile Networks, Ubiquitous Computing, and Dependable Applications, volume: 3, number: 3, pp. 14-32
∗This paper is an extended version of the work originally presented at the IEEE International Conference on Pervasive
Computing and Communications Workshop , Lugano, Switzerland, March 2012 [].
and correlative matrix techniques. Primary purpose was to find out whether contextual information obtained from Bluetooth proximity data is useful for activities and behaviour detection of individu-als. Results have shown that these repeated patterns not only show short term daily routines but can also show the long term routines such as, monthly or yearly patterns in an individual’s daily life that can further help to analyse more complex and abnormal routines of human behaviour.
Keywords: Human Behaviour, Contextual Information, Low Entropy Behaviour, Repeated Activ-ity Patterns.
1
Introduction
Modelling human behaviour such as individual routines from contextual information of daily life activity patterns is an emerging realm in Ubiquitous Computing. Computers are becoming more pervasive and are embedded in everyday objects, such as cameras, music players, cars, clothing etc. There can be different sensing devices e.g., Radio Frequency Identification (RFID), motion sensors, GPS enabled tracking devices [19], and other context aware devices that can be used for real time proximity detection and daily life data gathering purposes. In particular, devices such as mobile phones provide a rich platform for various forms of data gathering by using its integrated sensors such as Bluetooth ID, digital camera, microphones and GPS transceivers. These sensors can give an individual’s location, movement and proximity information for the whole period of cell phone usage. Specifically, Bluetooth radios are frequently incorporated into mobile devices [9].
This new generation of “smart devices” has created new ways to utilise the capability of computers and enhanced the area of Ubiquitous Computing by providing rich and detailed information about the context of the user. Context-aware computing, which is part of Ubiquitous Computing, uses sensors either in the environment or carried / worn by the users to extract and interpret the user’s context, for example what resources are available, who is in close user’s proximity. This contextual information can help to recognise different tasks and activities perform by the user.
Detection and prediction of human behaviour from daily life activities is a challenging task. People can have both regular and varying daily life routines. Focus of this research work is on the detection of behaviour of the people who live low entropy lives that means they follow somewhat regular routines and exhibit less change in their behaviours as discussed in [4]. According to [4], if the user in his daily life, repeat the activities and routines with less change, it will be known as ‘low entropy’ behaviour. While a more change in daily routine patterns is considered as ‘high entropy’ behaviour. For example, a working person who follows the routine of going to the office and coming back home every day using the same means of the transport, or an elderly person with regular routines [7] (e.g., an early stage of dementia patient) can be the examples of people with more regular routines and hence less change in the behaviour. The basic objective of the research work is to utilise the contextual information from wireless prox-imity data (e.g. Bluetooth proxprox-imity data) to find repeated patterns in daily life activities and individual behaviours. These repeated patterns can give information about the actual activities performed by the users. The motivation behind the idea is to utilise the abundant nature of Bluetooth and other wireless devices around us to help and aid in the detection of unusual routines and activities of low entropy mobile people such as, elderly people and early stages of dementia patients.
data can be obtained and these repeated patterns can be used for activity and behaviour recognition. To find the repeated patterns of activities by using above mentioned techniques, a dataset of contex-tual information is required. For this purpose, a dataset that is collected at Massachusetts Institute of Technology (MIT) through Reality Mining project [4] is used in this research work. It is a very large daily human behaviour dataset collected via mobile phones during the year 2004-2005. The primary purpose was to provide an insight into the dynamics of both individual and group social behaviour using machine learning techniques. The dataset describes human behaviour in terms of mobile phone interac-tions. Both techniques mentioned above i.e. N-gram and correlative matrix are applied on this data set to obtain the repeated patterns in the wireless proximity data. Both techniques extract the total number of different length repeated patterns for different users. Longest repeated patterns out of these extracted patterns are further analysed by adding different levels of permutations in them to see how many more patterns can be obtained. Further analyses in terms of how much percentage of every single day in one month of wireless proximity data is comprised of repeated patterns is also done.
Rest of the paper is organized as follows: Section-2 discusses about the state of the art and the related work that other researchers have done so far. Section-3 discusses the ‘N-gram’ and ‘correlative matrix’ techniques in detail that are used in this paper to obtain the repeated activities patterns from the proximity data. Section-4 discusses the experimental results and Section-5 gives the summary and the future directions of the research work.
2
State of the Art
Recent advancements in information technology have created new and more challenging opportunities to gather information about the activities and behaviour of individuals. Importance of contextual in-formation in daily life routines has gained the confidence nowadays. Many researchers have worked on individual behaviours and some techniques have also been presented to analyse the accumulative behaviour of multiple individuals instead of one single individual.
Naeem et al. work on activity recognition of dementia patients inside the home [14]; they describe an approach for modelling and detecting activities of daily life based on a hierarchy of plans that contain a range of precedence relationships, representations of concurrency and other temporal relationships. Identification of activities of daily life is achieved by episode recovery models supported by using rela-tionships expressed in the plans. In [13] the same researchers define a two tier approach that is used to detect the activities of daily life. The higher tier uses hidden markov modelling (HMM) to model the common goals and sub-goals associated with daily life activities while the lower tier is used to recognize the tasks from different sensor events. In [21], the author proposed a framework based on identification of close proximity social behaviours. This work also focused on the movements inside a building. Sim-ilarly other multiple individual behaviour detection schemes such as group actions in meetings [12] and audio visual perception of a lecture in smart environment [18] are presented.
Most of the researchers as discussed above have focussed on routines and activity detection in indoor environments and have used short range sensors that can work only in very close vicinity and have several limitations such as short range of detection, less battery power and storage, or may not be very common that every person can use it without extra hardware. This type of sensors cannot be used for outdoor environment.
Mobile phones nowadays are an important part of modern day communication [1]; far from the pri-mary usage of sending and receiving phone calls and text messaging, today’s mobiles devices are capable of a range of activities from checking your email, surfing the web, playing games, etc. Different wireless connectivity options are available in many phones, one of the functions provided by most mobile devices is Bluetooth. Bluetooth provides short range communications and was originally intended for use in personal area networks (PANs). Although the range of Bluetooth is relatively short, the extremely high market penetration among mobile users and the fact that it provides no cost communications between physically clustered mobile users means Bluetooth provides an excellent medium for collecting informa-tion about user behaviour. Many researchers have also explored the concept of mobile phone as a sensing device and used it to get the proximity data and user’s location from cell tower ID information.
There have been several recent projects that utilise Bluetooth functionality to collect data that de-scribes the interactions of everyday life - “reality data”. Eagle and Pentland [4] use a passive running Bluetooth application to collect information about the daily interactions of 100 subjects within a univer-sity campus. They do this by recording the Bluetooth ID (BTID) of every device encountered by each user. Hermersdorf et al [17] also use Bluetooth to collect proximity data. Unlike Eagle and Pentland, they collect their data for 14 users in an office environment and demonstrated how behavioural patterns can be found in Bluetooth proximity data. They used Independent Component Analysis (ICA) to es-timate the problem. There second model demonstrated that rich Bluetooth environments can be used for positioning without any base station. Pietilainen et. al. [3] studied users with Bluetooth enabled devices in different meeting areas and designed a social interaction communication software package, MobiClique; that run on mobile phone and successfully builds a local social network. They developed three applications: epidemic news groups, adhoc social connections and asynchronous messaging.
The reality data collected in such experiments have inspired many different ways to analyse the be-haviours and social interactions that can help in detecting some unusual routines and activities of low entropy mobile people. Social proximity sensing [15, 5], social behavioural modelling and routine clas-sification and movement prediction [4, 17] are studied by the researchers. In [6] and [16], researchers have presented a framework for daily life activity recognition based on the user’s location and group affiliation. They used Author Topic Model (ATM) and hierarchical Bayesian topic models like Latent Dirichlet Analysis (LDA) for routine classification. The routines they classified are whether it is a week-day or a weekend depending upon the location of the user or the proximity information and whether the experimental subject is an engineering student or a business student. The proximity data is only classified depending upon the number of proximate devices and it does not give any information about the location of the user.
It is a challenging task to find the actual routines and activities from the Bluetooth proximity data only. This is possible once it can be proved that Bluetooth proximity data can provide us enough informa-tion about the repeated activities and daily life routines. This work is an extension of the work presented in [2], in which only one user’s data was analysed. In this paper, four different low entropy user’s data has been analysed and their results are presented in detail. It is also discussed that the techniques that are adopted in this paper can also be applied on a large dataset for the same purpose. Future work that will be based on this analysis will focus on the recognition of actual daily life activities performed by the users and to find out any unusual routines that may lead to any accidents. The techniques that are adopted to find the patterns in the Bluetooth proximity data are explained in the next section.
Mining’ project [4] to get an insight into group and individual daily human behaviours. They used Nokia 6600 mobile phones to record the data of one hundred users over the duration of nine months. Seventy-five students belong to MIT media laboratory and twenty-Seventy-five belong to the MIT Sloan business school. Different types of information were collected including phone status i.e. whether it is in use or charging or off, ID’s of Bluetooth proximate devices, usage of mobile applications, GSM cell tower ID, call and SMS logs.
Only Bluetooth proximity data was required for our research work out of all other information avail-able in the dataset. For Bluetooth proximity data, each mobile phone scanned the environment after every five minutes and made the log of all proximate Bluetooth devices (such as phones and laptops) that are in the range of 5-10m. These detected Bluetooth devices respond to the scanning with their user defined name (e.g. John’s e71), the device type (Nokia Cell Phone), and a unique twelve digit MAC address (e.g. 0021d683e904). The MAC address of each device is fixed and can be used to identify one user’s phone from another (e.g., 20 means, user number 20 out of 100 participating users), irrespective of the type and name of the device. The dataset also provides the information of the time at which any device was detected and the total time for which that device remain detected by one user. So, if a single user is taken as an example, all proximate Bluetooth devices are shown as a list of detected devices at specific timestamps by that single user and the same case applies to all other users.
3
Methodology
As mentioned earlier, the objective of this research work is to prove the concept that repeated patterns of daily life activities of low entropy people can be obtained from wireless proximity data. To achieve this objective N-gram and correlative matrix approaches are applied on the reality mining dataset [4]. Both techniques are described in detail in section 3.1 and section 3.2.
Four different low entropy users are selected for analysis in this research work. Low entropy as mentioned in [4] means they follow somewhat regular routines. Entropy of their routine activities is calculated by using Shannon’s Entropy equation given below.
H(x) =− n
∑
i=1
p(i)log2p(i) (1)
One month of Bluetooth proximity data of all the four users is taken and both N-gram and correlative matrix approaches are applied on this data. These techniques are used to find out total number of different lengths repeated patterns in the data and then the longest and most frequently detected patterns are selected for further analysis. The reason behind the selection of the longest and most frequently repeated patterns for further analysis is that these patterns most likely point towards the most probable activities that user is performing on daily, weekly or monthly basis.
3.1 N-gram Technique
The bi-gram model, for example, approximates the probability of a word given all the previous words P (wn|wn−1 1)by the conditional probability of the preceding wordP (wn|wn−1). This means when we
use a bi-gram model to predict the conditional probability of the next word, the following approximation is madeP (wn|wn−11 )≈P (wn|wn−n−N+1 1), In other words, N-gram is a fragment of length ‘n’ of a word of length ‘L’. When L=1, it is called uni-gram, L=2 is bi-gram, L=3 is tri-gram and size 4 or more is usually called N-gram. For example ‘BEHAVIOUR’ is a word of length L=9 and it has the following bigrams (n=2) and trigrams (n=3), bigrams={BE, EH, HA, AV, VI, IO, OU, UR}; trigram={BEH, EHA, HAV, AVI, VIO, IOU, OUR}.
All further N-grams can be calculated for 0<N<=L. If ‘T’ is the total number of N-grams then we can calculate ‘T’ from T=L – n+1, while it is assumed that a window of size ‘n’ is shifting one character at a time. It means if L=9 and N=2, 3, 4, 5, 6, 7, 8 then T=8, 7, 6, 5, 4, 3, 2. While detecting total number of repeated patterns, all those patterns that are complete subsets of longer patterns are not considered. Researchers have explored many areas of N-gram applications including natural language processing, detecting repeated patterns in musical compositions [16], approximately duplicate database record [22] and in large scale clustering of DNA texts [20]. Classification and similarity measure between textual documents is a common example of N-gram usage.
3.2 Correlative Matrix Technique
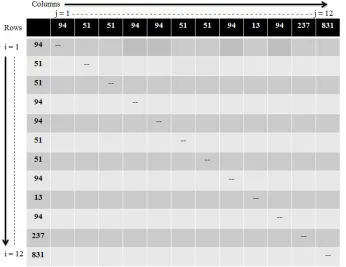
[image:6.612.134.478.504.589.2]The idea of correlative matrix approach was presented by Jia-Lien Hsu in The idea of correlative matrix approach was presented by Jia-Lien Hsu in [10]. The approach is explained here by applying on a sample stream of data (proximate Bluetooth devices) detected by one of the target users. User detected these devices during one hour time slot and in this sequence: “S=94, 51, 51, 94, 94, 51, 51, 94, 13, 94, 237, 831”. These numbers show the Bluetooth ID of proximate devices in close vicinity. Figure 1 shows the repeated patterns in this sequence. Proper sub-patterns of these repeated patterns are not included unless they appear elsewhere in the detected sequence. For example, the pattern “94, 51, 51, 94” repeated twice whereas the pattern “94, 51, 51” is a sub-pattern of “94, 51, 51, 94” and it is also repeated twice in the sequence. As “94, 51, 51” pattern appears only with the pattern “94, 51, 51, 94”, and nowhere else, it is not considered as a separate pattern and is not included in the list. However if we consider only “94 16”, it appears five times that means it also appear other than the pattern “ 94, 51, 51, 94”. This is why; “16 94” is included in the repeating patterns list.
Figure 1: Patterns and Their Repeating Frequencies from Example Sequence
matrix. Below is the explanation of constructing the correlative matrix for the above mentioned example sequence of detected proximate Bluetooth devices.
First of all, as the sequence ‘S’ has twelve detected devices in it, a 12 x 12 upper-triangular matrix will be initialised, represented byUT, shown below in Figure 2. UTi,jwill be used to represent thei-th
[image:7.612.134.480.155.422.2]row and the j-th column of the correlative matrixUT.
Figure 2: Correlative Matrix for the Example Sequence
The whole matrix will be filled row by row. Let’s take the first row. The device “94” is the first element of the sequence ‘S’ and it will be compared with all other devices in the ‘S’ one by one. If any element of the sequence (represented by Sj)becomes equal to the “94”, i.e, Sj =“94”, it means “94”
repeats again at j-th column of the first row, soUT1,jwill be set to ‘1’. For example in this case, “94”
appears at S4 , S5 , S8 , and S10. So,UT1,4 , UT1,5 , UT1,8andUT1,10 will be set to ‘1’, as shown in
Figure 3.
Now, the second row will be filled with respect to the device “51”. It is repeated at S3, S6 , and S7. UT2,3andUT2,7will be set to ‘1’ as in the row-1, but forUT2,6, the element at locationUT1,5is already
set to ‘1’, which means the sub-pattern “94, 51” appears again, soUT2,6will be set to ‘2’ as shown in
Figure 3.
Furthermore, for any two elements ‘Si‘ and ‘Sj‘ of the sequence ‘S’ where i6=j and i, j>1, if Si =
Sj, thenUTi,jwill be set toUTi−1,j−1+1. IfUTi,jhas a value ‘n’, this represents a pattern of length ‘n’
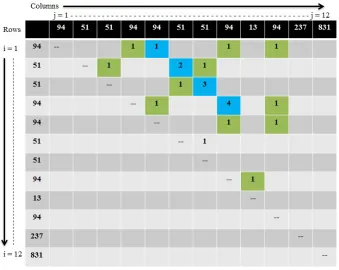
repeating at the positions ‘j – n+1’ to ‘j’ in sequence ‘S’. Figure 4 below shows the overall result of all the patterns.
Figure 3: Filling the First and second Row of the Correlative Matrix
Figure 4: After processing all Values in the Correlative Matrix
[image:8.612.136.475.378.648.2]At the start, the ‘candidate set’ is initialised as an empty set. Then respective repeated patterns and frequencies of repetition for all non-zero elementsUTi,j of theUTare calculated and inserted into the
candidate set. There are four different scenarios depending upon the value ((UTi,j =1 ) or (UTi,j>1 ))
and ((UT(i+1),(j+1)=0 ) or (UT(i+1),(j+1)6=0 )) of every non-zero elementUTi,j.
Scenario 1: (UTi,j =1 andUT(i+1),(j+1) =0). As an example, take the value ofUT1,4which is ‘1’.
This means the frequency of repetition of “94” is one. Now if we check the value ofUT2,5in Table-4,
it is zero. This means, “94” is not a part of any other pattern at this stage. Insert (“94”, 1, 0) into the ‘candidate set’.
Scenario 2: (UTi,j =1 andUT(i+1),(j+1) 6=0). Consider here the value ofUT1,5which is ‘1’. This
means the frequency of repetition of “94” is one. Now if we check the value ofUT2,6, it is not zero.
This means “94” is a part (sub-pattern) of another pattern. In this case, it is part of “95, 51”. As, “94” is already in the ‘candidate set’, the modified value for ‘candidate set’ will be (“94”, 2, 1) that shows, “94” has repeated twice and it appears as sub-pattern once.
Scenario 3: (UTi,j>1 andUT(i+1),(j+1)6=0). Consider the value ofUT2,6, which is ‘2’. This means
the sub-pattern “94, 51” and “51” repeats at this point. The value to insert into the ‘candidate set’ should be (“94, 51”, 1, 0) and (“51”, 1, 0). Now we can see that the value ofUT3,7 is ‘3’, which means the
sub-patterns “94, 51” and “51” are sub-sub-patterns of another pattern “94, 51, 51”. Thus, the modified values to insert into the candidate set should be (“94, 51”, 1, 1) and (“51”, 1, 1).
Scenario 4: (UTi,j>1 andUT(i+1),(j+1) =0). Consider the value ofUT4,8, which is ‘4’. This means
that all the four sub-patterns “94, 51, 51, 94”, “51, 51, 94”, “51, 94” and “94” repeats here. Now because UT5,9is ‘0’, it means, this pattern is not a part of any other pattern. So the value to insert into the
candidate set should be (“94, 51, 51, 94”, 1, 0), (“51, 51, 94”, 1, 1) and (“51, 94”, 1, 1). Also change (“94”, 5, 1) into (“94”, 6, 2).
After processing the whole matrix, the overall candidate set becomes{(“94”, 10, 1), (“51”, 6, 2), (“94, 51”, 1, 1), (“94, 51, 51”, 1, 1), (“51, 51”, 1, 1), (“94, 51, 51, 94”, 1, 0), (“51, 51, 94”, 1, 1) and (“51, 94”, 1,1)}. Now all those patterns that are proper sub-patterns of other patterns, and are not appeared at any other place will be removed from the ‘candidate set’. In this particular example, (“94, 51”, 1, 1), (“94, 51, 51”, 1, 1), (“51, 51”, 1, 1), (“51, 51, 94”, 1, 1) and (“51, 94”, 1, 1) will be removed from the candidate set because they are all sub-patterns of (“94, 51, 51, 94”, 1, 0).
In the next step, actual repeating frequencies should be calculated for all the repeating patterns. There are ‘10’ non-zero elements related to “94” in the whole matrix. Though, the actual repeating frequency of “94” is ‘5’, calculated by using:
repetition count= f(f−1)
2 ,where f =
1+√1+8×repetition count
2 (2)
Likewise, the repeating frequencies of “51” and “94, 51, 51, 94” are 1+
√
1+8×6
2 =4 and
1+√1+8×1
2 =
2, respectively. Next section discusses the results of pattern detection in the wireless proximity data of low entropy mobile people using above mentioned techniques.
4
Experimental Results
This section discusses the results and behaviour of four low entropy mobile people selected from the dataset, depending upon the detection of other wireless proximate devices and duration of time that these low entropy people spent with other people.
included.. As, this research work focuses on the proof of concept that repeated activity patterns can be obtained from the wireless proximity data and can be used for behaviour recognition of individuals, so the longest and most frequently repeated patterns will be considered for further analysis. These patterns indicate group based activities and routines and will be helpful in analysing the behaviour of the user. The dataset that is used in this research work is obtained from MIT reality mining project, in which stu-dents and university employees took part. So this dataset contains activities of both stustu-dents and office workers. The devices that are detected as different patterns can be in any order. Participating devices should be the same but their order can be different. For example, if we take an example of an office worker. He must detect the same office colleagues every day but their detection pattern can be in any sequence.
Figure 5: Total Number of Repeated Patterns Detected of User-1
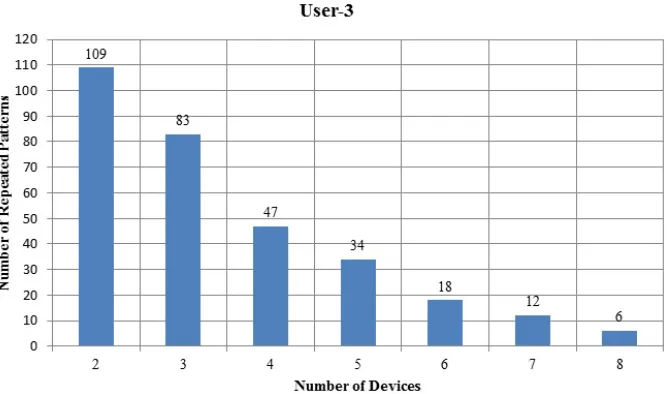
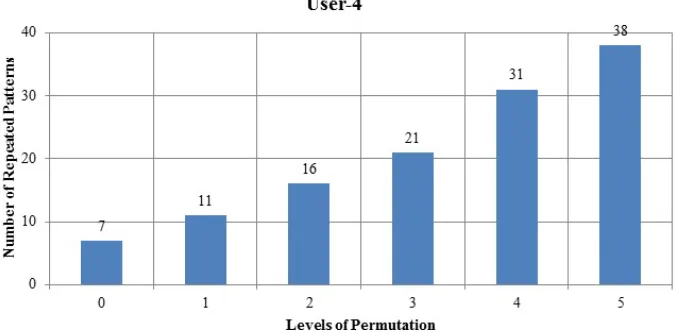
[image:10.612.141.475.496.693.2]Figure 5 shows that the longest patterns detected for User-1 consists of nine devices and there are five different patterns of nine devices. The most frequent one is that repeated five times for the whole month. For User-2 in Figure 6, there are seven different longest patterns that consist of seven devices and the most frequently repeated pattern, repeats four times. User-3 has six different patterns of eight devices and User-4 has three different patterns of seven devices shown in Figures 7 and 8 respectively. The longest and the most frequently repeated patterns of all of these users are selected for further analysis.
[image:11.612.143.477.413.591.2]Figure 7: Total Number of Repeated Patterns Detected of User-3
Figure 8: Total Number of Repeated Patterns Detected of User-4
interaction indicates that the elderly person comes in social centre, meets his colleagues and stay there for specific time duration. However, daily patterns of spatial and temporal detections may differ as a result of his physical movement, absenteeism of other colleagues and the presence of new people. Therefore, using different levels of variations allows the detection of behaviour even when some temporary devices, like visitors are also detected. If this variation should be allowed in pattern detection, there can be many more detectable patterns that can represent the same activity.
[image:12.612.139.475.430.598.2]Figure 9: Combinatorial Analysis of Longest and Most Frequently Repeated Patterns of User-1
Figure 10: Combinatorial Analysis of Longest and Most Frequently Repeated Patterns of User-2
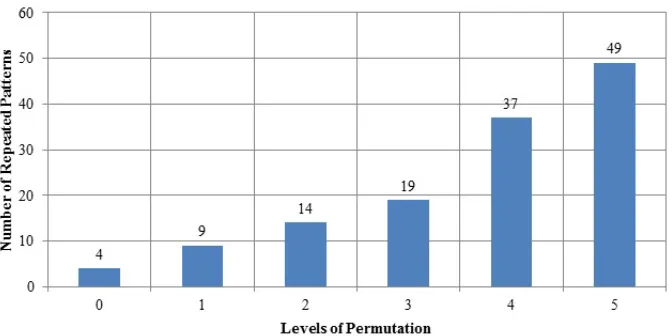
Figure 11: Combinatorial Analysis of Longest and Most Frequently Repeated Patterns of User-3
Figure 12: Combinatorial Analysis of Longest and Most Frequently Repeated Patterns of User-4
This increase in the frequency of repeated patterns is because the window for the fixed repeated pattern has been compressed and the remaining devices are allowed to combine in any order. The maximum level of permutation is seven for User-1, because the length of the pattern under analysis is nine and analysing additional levels of permutation would be unhelpful as it will not indicate any behavioural patterns. Same analysis is done with other users as well and different patterns obtained in this analysis are shown in Figures 9, 10, 11 and 12.
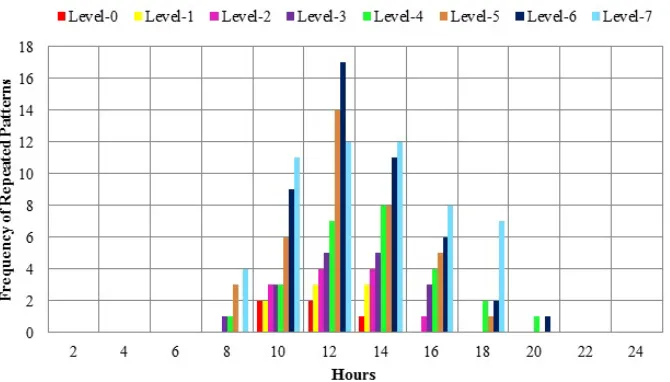
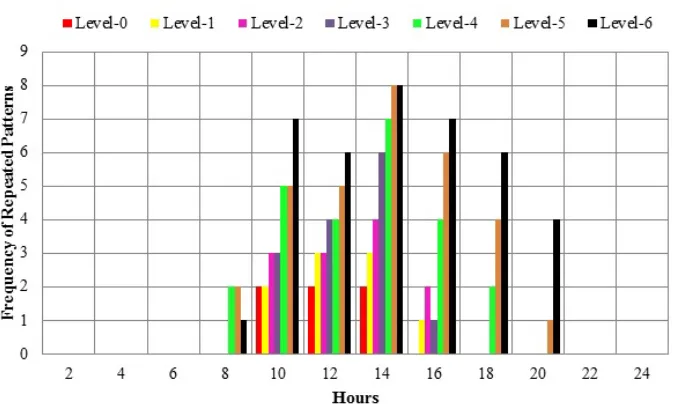
The results discussed so far have shown that some repeated activities have been performed by low entropy individuals during the whole month. Time of repeated activities is very important in order to understand the behaviour of individuals. Objective here is to find at what time of the day users are performing these repeated activity. This will help to analyse the routine of the users. Figures 13, 14, 15 and 16 show the frequency of the repeated patterns, obtained during the combinatorial analysis of the longest and most frequent patterns with different levels of permutation, in specific hours of the day for the whole month.
[image:13.612.137.479.300.467.2]Figure 13: Frequencies of Repeated Patterns in Specific Hours with Different Levels of Permutation of User-1
Figure 14: Frequencies of Repeated Patterns in Specific Hours with Different Levels of Permutation of User-2
Most of these repeated patterns occur between 10am – 6pm. These figures also show that between 12pm – 4pm the detection of Bluetooth devices increases and activities reach at their peak. This can be because of the reason that most of the workers and students remain present at the campus during these working hours. These results also show that it is most likely that the same routine activities are performed by the individuals during these hours of the day.
Figure 15: Frequencies of Repeated Patterns in Specific Hours with Different Levels of Permutation of User-3
Figure 16: Frequencies of Repeated Patterns in Specific Hours with Different Levels of Permutation of User-4
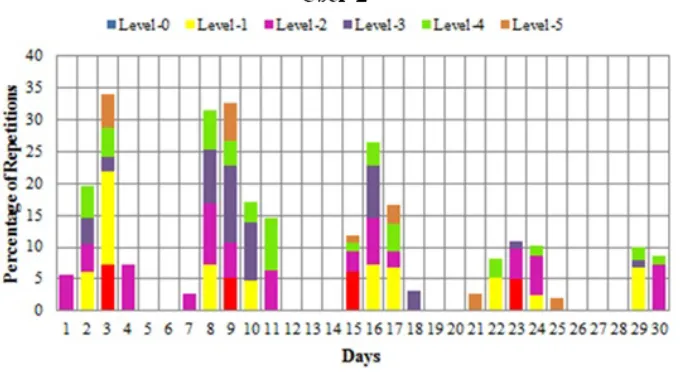
[image:15.612.140.474.366.561.2]in different days. As it is a common observation that repeated activities are less likely to be detected during the sleep hours in the night, a reasonable amount of percentage of time occupied in the repeated activities during the day time is detected.
Figure 17: Percentage of Repetitions of Patterns per Day with Different Permutation Levels of User-1
Figure 18: Percentage of Repetitions of Patterns per Day with Different Permutation Levels of User-2
Above analysis was done on the longest and the most frequently detected patterns in one month data of the target users. Same analysis was done on the next longest and most repeated patterns and results showed that by adding it with the previous patterns, it increased the percentage of repetitions per day by 21.3 %, 13.7%, 19.3% and 14.1% for the User-1, User-2, User-3 and User-4 respectively for the whole month. It has also shown some different days with more percentage of time occupied in repeated activities. This means it is more likely that the remaining patterns will also increase the percentage of repetitions per day.
[image:16.612.137.477.378.565.2]Figure 19: Percentage of Repetitions of Patterns per Day with Different Permutation Levels of User-3
Figure 20: Percentage of Repetitions of Patterns per Day with Different Permutation Levels of User-4
library and cafeteria in break times. During all these activities, the user will detect different proximate devices. Some of his colleagues can be part of more than one activity. This means the user will detect those devices at more than one places and different time stamps. This likely indicates that identification of such devices can help in analysis of the behaviour and recognition of actual activities of low entropy mobile users in later stages.
5
Summary and Future Work
[image:17.612.137.474.320.507.2]patterns indicate some regular activities that users are likely performing on daily and weekly basis and these activities spans a reasonable amount of time during the working day.
This research work indicates that wireless (e.g. Bluetooth) proximity data can be used to infer the behaviour and daily routine patterns of low entropy mobile people though only four low entropy user’s data has been analysed. In the future work, we will apply these techniques to the whole dataset and try to recognise the actual activities performed by the users by classifying the proximity data into different locations that will further aid in recognising the high level activities of the users. We will also consider classifying the location and activity data with respect to time scale as it will help to analyse and predict the behaviour of the users in more detail. An important application of this research work will be to detect and predict the unusual activities and behaviour of low entropy people such as elderly people and early stages of dementia patients.
References
References
[1] It facts mobile phone usage. http://www.itfacts.biz/45-bln-mobile-users-by-2013/12414, last viewed April, 2012.
[2] Muhammad Awais Azam, Jonathan Loo, Abubaker Lasebae, Sardar Kashif Ashraf Khan, and Waleed Ejaz. Behavioural analysis of low entropy people using contextual information. Proceedings of 2012 IEEE In-ternational Conference on Pervasive Computing and Communications Workshops, Page(s): 590-595, 19-23 March, Lugano, 2012.
[3] Nathan Eagle. Machine perception and learning of complex social systems. Ph.D. Thesis, Program in Media Arts and Sciences, MIT, June, 2005.
[4] Nathan Eagle and Alex Pentland. Reality mining: sensing complex social systems. Personal and Ubiquitous Computing 2006 – Springer, Volume 10, Issue 4, page(s): 255-268, 2006.
[5] Katayoun Farrahi and Danial Gatica-Perez. Daily routine classification from mobile phone data. In Popescu-Belis, A., Stiefelhagen, R. (eds.) MLMI 2008. LNCS, Volume 5237, Page(s): 173–184. Springer, Heidelberg, 2008.
[6] Katayoun Farrahi and Danial Gatica-Perez. What did you do today? discovering daily routines from large-scale mobile data. In MM 2008: Proceeding of the 16th ACM international conference on Multimedia, Page(s): 849–852. ACM, New York, 2008.
[7] Thomas M. Gill, Mayur M. Desai, Evelyne A. Gahbauer, and Theodore R. Holford. Restricted-activity among community-living older persons: Incidence, participants, and health care utilization. http://www. annals.org/content/135/5/313.full.pdf+html, Annals of Internal Medicine.
[8] Kousuke Hara, Takashi Omori, and Reiko Ueno. Detection of unusual human behaviour in intelligent house. Proceedings of 12th IEEE workshop on Neural Networks for Signal Processing, Page(s): 697-706, 2002. [9] Marion Hermersdorf, Heli Nyholm, Jukka Perkio, Ville Tuulos, Jukka Salminen, and Henry Tirri. Sensing in
rich bluetooth environments. Proceedings of the Workshop on WorldSensorWeb, SenSys, 2006.
[10] Jia-Lien Hsu, Chih-Chin Liu, and Arbee L. Chen. Efficient repeating pattern finding in music databases. In Proceedings of the 1998 ACM 7th International Conference on Information and Knowledge Management, page(s) 281–288. Association of Computing Machinery., 1998.
[11] Daniel Jurafsky and James H. Martin. Chapter 4, n-grams. 2nd Edition, Speech and Language Processing: An introduction to speech recognition, computational linguistics and natural language processing, January, 2007.
[12] Iain McCowan, Daniel Gatica-Perez, Samy Bengio, and Guillaume Lathoud. Automatic analysis of multi-modal group actions in meetings. IEEE Transactions on Pattern Analysis and Machine Intelligence (T-PAMI) 27(3), 305–317, 2005.
[14] Usman Naeem and John Bigham. Activity recognition using a hierarchical framework. Ambient Technolo-gies for Diagnosing and Monitoring Chronic Patients Workshop, Tampere, Finland, 29thof January, 2008.
[15] Tom Nicolai, Nils Behrens, and Eiko Yoneki. Wireless rope: Experiment in social proximity sensing with bluetooth. In fourth annual IEEE International Conference on Pervasive Computing, LNCS 4277, 2006. [16] Nikunj Patel and Padma Mundur. An n-gram based approach to finding the repeating patterns in musical
data. In proceedings of European Internet and Multimedia Systems and Applications (EuroIMSA), Track 462-171, February 21-23, 2005.
[17] Anna-Kaisa Pietilainen, Earl Oliver, Jason LeBrun, George Varghese, Jon Crowcroft, and Christophe Diot. Experiments in mobile social networking. Technical Report CR-PRL-2008-02-0003, Thomson, February, 2008.
[18] R. Stiefelhagen, K. Bernardin, H. K. Ekenel, J. McDonough, K. Nickel, M. Voit, and M. Woelfel. Audio-visual perception of a lecturer in a smart seminar room. In: Signal Processing - Special Issue on Multimodal Interfaces, vol. 86 (12). Elsevier, Amsterdam, 2006.
[19] Albert Kai sun Wong, Tim Kam Woo, Albert Ting-Leung Lee, Xiaoming Xiao, and Vincent Wing-Hei Luk. An agps-based elderly tracking system. Proceedings of First International Conference on Ubiquitous and Future Networks (ICUFN), page(s) 100-105, Hong Kong, 2009.
[20] Zeev Volkovich, Valery Kirzhner, Alexander Bolshoy, Eviatar Nevo, and Abraham Korol. The method of n-grams in large-scale clustering of dna texts. The Journal of Pattern Recognition Society, Volume 38, Issue # 11, Page(s) 1902-1912, November, 2005.
[21] Christopher Wren, Yuri Ivanov, Ishwinder Kaur, Darren Leigh, and Jonathan Westhues. Socialmotion: Mea-suring the hidden social life of a building. In: J. Hightower, B. Schiele, and T. Strang, (eds.) LoCA 2007. LNCS, vol. 4718, page(s) 85–102. Springer, Heidelberg, 2007.