http://dx.doi.org/10.4236/jsip.2014.54012
Rebound of Region of Interest (RROI), a New
Kernel-Based Algorithm for Video Object
Tracking Applications
Andres Alarcon Ramirez, Mohamed Chouikha
Department of Electrical and Computer Engineering, Howard University, Washington DC, USA Email: [email protected], [email protected]
Received 2 August 2014; revised 1 September 2014; accepted 27 September 2014
Copyright © 2014 by authors and Scientific Research Publishing Inc.
This work is licensed under the Creative Commons Attribution International License (CC BY). http://creativecommons.org/licenses/by/4.0/
Abstract
This paper presents a new kernel-based algorithm for video object tracking called rebound of re-gion of interest (RROI). The novel algorithm uses a rectangle-shaped section as rere-gion of interest (ROI) to represent and track specific objects in videos. The proposed algorithm is constituted by two stages. The first stage seeks to determine the direction of the object’s motion by analyzing the changing regions around the object being tracked between two consecutive frames. Once the di-rection of the object’s motion has been predicted, it is initialized an iterative process that seeks to minimize a function of dissimilarity in order to find the location of the object being tracked in the next frame. The main advantage of the proposed algorithm is that, unlike existing kernel-based methods, it is immune to highly cluttered conditions. The results obtained by the proposed algo-rithm show that the tracking process was successfully carried out for a set of color videos with different challenging conditions such as occlusion, illumination changes, cluttered conditions, and object scale changes.
Keywords
Video Object Tracking, Cluttered Conditions, Kernel-Based Algorithm
1. Introduction
Regularly, these object tracking algorithms use and correlate many pre-processing tasks, such as motion estima-tion and image segmentaestima-tion.
The process of tracking an object in a sequence of frames is directly dependant on the object representation being used. Some representations, for example, use interest points to identify the object to be tracked [4]. These interest points can be detected by using information based on differentiation operators [5] [6], where changes in intensity between two adjacent pixels can emphasize the boundaries of the object of interest in the image. Other object representations use the object’s silhouette or object’s contour to extract information about the general shape of the object [7] [8].
Cross-correlation [9], on the other hand, was used to implement a face tracking algorithm for video confe-rencing environment. This method compares a region of the image with a known signal extracted from the object of interest, and then a measure of similarity is used to determine the exact position of the object being tracked in the next frame.
Aggarwal et al.[10] presented a methodology for video object tracking that was constituted by four steps, namely, background subtraction, candidate object identification, target object selection, and motion interpolation. Hossein and Bajie proposed a framework [11] for tracking moving objects based on spatio-temporal Markov Random field, and where were taken into account the spatial and temporal aspects of the object’s motion. Chun-Te
et al.[12] used projected gradient to help multiple inter-related kernels in finding the best match during tracking under predefined constraints.
The main advantage of the proposed algorithm isthat unlike existing kernel-based methods it is immune to highly cluttered conditions. Our strategy is based on the analyses of the changes that occur within the object be-ing tracked, itself, ignorbe-ing the high variability that commonly is presented in the environment that surrounds the object being tracked. This novel strategy makes our algorithm more robust than the existing kernel-based methods in cluttered conditions.
This paper is organized as follows: In Section 2, we present the novel proposed algorithm to track an object through video sequences. In Section 3, it is shown the obtained results. Finally, Section 4 presents the conclu-sions of this work.
2. Description of the Proposed Algorithm
Two important stages constitute the proposed algorithm, namely, the motion estimation stage and the matching estimation stage. The first stage seeks to obtain an estimation of the direction of the object’s motion. The latter stage determines the location of the object being tracked in the next frame by evaluating a function of dissimi-larity.
2.1. Motion Estimation Stage
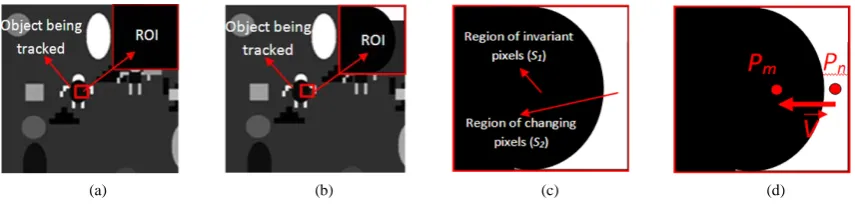
The motion estimation stage seeks to obtain an educated guess of the direction of the object’s motion. To do this, it is used a square section called region of interest (ROI) to represent the object being tracked. Additionally, the ROI, which is placed in the object being tracked in the current frame, is also located in the same position but in next frame. Then, it is analyzed the changing pixels in the ROIs to estimate the direction of the object’s motion. As a way of explaining the proposed algorithm, it is shown in the Figure 1(a) the current frame of a virtual video where the object to be tracked is represented by a region of interest. In the same way, the Figure 1(b)
[image:2.595.100.528.593.695.2]
(a) (b) (c) (d)
shows the next frame of the video where the object is moved three pixels to the right. As consequence of the ob-ject’s motion between these two frames, some of the pixels that initially belong to the object in the first ROI turn into pixels that are part of the background in the second ROI. These pixels are called changing pixels. On the other hand, the pixels that belong to the object in the first ROI as well as in the second ROI are called invariant pixels. The proposed methodology initially seeks to generate a binary image such as the one shown in the Fig-ure 1(c), where it is distinguish the changing pixels from the invariant pixels in the regions of interest. Then, it is obtained an educated guess of the direction of the object’s motion by conducting a geometrical analysis over the regions that corresponds to both the changing and the invariant pixels.
To distinguish the changing pixels from the invariant pixels in the regions of interest, it is initially subtracted the second ROI from the first ROI. Thus, it is created a new image where the changing pixels are enhanced with respect to the invariant pixels. In other words, the changing pixels in this new image have greater values in magnitude than the invariant pixels. Additionally, the pixels located in the central zone of the new image have more chances of being part of the invariant pixels than the pixels located in the outer side of the new image. Therefore, it is used the weighted mean as well as the weighted standard deviation, which emphasizes the cen- tral pixels and less importance on the outer pixels in the image, to characterize the invariant pixels in the image and obtain a threshold that allows us to distinguish the invariant pixels from the changing pixels in the new im-age.
To calculate the weighted mean of the image’s pixels obtained after subtracting the second ROI from the first ROI, it is used a truncated Gaussian mask that contains the weights that are used to give more importance to the pixels located in the center part of the new image, and less weight to the extreme pixels of this image. The weighted mean is defined by the following equation:
(
) (
)
(
)
1 1 1 1 , , , L Ti j i j
i j L T
i j i j
F x y G x y
G x y
µ = =
= =
∗
=
∑∑
∑∑
(1)where F
( )
: represents the new image, and G is a Gaussian mask defined by the following equation:(
)
( )
(
(
2 2)
2( 2)2)
1
, e
2π 2
x y L
i j
G x y
L
− +
= ∗
∗ (2)
The parameter
(
L 2)
, which represents the standard deviation of the Gaussian distribution, is the half of the width of the image. Additionally, it is also calculated the weighted standard deviation such as follows:(
)
(
(
)
)
(
)
2 1 1 2 1 1 , , , L Ti j i j
i j
L T
i ji i j
G x y F x y
G x y
µ
σ = =
= =
∗ −
=
∑∑
∑∑
(3)The weighted mean and the weighted standard deviation are used to define the values of two thresholds. These thresholds allow us to classify the new image into two classes, namely, the changing pixels and the inva-riant pixels. Finally, as result of the classification process, it is created a binary image such as the one shown in the Figure 1(c). Then, this binary image is used to estimate the direction of the object’s motion between the current and the next frame. The new binary image is defined by the following Equation:
(
)
0 if ,(
)
,
1 otherwise
i i i i
k F x y k
Y x y = − ∗ <σ − < ∗µ σ
(4)
where the parameter k, which is a limit that defines the number of standard deviations that are used to discri-minate between the two existing classes, is set to 3.
In order to determine the direction of the object’s motion between the current and the next frame, it is consti-tuted two sets of pixels such as follows:
( ) ( )
{
}
1 , , 0
S = x y Y x y > (5) where Y
( )
. is the image obtained from the Equation (4). Thus, the set, S1, represents the coordinates from the pixels that initially belong to the object being tracked in the first ROI, but that turn into background pixels in the second ROI. The second set is constituted by the coordinates of those pixels that are part of the background in the first and the second region of interest, and it is defined by the following Equation:( ) ( )
{
}
2 , , 0
S = x y Y x y = (6) The groups of pixels which constitute the sets, S1 and S2, are shown in the Figure 1(c).
On the other hand, if we use the Equation (7) to calculate the average of the coordinates that constitute the group, S1, which was defined by the Equation (5), we will obtain the point, Pn, which represents the centroid of the group, S1. In the same way, the centroid of the group, S2, which is represented by the point, Pm, is calculated using the Equation (8). The locations of the centroids, Pn and Pm, in the region of interest are shown in the Figure 1(d).
(
)
(
)
( , ) 1
1
, ,
i i
N
n n n i i
x y S
P x y x y
N ∈
= = ∗
∑
(7)(
)
(
)
( , ) 2
1
, ,
i i
N
m n n i i
x y S
P x y x y
N ∈
= = ∗
∑
(8)The two points, which correspond to the centroids of the sets, S1 and S2, constitute a vector whose direc-tion determines the orientadirec-tion of the object’s modirec-tion. In other words, the vector which connects the centroid,
n
P , to the centroid, Pm, is an educated guess of the direction of the object’s motion between the current and the next frame. This vector, which is shown in theFigure 1(d), is defined by the following Equation.
m n
P P
= −
V (9) Finally, the angle of the vector which determines the direction of the object’s motion is calculated using the Equation (10).
( )
angle
I
θ= V (10)
2.2. Minimization Stage
Once the direction of the object’s motion has been established, it is started a minimization process which seeks to determine the location of the object being tracked in the next frame (second frame). To do this, it is used the region of interest defined in the current frame (first frame), R1. This region of interest is located totally inside the object being. At the same time, it is defined in the second frame a second region of interest, R∗, with the
same shape, size, and location of the first region of interest used in the current frame. During the minimization process, the region of interest, R∗, is displaced at discrete steps in the second frame following the direction of
the object’s motion that was previously estimated in the motion estimation stage. The Equations (11) and the Equation (12) define the movement of the region of interest, R∗, in the second frame.
( )
cos
x j θ
∆ = ∗ (11)
( )
sin
y j θ
∆ = ∗ (12)
where, j, is an integer which takes the values of 0, 1, 2, , S. The parameter, S, is a constant that represents the maximum possible displacement of the object being tracked; the value of the constant “S” is de-fined by the user and depends on the nature of the video being processed. Finally, the parameter, θ, is calcu-lated using the Equation (10).
On the other hand, at each iteration of the minimization process that seeks to establish the displacement of the object being tracked, the region of interest, R∗, located in the second frame is compared with the region of
(
)
(
1(
)
(
)
)
1, , ,
L
i i i i
i
M x y U R x y R x x y y
=
∆ ∆ =
∑
− ∗ + ∆ + ∆ (13)where the parameter, L, represents the number of pixels which constitutes the region of interest, R1. The func-tion, U
( )
. , is defined by the Equation (14).( )
00 otherwise
x k x k
U x x
σ µ σ
= − ∗ < − < ∗
= ≠
(14)
where, the parameters µ and
σ
are defined by the Equation (1) and the Equation (3) respectively. Addition-ally, the constant k is set to 3. On the other hand, the function, M( )
. , depends on the parameters, ∆x andy
∆ , that correspond to the horizontal and vertical displacements of the second region of interest, R∗. Finally, it
is selected the pair of values for ∆x and ∆y that minimizes the function of dissimilarity, M
( )
. .At the end of the process of minimization, the region of interest in the next frame is updated to the new loca-tion defined by the pair of values, ∆x and ∆y,that minimizes the function of dissimilarity, M
( )
. ,such as follows:i i
Y = + ∆Y y (15)
i i
X =X + ∆x (16) where the pair of coordinates, Xi and Yi, corresponds to the location of the center of the region of interest in the next frame.
3. Experiments and Results
The proposed algorithm was tested over more than 2290 frames (of the video sequences “store”, “plane”, “train”, “crowd”.) from the PETS 2006 dataset [13] and YouTube videos. The results showed the reliability of the pro-posed algorithm in a variety of challenging conditions such as occlusion, crowded scenes, illumination changes, and camera movements.
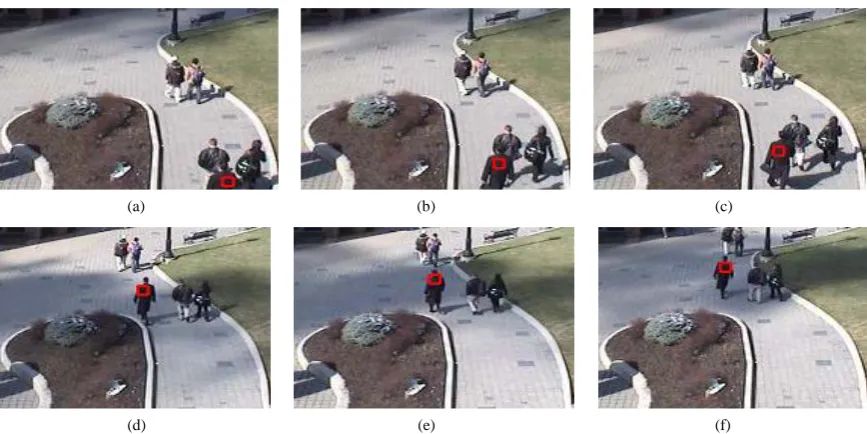
Initially, it is defined a region of interest, R, in the first frame of the video. This region is placed in such a way that it is completely inside the object to be tracked. Then, the proposed algorithm updates automatically the lo-cation of this region of interest for all the remaining frames of the video sequence. Different urban scenarios were used for testing, and some of the results obtained for these testing videos are shown from the Figures 2-5.
(a) (b) (c)
[image:5.595.90.539.468.695.2]
(d) (e) (f)
(a) (b) (c)
(d) (e) (f)
Figure 3. Tracking results for the “Store” sequence. (a) 1th frame; (b) 90th frame; (c) 280th frame; (d) 410th frame; (e) 510th frame; (f) 510th frame.
(a) (b) (c) (d)
Figure 4. Tracking results for the “Plane” sequence. (a) 1th frame; (b) 250th frame; (c) 450th frame; (d) 550th frame.
[image:6.595.97.531.81.298.2](a) (b) (c)
Figure 5. Tracking results for the “Crowd” sequence. (a) 1th frame; (b) 300th frame; (c) 640th frame.
Figure 2 shows a set of frames from a video sequence recorded in a train station with a total number of frames of 450. On the other hand, the pedestrian to be tracked corresponds to a woman who is wandering around. She is selected in the first frame by placing in her a square-shape region of 10 × 10 pixels. The selected pede-strian is occluded by another person who is walking in the opposite direction to her from the 50th to 180th frame in the video sequence.
[image:6.595.91.538.327.576.2]could be successfully tracked under illumination changes and object-size changes.
The video shown in the Figure 4 presents a set of frames where the object to be tracked corresponds to an airplane. The size of the region of interest used to track the airplane in the video is of 20 × 20 pixels. The num-ber of frames used to test the proposed algorithm was 550.As can be seen in Figure 4, the object is reliably tracked under object scale variation, rotation, and camera movement.
Finally, the Figure 5, on the other hand, shows the tracking of a pedestrian who is crossing the street in a crowded intersection in Tokyo, Japan. The number of frames that constitute the video sequence is 640. At the first frame of the video, it is defined a square-shaped region of 7 × 7 pixels that is used to represent the pede-strian to be tracked.
4. Conclusion
This paper proposes a new algorithm for tracking of objects in video sequences. The new method is based on re-gions of interest that ignore much of the variability in the environment which surrounds the object being tracked. The proposed algorithm was tested under a wide variety of scenarios. Results show that the propose algorithm can reliably track an object under several challenging conditions such as occlusion, camera movements, illumi-nation changes, crowded scenes, and object scale variations.
References
[1] Foresti, G.L. (1999) Object Recognition and Tracking for Remote Video Surveillance. IEEE Transactions on Circuits and Systems for Video Technology, 9, 1045-1062. http://dx.doi.org/10.1109/76.795058
[2] Lipton, A.J., Fujiyoshi, H. and Patil, R.S. (1998) Moving Target Classification and Tracking from Real-Time Video.
Proceedings of the Fourth IEEE Workshop on Applications of Computer Vision, 8-14.
[3] Li, Y., Goshtasby, A. and Garcia, O. (2000) Detecting and Tracking Human Faces in Videos. Proceeding of the ICPR’00, 1, 807-810.
[4] Gabriel, P., Hayet, J.-B., Piater, J. and Verly, J. (2005) Object Tracking Using Color Interest Points. IEEE Conference on Advanced Video and Signal Based Surveillance.
[5] Harris, C. and Stephens, M. (1988) A Combined Corner and Edge Detector. The 4th Alvey Conference, 147-151. [6] Koenderink, J.J. and Van Doorn, A.J. (1987) Representation of Local Geometry in the Visual System. Biological
Cy-bernectics, 55, 367-375.
[7] Haritaoglu, I., Harwood, D. and Davis, L. (2000) Real-Time Surveillance of People and Their Activities. IEEE Trans-actions on Pattern Analysis and Machine Intelligence, 22, 8. http://dx.doi.org/10.1109/34.868683
[8] Sato, K. and Aggarwal, J. (2004) Temporal Spatio-Velocity Transform and Its Application to Tracking and Interaction.
Computer Vision and Image Understanding, 96, 100-128. http://dx.doi.org/10.1016/j.cviu.2004.02.003
[9] Sebastian, P. and Voon, Y.V. (2007) Tracking Using Normalized Cross Correlation and Color Space. International Conference on Intelligence and Advanced System.
[10] Aggarwal, A., Biswas, S., Singh, S., Sural, S. and Majumdar, A.K. (2006) Object Tracking. Using Background Sub-traction and Motion Estimation in MPEG Videos. ACCV, LNCS, 3852, 121-130.
[11] Khatoonabadi, S.H. and Bajic, I.V. (2013) Video Object Tracking in the Compressed Domain Using Spatio-Temporal Markov Random Fields. IEEE Transaction on Image Processing, 22, 300-313.
http://dx.doi.org/10.1109/TIP.2012.2214049
[12] Chu, C.-T., Hwang, J.-N., Pai, H.-I. and Lan, K.-M. (2011) Robust Video Object Tracking Based on Multiple Kernels with Projected Gradients. ICASSP.