Formulating a Mathematical Model for the E-Nose
Application through Genetic Algorithm (GA)
Krishnamurthy Nayak
Research Scholar Dr. MGR University, Chennai Asst Professor, Dept of ECE,
MIT Manipal Manipal University
Deccaraman M
Dean,
Department of Industrial Biotechnology Dr. MGR University, Chennai
Vijayashree Nayak
Asst. professor, Department of Biological
Sciences BITS Pilani, Goa
ABSTRACT
From a technical and commercial point of view it is found that electronic sensing technologies have emerged significant progresses over the last few decades. The potentiality of reproducing human senses by sensor arrays and pattern recognition systems is termed as electronic sensing. E-Nose provides an industry-specific management resolution for the perpetual and real-time monitoring of environmental odor and air quality resulting in higher profit and improved community relations. The device constitutes arrays of effective and rapid acting chemical sensors, supplemented by patented electronics and software. Chemicals in the air are identified by the sensor arrays, registering complex odor images in real time. By means of wireless connection or lines a permanent record is sent to the computer, where it is detected, computed and alarms for inconsistent events were sent or else it can be indicated by some displacement. Electronic nose instruments are exploited by research and development laboratories, quality control laboratories, process & production department’s of environmental protection, all these are done for the detection of volatile organic compounds in air, water and soil samples, and the measurement and comparison of the effects of manufacturing process on products are also determined. In this paper, An E-Nose is proposed to identify the gas component. For this process, the soft computing technique called Genetic algorithm is used. This provides an optimized weight to identify the gas component by means of the input concentration range and SMAC/hr (units in ppm). The intended Technique is evaluated with different training samples and results are produced.
Keywords
Electronic nose, odor, electronic sensing, concentration range and SMAC, volatile organic compounds, Genetic algorithm (GA).
1. INTRODUCTION
Nowadays, sensor for gaseous molecules plays a significant role in monitoring the environment, controlling chemical processes, and in medical applications. Electronic Nose (E-nose) is a device used to detect and identify the odors/vapors. Although it has been in the market for several years, its size is large and also it is high-priced [3]. In an ever-growing world, the electronic devices are duplicating every other sense of perception; the sense of smell is lagging behind. But still, there has been a significant increase in the need for detecting odors, to replace the human job of sensing and quantification. Several important applications fall in the category where humans cannot meet the risk in smelling the substance.
In many fields, the detection of volatile organic compounds (VOCs) has become a serious task as the fast evaporation rate and toxic nature of VOCs and working close to human life
could be dangerous at high concentration levels in air for the health of human beings. In fact, the VOCs are also considered as the main reason for allergic pathologies, skin, and lung diseases [7]. Some necessary applications such as continuous monitoring, medical applications, etc., allow humans to perform tasks that were once considered as unfeasible. The fast paced technology has helped to develop sophisticated devices that have brought the electronic nose to small sizes with superior capabilities. The trend is such that there will be precise, qualitative, and quantitative measurements of odor in the near future. The growth of gas sensors is a field of great activity. Especially, the electronic noses are used for process control, quality control in the food and beverage industry, pollution monitoring, and airport security. [1]
Unpleasant odor or malodor has been regarded as an indicator of potential risks to human health but not necessarily the direct trigger of health effects. Thus, development of E-nose for medical diagnostics has become one of the important issues in the biomedical engineering research now days [2]. Electrical properties will be changed when the sensors react with odorant [3]. A chief concern of scientists is global warming, largely due to huge emissions of carbon dioxide (CO2) which is considered as one of the main greenhouse gases inducing a warming climate, CO2 concentration in the atmosphere is under special analysis of many weather services in the world. Suburban areas continue to grow rapidly and are potentially an important land-use category for anthropogenic carbon-dioxide emissions [4]. The core component of an E-Nose is an array of non-specific chemical sensors. An odor examines and stimulates many of the sensors in the array and extracts characteristic response pattern. The sensors inside e-Nose can be made up of various technologies, but in all cases certain physical property are to be measured and a set of signals is generated [6]. It consists of a set of different gas sensors which can detect different toxic gasses. Output of sensor array is connected with encoder circuit and gas sensors often respond to an open range of gas species and are therefore only partially selective [5]. Generally, source localization is done by the support of electronic nose and mobile vehicles since robotic techniques are getting mature. However, certain problems could occur during specific situations, such as instantaneous emission and complex landscape environment [8]. If gas sensor array discovers any toxic gasses of dangerous level of lethal concentration, then processor will switch on the exhaust fan in the laboratory [5]. The toxin gasses in the room are to be collected in a proper manner and should be removed by means of appropriate techniques.
2. GENETIC ALGORITHM
biological evolution is a stochastic search algorithm [17]. GAs has become substantial as they are formulated by promising search and optimization methods for complex engineering optimization problems. GA is used to grasp the intention of availability, allowing for installation and upholding expenses [19]. GAs are used for simulating the natural genetic operators in parallel with global search techniques [20].
Crossover and mutation are two frequently used genetic operators. Crossover is a mixing operator that combines genetic material from chosen parents. Mutation behaves as a background operator and is applied to find the unexplored search space by arbitrarily altering the values at one or more locations of the chosen chromosome [21]. Selection is a technique for choosing individuals (strings) for reproduction consisting with their fitness [22]. Genetic algorithm automatically obtains and stores the required knowledge related to the search space during its search process as Compared to that of the conventional search algorithms which requires certain external forces. Moreover, GE self-adaptively handles the whole search process by means of random optimization technique [23]. GA requires more memory but it works faster than the Simulated Annealing Algorithm [18].
Spacecraft Maximum Allowable Concentrations
SMACs provide guidance on chemical exposures during both normal as well as emergency operations in aboard spacecraft. Generally SMAC comprise of short term and long term, in short term SMACs the concentrations of airborne substances such as a gas and vapor does not comprises the concert of precise errands by astronauts during emergency conditions or cause severe toxic effects in long term SMACs are intended to avoid adverse health effects and to prevent any noticeable changes in the crews’ concert under continuous exposure to chemicals for as long as 180 days
Data needed for developing the SMACs in Astronautically hygiene comprised of
Chemical-physical characterization of the toxic chemical
Animal toxicity studies
Human clinical studies
Accidental human exposures
Epidemiological studies
In-vitro toxicity studies
3. RELATED RECENT RESEARCHES: A
REVIEW
David C. Wedge et al. [9] have discussed that Electronic noses (e-noses) are increasingly being used as vapour sensors in a wide range of application areas. E-noses made up of arrays of organic field-effect transistors (OFETs) are particularly valuable due to the range and diversity of the information which they provide concerning analyst binding. Their study has demonstrated that arrays of OFETs, when combined with a data analysis technique using Genetic Programming (GP), can selectively detect airborne analysts in real time. The use of multiple parameters – on resistance, off current and mobility – collected from multiple transistors coated with different semiconducting polymers has given dramatic improvements in the sensitivity (true positive rate), specificity (true negative rate), and speed of sensing. Computer-controlled data collection allows the identification of analytes in real-time, with a time-lag between exposure and detection of the order of 4s.
Chatchawal Wongchoosuk et al. [10] have described a portable electronic nose (E-nose) which is based on hybrid carbon nanotube-SnO2 gas sensors. The hybrid gas sensors have been fabricated using electron beam (E-beam) evaporation by means
techniques including integral and primary derivative, which lead to higher classification performance as compared to the classical features (ΔR and ΔR/R0). It was shown that the doping of carbon nano tube (CNT) has improved the sensitivity of hybrid gas sensors, while the quantity of CNT has a direct effect on the selectivity to volatile organic compounds, i.e., methanol (MeOH) and ethanol (EtOH). The real-world applications of this E-nose have also been demonstrated. Based on the proposed methods, this instrument can monitor and classify 1vol % of MeOH contamination in whiskeys.
Muhammad Rivai et al. [11] have presented a type of odor identification system, which combines gas chromatography (GC) and electronic nose techniques. The system comprises a GC column and a 10-MHz quartz crystal microbalance sensor producing a unique pattern for an odor in time domain. The proposed method has offered the advantages of substantially reduced size, interferences, and power consumption in comparison to existing odor identification system. Several odors of organic compounds have been introduced to judge the selectivity of the system. Principle component analysis method has been used to visualize the classification of each odor in two-dimensional space. The proposed system could resolve common organic solvents, including molecules of different classes (aromatic from alcohols) as well as those within a particular class (methanol from ethanol) and also fuels (premium from pertamax). The neural network can be taught to recognize the odors tested in the experiment with identification rate of 85%. Therefore, the system has taken the place of human nose, especially for poisonous odor evaluations.
Nowadays, electronic noses (E-nose) become popular in industry. There are a few types of E-noses which are used to detect odorant and gases such as surface acoustic wave (SAW) device, optical sensor, metal oxide semiconductors (MeOX), and carbon black polymer composite. Electronic nose is a device that can be mimicking biological human nose, which can detect and differentiate types of odorant. Fauzan Khairi Che Harun et al. [12] have focused on how to fabricate carbon black polymer composite gas sensor. In addition, constant current source circuit has been designed to act as interface circuitry so that the change of resistance when exposed to the gas can be observed via Lab VIEW. Besides that, the characteristics of each sensor have been observed and studied. This is to ensure the fabricated sensor gives the same responds with actual sensor. The result from the experiments has shown that the fabricated carbon black polymer composite gas has the potential to detect and respond just like the actual gas sensor.
Huichun Yu et al. [13] have proposed the potential of the electronic nose to monitor Longjing tea different grade based on dry tea leaf, tea beverages and tea remains volatiles was studied. The original feature vector was obtained from the response signals of the E-nose, and was analyzed by principal component analysis (PCA). To decrease the data dimension and optimize the feature vector, the front five principal component values of the PCA were extracted as the final feature vectors by PCA. The linear discrimination analysis (LDA) and the back propagation neural network (BPNN) were proposed to identify Long jing tea grade. The results showed that the discrimination results and testing results for the tea grade were better based on the tea beverages than those based on the tea leaf and the tea remains based on the new five feature vectors; both of the LDA and BPNN methods attain better discrimination for the tea grades based on the tea beverages and the analysis results of the two methods were accordance.
the environmental field. In order to appraise the time evolution of the sensors and the effect on the results of an electronic nose, experimentation has been performed during more than 3 years on two identical sensor arrays. The two arrays contain the same six Figaro sensors and are in the same sensor chamber of the e-nose system. Both arrays have worked continuously, without break. A.C. Romain et al. [14] have proposed technique which describes the drift of some TGS sensors for 7 years as well as the difference in the temporal behavior of identical sensors and the consequence on the e-nose results after the sensor replacement in the sensors array. A correction of the drift and of the replacement effect is applied and the classification results are exposed, with and without correction.
M. Castro et al. [15] have reported that the original design of a proposed type of electronic nose (e-nose) consisting of only five sensors made of hierarchically structured conductive polymer nanocomposites (CPC). Each sensor benefits from both the exceptional electrical properties of carbon nanotubes (CNT) used to build the conductive architecture and the spray layer by layer (sLbL) assembly technique, which provides the transducers with a highly specific 3D surface structure. Excellent sensitivity and selectivity were obtained by optimizing the amount of CNT with five different polymer matrices: poly (caprolactone) (PCL), poly (lactic acid) (PLA), poly (carbonate) (PC), poly (methyl methacrylate) (PMMA) and biobased polyester (BPR). The ability of the resulting e-nose to detect nine organic solvent vapours (isopropanol, tetrahydrofuran, dichloromethane, n-heptane, cyclohexane, methanol, ethanol, water and toluene), as well as biomarkers for lung cancer detection in breath analysis, has been demonstrated. Principal component analysis (PCA) proved to be an excellent pattern recognition tool to separate vapour clusters
Z. Haddi et al. [16] have proposed the potential of an electronic nose to differentiate the geographical origin of the Moroccan virgin olive oils based on their volatile profile was investigated. An electronic gas sensor array system composed of 6 metal oxide semiconductor sensors was used to generate a chemical fingerprint (pattern) of the volatile compounds present in olive oils. Multivariate statistical approach showed good discrimination between the classes of the 27-sample of the dataset population. The results of this study provide promising perspectives for the use of a low-cost and rapid system for the verification of geographical origin of the olive oils based on their volatile profile.
4. PROPOSED METHOD
In recent decades, electronic sensing techniques have significant progress in both the commercial and technical aspects. The term electronic sensing means the ability of reproducing human senses by sensor arrays and pattern recognition systems. E-Nose provides an industry-specific management solution for the continuous and real-time monitoring of environmental odor and air quality resulting in higher profit and improved community relations. In this paper we utilize genetic algorithm to compute the optimized weight. The upcoming sessions of this section clearly explain the progression in detail.
1 0 1 exp 1
1 )
(
N
i ik i j
j
x c
x F
(1)
Where
F
(
x
j)
Fitness value; c = 0.5;
j and
ik = Weights:x
i= elements of fitness value.4.1 Genetic Algorithm based Optimized
Weight for Identifying Gas Components
4.1.1 Generation of Chromosomes
Initially, generate
N
pnumber of random chromosomes each havingN
snumber of genes. The randomly generated chromosomes can be determined as shown in eqn (2)
()
1 )
( 2 ) ( 1 ) ( 0 ) (
, , ,
, k
N k k k k
s s
W
0kNp1, 1 0sNs (2) Here,N
p- No of Chromosome,N
s- No of genes in Chromosome and
s(k) represents thes
th gene of thek
th chromosome with generated values of in the range of(
0
1
)
.Fitness Computation
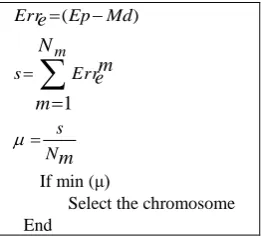
) (Ep Md Erre
m
N
m
m
e
Err s
1
m
N s
If min (μ)
Select the chromosome End
Where, Ep – Experimental value; Md – model value ;
Err
e -Error Element ; s- sum of error Elements ;
N
e - No of Elements;
- Mean of error elements which is also said to be Fitness.From the above pseudo code, select
N
x no of chromosomes to be applied with the genetic operation crossover, mutation.4.1.2 Crossover and Mutation
Crossover and mutation are significant genetic operators of the genetic algorithm. Amid dissimilar types of crossover, the
two-point crossover is engaged here at a cross over rate
Cr
t. In the two-point crossover, two points are selected on the parent chromosomes by means of the equations (3) and (4). The genesin between the two points
Cr
1 andCr
2 are then interchangedbetween the parent chromosomes to obtain
N
p/
2
childrenchromosomes. The crossover points
Cr
1 andCr
2 are determined as followss k s
N
W
Cr
|
|
) (
1
(3)s k s
N
W
Cr
Cr
|
|
) (
1
2
(4)The child chromosomes are obtained and the mutation process is to be held on these chromosomes. This process is repeated until the minimized error is to be obtained regarding to threshold value, which is said to be the best chromosome and sort those sets in ascending order then evaluates them by means of its error value.
4.1.3 Selection of best Chromosomes
After the progression is completed
iter
maxnumber of times, the best chromosome is chosen from the obtained chromosomes. Here the best chromosome is the one that has the minimum error value. Then, the best chromosome’s genes are sorted in the mounting order and the chromosome that has the minimum errors is selected as the best gene. Thus, by means of genetic algorithm the optimized weight for identifying gas components are adjusted
1
0
) ( )
(
1
exp
1
1
5
.
0
)
(
N i
best ik i best
j j
x
x
F
(5) From the process, we have obtained the optimal weights (eqn (5)) for the concern concentration range and the SMAC value inputs hence we identify the particular element through our work with the aid of the resultant value. By obtaining the proper weights that aid to obtain the mathematical model for the further process.
5. RESULT AND DISCUSSION
The proposed technique is used to formulate a mathematical model is genetic algorithm and was implemented in the working platform MATLAB. Initially blind mathematical model is generated by utilizing the experimental result and with the aid of genetic algorithm technique optimized weight is obtained which is used to compute the mathematical model and is said to be optimized mathematical model to identify the reference number to the corresponding components.
Concentration range tested (ppm) SMAC (ppm) Reference number Targeted compound
10 – 50 30 1 Benzene
10 – 130 2000 2 Ethanol
50 – 525 50 3 Freon
0.006 – 0.06 1 4 Indole
3000 – 7000 5300 5 Methane
10 – 300 30 6 Methanol
75 – 180 400 7 Propanol
30 – 60 16 8 Toluene
10 – 50 30 9 Ammonia
[image:4.595.105.236.71.189.2]50 – 510 0.4 10 Formaldhyde
The obtained Experimental values are tabulated in the above tabular column with the aid of this tabular column only the whole
[image:5.595.96.503.106.470.2]mathematical model is generated
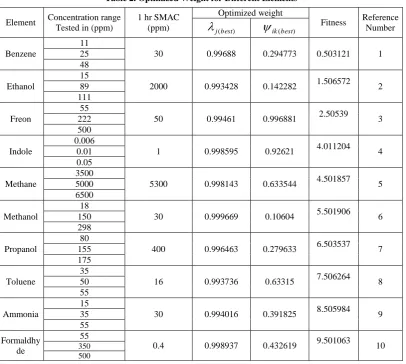
Table 2. Optimized Weight for Different Elements
Element Concentration range Tested in (ppm)
1 hr SMAC (ppm)
Optimized weight
Fitness Reference Number
) (best j
ik(best)Benzene
11
30 0.99688 0.294773 0.503121 1
25 48
Ethanol
15
2000 0.993428 0.142282 1.506572 2
89 111
Freon
55
50 0.99461 0.996881 2.50539 3
222 500
Indole
0.006
1 0.998595 0.92621 4.011204 4
0.01 0.05
Methane
3500
5300 0.998143 0.633544 4.501857 5
5000 6500
Methanol
18
30 0.999669 0.10604 5.501906 6
150 298
Propanol
80
400 0.996463 0.279633 6.503537 7
155 175
Toluene
35
16 0.993736 0.63315 7.506264 8
50 55
Ammonia
15
30 0.994016 0.391825 8.505984 9
35 55
Formaldhy de
55
0.4 0.998937 0.432619 9.501063 10
350 500
In the table 2 various range of compound values are utilized to test the generated mathematical model from this we obtained
optimized weights
j(best)and
ik(best) , fitness value and their correspondent reference value for the components which are all clearly tabulated in the above table 2True positive: An element ‘A’ is identified as A.
False positive: Another element ‘B’ is identified as element A.
True negative: Element ‘B’ is identified as element B.
False negative: Element ‘A’ is identified as some other element B.
Where
A- Target Element.
B- Other Element.
Negatives False
of Number Positives
True of Number
Positives True of
Number
y Sensitivit
(6)
Positives False of Number Negatives
True of Number
Negatives True
of Number
y Specificit
(7)
100 * FN FP TN TP
TN) (TP
Accuracy (8)
) (
N FP ) (
TN FP
FP FPR
Rate Positive False
(9)
) (
) ( Value redictive
FP TP
TP PPV
P Positive
(10)
) (
) ( Value redictive egative
FN TN
TN NPV
P N
(11)
) (
) ( iscovery
TP FP
FP FDR
Rate D
False
(12)
N' PNP'
FPFN) -(TPTN nt(MCC)
nCoefficie
Correlatio
Mathews
Table 3. Performance Analysis for the Proposed System with Different Elements
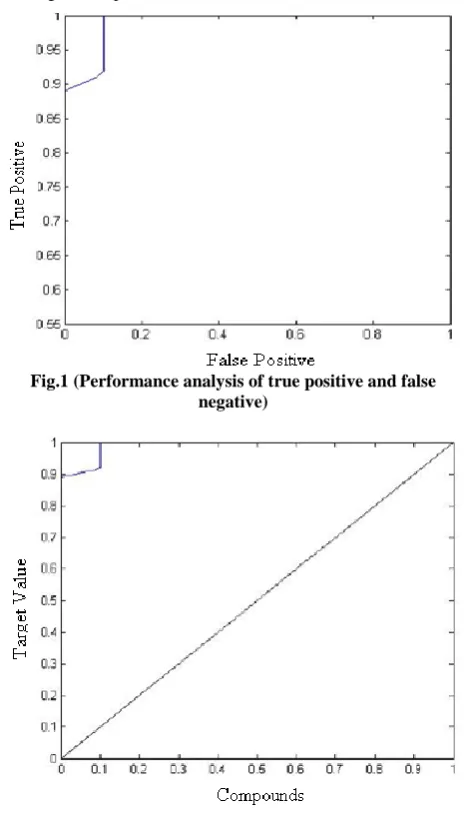
Receiver Operating Characteristic
ROC (Receiver operating characteristic) is the graphical representation drawn between True Positive and False Positive, False Positive rate is plotted in the X axis and True Positive rate is plotted in the Y axis which is showed in the below graphical format. The graph which laid out of the Y axis (i.e.) True Positive rate represent that the Specificity values does not meet the targeted output.
Fig.1 (Performance analysis of true positive and false negative)
Fig. 2 (Performance analysis of true positive false negative with respect to targeted value)
In the above graph the targeted values and the compounds in the x-axis and y- axis were plotted respectively, from that we obtained graph as linear. The aforementioned graph clearly explained the difference in targeted value and the experimented result
6. CONCLUSION
An effective system has been proposed to identify an element with the aid of a mathematical model For generating a mathematical model a blind eqn (1) is utilized and with the aid of the experimental value an optimized weight is generated using genetic algorithm once the optimized weight is identified then that optimized weight is applied in the generated mathematical model. In the evaluation process different concentration range and the SMAC values are inputted to identify the element. Hence with the aid of the concentration range and the SMAC value the reference values is obtained with this reference value correspondent compound are identified in an unknown environment
7. ACKNOWLEDGEMENT
Author wish to thank DrMGR University, Chennai, BITS PILANI Goa and Manipal University for carrying out this collaborative work.
8. REFERENCES
[1] Tommy S. Alstrøm, Jan Larsen, Claus H. Nielsen and Niels B. Larsen, “Data–Driven Modeling of Nano-Nose Gas Sensor Arrays”, In proceedings’ of SPIE Vol.7697, pp.1-12, 2011.
[2] Kerdcharoen, and Wongchoosuk, "Development of Portable Electronic Nose and Applications for Monitoring Armpit ODOR”, In proceedings of the 3rd Biomedical Engineering International Conference, pp.78-81, 2010.
[3] Fauzan Khairi Che Harun, Andik Marwintan Jumadi and Nasrul Humaimi Mahmood,"Carbon black polymer composite gas Sensor for Electronic Nose",International Journal of Scientific & Engineering Research, Vol.2,No.11,pp.1-7,2011.
[4] Abderrahim, Berrebia, Hamou, Kherief, Zanoun and Zenata,"Measure of Carbon Dioxide using a Gas Sensor of a Semiconductor Type based on Tin Dioxide (SnO2)",J. Mater. Environ. Sci, Vol.2, No.2, pp.94-103, 2011.
[5] Rajesh Kumar, Imam and Beg, “Smart Gas Sensor for Miniaturization of E- Nose,” Journal of Engineering Research and Studies, Vol.2, No.1, pp.125-132, 2011.
[6] Rafi Haddad1, Abebe Medhanie, Yehudah Roth, David Harel and Noam Sobel, "Predicting Odor Pleasantness Component TP TN FP FN sensitivity FPR accuracy Specificity PPV NPV FDR MCC
Benzene 5 1 0 4 56 0 60 100 100 20 0 30.4
Ethanol 8 1 0 0 100 0 100 100 100 100 0 94.3
Freon 4 2 1 3 57 33.33333 60 67 80 40 20 19.9
Indole 7 1 0 0 100 0 100 100 100 100 0 93.5
Methane 8 1 0 1 89 0 90 100 100 50 0 62.9
Methanol 10 1 0 1 91 0 92 100 100 50 0 64.3
Propanol 11 1 1 1 92 50 86 50 92 50 8 41.7
Toluene 12 1 0 0 100 0 100 100 100 100 0 96.1
Ammonia 7 2 1 0 100 33.33333 90 67 88 100 13 72.0
[image:6.595.53.286.303.710.2]with an Electronic Nose", PLOS Computational Biology,Vol.6,No.4,pp.1-11,2010.
[7] Walaa Khalaf, Calogero Pace, and Manlio Gaudioso,"Gas Detection via Machine Learning,” World Academy of Science, Engineering and Technology, Vol.37, pp.139-143, 2008.
[8] Jie Cai, and David C. Levy, “Source Direction Detection based on Stationary Electronic Nose System”, World Academy of Science, Engineering and Technology, Vol.15, pp.115-119, 2006.
[9] David C. Wedge, Arindam Das, René Dost , Jeff Kettle, Marie-Beatrice Madec,John J. Morrison, Martin Grell,Douglas B. Kell, Tim H. Richardson, Stephen Yeates, Michael L. Turner,” Real-time Vapour Sensing using an OFET-based Electronic Nose and Genetic Programming”, Sensors and Actuators B: Chemical,Vol.143,pp.365-372,2009.
[10]Chatchawal Wongchoosuk, Anurat Wisitsoraat, Adisorn Tuantranont, Teerakiat Kerdcharoen,"Portable Electronic nose based on Carbon Nanotube-SnO2 Gas Sensors and its Application for Detection of Methanol Contamination in Whiskeys”, Sensors and Actuators B: Chemical, Vol.147, pp.392-399, 2010.
[11]Muhammad Rivai, Djoko Purwanto, Hendro Juwono and Hari Agus Sujono, "Electronic Nose using Gas Chromatography Column and Quartz Crystal Microbalance",Telkomnika,Vol.9,No.2,pp.319-326,2011.
[12]Fauzan Khairi Che Harun, Andik Marwintan Jumadi and Nasrul Humaimi Mahmood,"Carbon Black Polymer Composite Gas Sensor for Electronic Nose”, International Journal of Scientific & Engineering Research, Vol.2, No.11, pp.1-7, 2011.
[13]Huichun Yu, JunWang, Hong Xiao, Miao Liu,"Quality Grade Identification of Green Tea using the Eigen Values of PCA Based on the E-Nose Signals”, Sensors and Actuators B, Vol.140, pp.378-382, 2009.
[14]A.C. Romain, J. Nicolas," Long Term Stability of Metal Oxide-based Gas Ensors for E-nose Environmental Applications: An overview", Sensors and Actuators B, Vol.146, pp.502-506, 2009.
[15]M. Castro,B. Kumar, J.F. Feller, Z. Haddi, A. Amari, B. Bouchikhi, "Novel E-nose for the Discrimination of Volatile Organic Biomarkers with an Array of Carbon Nanotubes (CNT) Conductive Polymer Nanocomposites (CPC) Sensors", Sensors and Actuators B,Vol.159,pp.213-219,2011.
[16]Z. Haddi, A. Amari, A. Ould. Ali, N. El Bari, H. Barhoumi, A. Maaref, N.Jaffrezic-Renault, B. Bouchikhi, "Discrimination and Identification of Geographical Origin Virgin Olive oil by an E-nose based on MOS Sensors and Pattern Recognition Techniques", Procedia Engineering,Vol.25,pp.1137-1140,2011.
[17]Sufal Das and Banani Saha, "Data Quality Mining using Genetic Algorithm", International Journal of Computer Science and Security, Vol. 3, No. 2, pp. 105-112, April 2009.
[18]Akash deep, Baljit Singh, Arjan Singh and Jatinder Singh, "A Simple Efficient Circuit Partitioning by Genetic Algorithm", IJCSNS International Journal of Computer Science and Network Security, Vol. 9, No. 4, pp. 272-276, April 2009.
[19]Rajiv Khanduja, Tewari and Chauhan, "Performance Analysis of Screening Unit in a Paper Plant Using Genetic Algorithm", Journal of Industrial and Systems Engineering, Vol. 3, No. 2, pp. 140-151, 2009.
[20]Tarek BOUKTIR, Linda SLIMANI and BELKACEMI, "A Genetic Algorithm for Solving the Optimal Power Flow Problem", Leonardo Journal of Sciences, Vol. 3, No. 4, pp. 44-58, January-June 2004.
[21]Durairaj, Kannan and Devaraj, "Application of Genetic Algorithm to Optimal Reactive Power Dispatch including Voltage Stability Constraint", Journal of Energy and Environment, pp. 63-73, 2005.
[22]Deep Malya Mukhopadhyay, Maricel O. Balitanas, Alisherov Farkhod,Seung-Hwan Jeon and Debnath Bhattacharyya, "Genetic Algorithm: A Tutorial Review", International Journal of Grid and Distributed Computing, Vol. 2, No. 3, pp. 25-32, September 2009.
[23]John Sanjeev Kumar, Arunadevi and Mohan, "Intelligent Transport Route Planning Using Genetic Algorithms in Path Computation Algorithms", European Journal of Scientific Research, Vol. 25, No. 3, pp. 463-468, 2009.