Implementation of QoS of Different Multimedia
Applications in WLAN
Navdeep Singh Chauhan
BHSBIET, Lehragaga
Loveljeet Kaur
SLIET,Longowal
ABSTRACT
In last deeecade wireless communication becomes a crucial ar a in communication networks. As increasing demand in the field of wireless communication quality of service (QoS) becomes an important consideration for supporting variety of applications that utilizes network resources. In this quality of service for different Multimedia it presents the details of the quality of service WLAN network developed based on popular network simulator opnet 14.0 is used. Various real life setup in the simulation environment. Parameters that media access delay and network load are analyzed.
Keywords
IEEE802.11, video conferencing, VOIP
1.
INTRODUCTION
WLAN stands for Wireless local area network. It is the technology aimed to provide wireless data access over short distances. It is based on Instituttteee of standard [1]. The technology provides basic In rnet Protocol (IP) connectivity to the user. The variety of applications are used in IP networks has increased applications along with the common email, file transfer and web browsing applications are becoming increasingly popular. These applications send large delay requirements. On the other hand, remote monitoring of critical services, electronic commerce and banking applications, as well as, network control and signaling do not need strict bandwidth guarantees due to the busty nature of the data transfer. Instead, these applications require reliable and prompt packet routing. The presence of different kinds of applications in a network, results in heterogeneous traffic load. The traffic from different applications may require certain type of quality of service. In this paper, the Quality of Service (QoS) as prescribed in the WLAN networks is studied.
As packets travel within a wireless network such as WLAN, they experience the following problems: Delay, jitter, out-of-order delivery, packet loss or error.
Quality of service in communication network is a resource reservation policy rather then achieving service quality. In this type of policy resources are reserved for different application requirements. Major resource in communication network is network bandwidth. IEEE 802.11 introduces different traffic flows corresponding to different applications.
The IEEE 802.11 standard includes the QoS mechanism in the Medium Access Control (MAC) layer (layer 2) architecture. It defines service flows which can map to different applications. This enables end-to-end IP based QoS. Among other things, the MAC layer is responsible for scheduling of bandwidth for different users. The MAC layer performs bandwidth allocation based on user requirements as well as their QoS
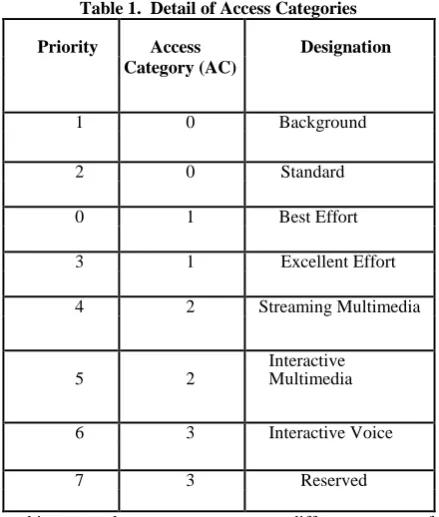
profiles. The standard is designed to support a wide range of applications. These applications may require different levels of QoS. To accommodate these applications, of access categories having different priorities. These are summarized in Table 1.
[image:1.595.319.539.360.619.2]This paper focuses on the implement of QoS in WLAN networks. The details of the implementation of QoS in the WLAN network architecture will be presented. To analyze the QoS parameters simulation based on the popular network simulator opnet 14.0 is used. Various parameters that determine QoS of real life usage scenarios and traffic flows of applications are analyzed. The goal is to implement different types of Multimedia Application with respect to the QoS parameters, such as, throughput, media access delay and network load etc.
Table 1. Detail of Access Categories
Priority Access Designation Category (AC)
1 0 Background
2 0 Standard
0 1 Best Effort
3 1 Excellent Effort
4 2 Streaming Multimedia
5 2
Interactive Multimedia
6 3 Interactive Voice
7 3 Reserved
In this research we can use two different types of Multimedia Applications. These applications are Video Conferencing and Voice (VOIP). In next section the detailed study of various QoS parameters is discussed. These parameters are media access delay, throughput and network load.
2.
QoS Parameters
2.1 Throughput
application.
2.2 Media Access Delay
Delay is a technical term that can have a different meaning depending on the context. It can relate to networking, electronics or physics. In general it is the length of time taken for the quantity of interest to reach its destination.
In computer networks, media access delay is the amount of time it takes for the head of the signal to access a medium.
2.3 Network Load
Network load define the total load on WLAN. Different applications have different effect on network load. Network load also depends upon the type and size of data. For example, for real time applications load will be high as compare to other type of data.
3.
Simulation Scenario
Creating a simulation scenario that is equivalent to real world scenario is the first step of simulation. In this simulation, the wireless topology considered of several wireless stations and one base station in wireless LAN. All wireless stations are located such that every station is available to detect a transmission from any other station, and there is no mobility in the station in the system. This means that our results will not be impact by mobility and phenomenon such as hidden node problem.
Fig 1: A Sample Network Model
In this research we use twenty nodes and a single WLAN server to make a perfect network model. All nodes communicate with each other through WLAN sever.
The simulation experiments are carried out using OPNET (version 14.0) on windows platform. For this simulation, data rate of 11 Mbps is chosen. The various MAC and PHY parameter values used in our experiment are according to IEEE 802.11e default values given in the Table 2. Then run the simulation for 5 minutes for each scenario and then compared the results obtained from them. Figure 1.2 shows a sample network model.
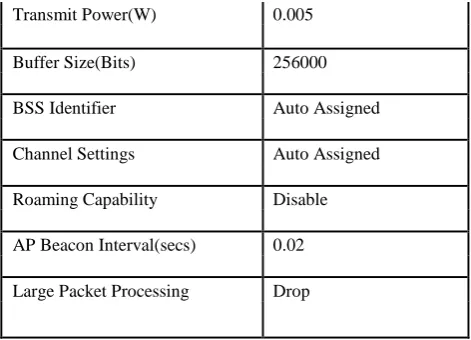
Table 2 MAC and PHY parameter values used in Experiment
ATTRIBUTES VALUE
Physical Characteristics Direct Sequence
Data Rate(bps) 11Mbps
Transmit Power(W) 0.005
Buffer Size(Bits) 256000
BSS Identifier Auto Assigned
Channel Settings Auto Assigned
Roaming Capability Disable
AP Beacon Interval(secs) 0.02
Large Packet Processing Drop
4.
Simulation Results
In case of Multimedia application, both traffic classes were fed into the MAC layer from higher layer which are corresponding to AC(2) and AC(3) respectively to check how efficient the service differentiation required for real time application. For this, in the application profile of scenario different application was configured for different access categories. Detail is shown in the table.
Table 3 Access Categories according to applications
ACCESS APPLICATION DESIGNATION CATAGORIS CONFIGURED
AC(2) VIDEO INTERACTIVE
CONFRENCING MULTIMEDIA
AC(3) VOICE INTERACTIVE
VOICE
In profile configuration, a profile for client was configured that uses both multimedia applications. In simulation scenario, 20 stations were configured to use these services randomly. The results obtained by multimedia application are follows:
4.1
Througput of different Access
Categories
[image:2.595.315.551.71.241.2]means that the throughput of Video conferencing is higher than the Throughput of voice application. EDCF provides maximum Throughput by providing them more priority over the other services like HTTP.
[image:3.595.55.266.141.270.2]4.2
Media Access Delay
Figure 3. Media Access Delay of Different Access categories
In Figure 3 we can see that Media Access Delay of Access category 2 is way less than the Access category 3. It means that the Media Access Delay of Video conferencing is lower than the Media Access Delay of voice application. Thus, EDCF provides less Media Access Delay for real-time application.
4.3Network Load for Different Application
Figure 4. Network Load of Different Access categories
In Figure 4 we can see that Network Load of Access category 2 is higher than the Access category 3. It means that the Networking load of Video conferencing is higher than the Network load of voice application. Thus, Network loadFor real-time application is higher than other application.
5.
Comparative Analysis of Multimedia
Application
Next step is to check the performance of both Multimedia Applications in terms of Throughput, Media Access Delay and Network Load. These metrics are determined factors in terms of variation in load for different Multimedia application.
5.1 Video Conferencing
Following are the Comparative metrics for Video Conferencing using variations in different picture quality and numbers of frames/sec. Following graphs show Throughput of video conferencing by using different load, Media access delay of video conferencing by using different load and Network load of video conferencing by using different load.
[image:3.595.320.545.221.385.2]
5.1.1
Througput
Figure 5 throughput of Video Conferencing by using different load.
In Figure 5 we can see the throughput of VCR quality is higher than the throughput of high resolution video and low resolution video. The throughput of low resolution video conferencing is lying between the high resolution and VCR quality video conferencing. The throughput of high resolution video conferencing is less than both other video conferencing schemes.
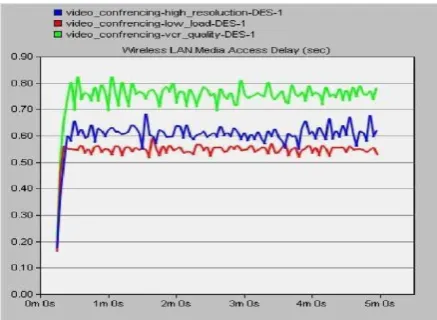
5.1.2 Media Access Delay
Figure 6. Media Access Delay of Video Conferencing.
[image:3.595.62.272.377.545.2] [image:3.595.315.534.503.663.2]5.1.3 Network Load
Figure 7. Network Load of Video Conferencing.
In Figure 7 we can see that the network load of VCR quality video conferencing is higher than the other video conferencing schemes. Network load on high resolution video is less than all other Video Conferencing schemes. Network load of low resolution Video is between the other two Video Conferencing schemes.
5.2 VOIP
Following are the Comparative metrics for Voice multimedia application by using variations in quality of voice such as GSM quality, low quality and PCM quality speech. Following are the graphs that show Throughput of voice application by using different quality, Media access delay of voice application by using different quality and Network load of voice application by using different quality.
5.2.1 Throughput
[image:4.595.52.269.93.256.2]
Figure 8. Throughput of Voice Application by using different Quality.
In Figure 8 we can see the throughput of GSM quality is higher than the throughput of low quality voice and PCM quality voice. The throughput of low quality voice is lying between the GSM quality and PCM quality voice. The throughput of PCM quality voice is less than both other voice schemes.
[image:4.595.309.536.385.553.2]5.2.2 Media Access Delay
Figure 9. Media Access Delay of Voice Application.
In Figure 9 we can see that Media Access Delay for PCM quality voice is larger than the other schemes while Media Access Delay of GSM quality voice scheme is lying between PCM quality and low quality voice. Low resolution voice having minimum delay. Thus, Media Access Delay increases according to video quality.
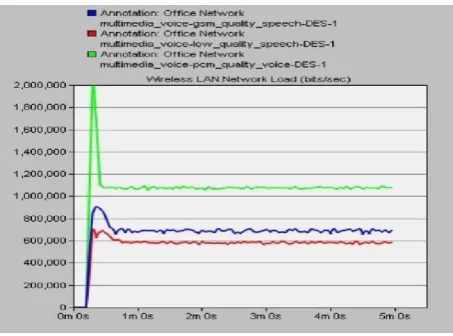
5.2.3 Network Load
Figure 10. Network Load of Voice Application.
In Figure 10 we can see that the network load of PCM quality voice is higher than the other voice schemes. Network load on low quality voice is less than all other voice schemes. Network load of GSM quality voice is between the other two Voice schemes.
6.
CONCLUSION
The results show that the real time application like (video conferencing, video streaming) the QoS parameters such as Network Load, throughput are increased. Over all we see that the high priority channelbenefited, while low prioritychannel suffered.
[image:4.595.58.284.484.640.2]7.
FUTURE WORK
In our scenario the nodes and servers are stationary in the network. Future work may be done by using moveable Infrastructure of wireless LAN and eliminate Hidden node problem in wireless LAN. Hidden problem is that two device A and C communicating with node B but unaware of each other.
Figure 11 Hidden Node Problem
REFERENCES
[1] Andrew S. Tanenbaum, “Computer Networks”, 4th Edition, Pearson Edu.2007.
[2] Behrouz A Forouzan, “Data Communications and
Networking”, 4th Edition, Tata McGraw Hill, 2006. [3] Sunghyun, Del, Sai, Mangold S. “IEEE 802.11 e
contention-based channel access (EDCF) performance evaluation”, IEEE International Conference on In , vol. 2, pp. 1151-1156, 2003.
[4] Choi S. and Shin K. G., “A cellular local area network with QoS guarantees for heterogeneous traffic”, Proceedings IEEE Infocom'97, pp. 1032-1039, Kobe, Japan, April 1997.
[5] Comer, D. “Computer Networks”, Upper Saddle River, NJ: Prentice Hall, 2004.
[6] Crow Brian P., Widjaja Indra, Kim Jeong Geun, Prescott T. Sakai, “IEEE 802.11 Wireless Local Area Networks”, IEEE Communications Magazine, September 1997. [7] Draft Standard IEEE 802.11, “Wireless LAN Medium
Access Control (MAC) and Physical Layer (PHY) Specifications”, November 1999.