Modeling urban evolution by identifying
spatiotemporal patterns and applying
methods of artificial intelligence.Case
study: Athens, Greece.
Photis, Yorgos N. and Manetos, Panos and Grekoussis,
George
University of Thessaly, Department of Planning Regional
Development, National Technical University
2003
Online at
https://mpra.ub.uni-muenchen.de/20756/
T
HIRDE
UROC
ONFERENCE:
T
HEE
UROPEANC
ITY INT
RANSITION"The City and the Region"
14/15 November 2003, Bauhaus-Universität Weimar, Germany
"M
ODELINGU
RBANE
VOLUTION BYI
DENTIFYINGS
PATIO-T
EMPORALP
ATTERNS ANDA
PPLYINGM
ETHODS OFA
RTIFICIALI
NTELLIGENCE.
C
ASES
TUDY:
A
THENS,
G
REECE."
Yorgos Grekousis
PhD candidate, National Technical University of Athens Faculty of Rural and Surveying Engineering
9 Iroon Polytechneiou Str 157 80, Zographos , Athens, Greece
e-mail : [email protected]
Panos Manetos
PhD candidate, University of Thessaly Dept. of Planning and Regional Development
Pedion Areos, Volos 38334, Greece Tel.: +302421074426 Fax: +302421074382
e-mail: [email protected]
Yorgos N. Photis
Assistant Professor, University of Thessaly Dept. of Planning and Regional Development
Pedion Areos, Volos 38334, Greece Tel.: +302421074426 Fax: +302421074382
Abstract
While during the past decades, urban areas experience constant slow population growth, the spatial patterns they form, by means of their limits and borders, are rapidly changing in a complex way. Furthermore, urban areas continue to expand to the expense of "rural” intensifying urban sprawl. The main aim of this paper is the definition of the evolution of urban areas and more specifically, the specification of an urban model, which deals simultaneously with the modification of population and building use patterns.
Classical theories define city geographic border, with the Aristotelian division of 0 or 1 and are called fiat geographic boundaries. But the edge of a city and the urbanization "degree" is something not easily distinguishable. Actually, the line that city ends and rural starts is vague. In this respect a synthetic spatio-temporal methodology is described which, through the adaptation of different computational methods aims to assist planners and decision makers to gain an insight in urban-rural transition. Fuzzy Logic and Neural Networks are recruited to provide a precise image of spatial entities, further exploited in a twofold way. First for analysis and interpretation of up-to-date urban evolution and second, for the formulation of a robust spatial simulation model, the theoretical background of which is that the spatial contiguity between members of the same or different groups is one of the key factors in their evolution.
1)
I
NTRODUCTIONWhile during the past decades, urban areas experience constant but slow population growth, the spatial patterns they form, by means of their limits and borders, are rapidly changing in a complex way. Furthermore, urban areas continue to expand to the expense of "rural” intensifying urban sprawl. The main aim of this paper is the definition of the evolution of urban areas and more specifically, the specification of an urban model, which deals with the modification of population and building use patterns. Future evolution of metropolitan centers, as well as city development constitutes a challenge for the science of geography, because the edges of a city and the urbanization degree are not easily distinguishable. Classical theories define city geographic border, with the Aristotelian division of 0 or 1 and are called fiat geographic boundaries. This approach classifies whether something is in or out the city monolithically. Actually, the line that city ends and rural starts is vague. Aim of this study is to propose a methodology not only for spatially defining city’s borders, but also to implement a model that captures urban evolution.
Several multifaceted efforts exist, that confront the question of determination of the way the urban space changes, which proves the interest of examining their cause. As the general requirements in planning, and more specifically in urban planning, are continuously augmenting since more parameters- variables (e.g. environmental repercussions) should be taken under consideration (Rocky Mountain Institute 1998). Consequently, there exists apparent interest for the conduct of such researches and the quest of suitable methods to support the formulation of urban models. A representative example of such efforts is the Urban Dynamics Research, which is a research program for the recording and analysis of land use changes in urban spaces. Its objective is to recognize the spatial links between geographic and socio-economic factors that contribute in the urban growth. The formulation of the derivative models is based on the use of simple parameters such as the degree of urban extension, the topography of the region and the road network. For the forecast of the probability of urbanization of regions, statistical methods are primarily used (USGS 2002).
was not always powerful and in combination with the initially limited technological possibilities did not lead to widely known and applicable tools.
2)
M
ETHODSFrom the series of methods and techniques that are used for data analysis, NN and FL were selected to be integrated in the proposed methodology. Their practicality and efficiency lies in the fact that they do not presuppose necessarily specialised mathematical knowledge or other theories, in order to be applied effectively. Some distinguished examples of their applications in the literature are the forecast of the spread of AIDS cases in the state of Ohio and the socio-economic classifications of population (South Africa) based on census data (Hewitson 1994). A short presentation of these techniques follows, focusing on their main characteristics and the way of integrating them in the presented methodology.
Fuzzy Logic: The theory of FL was developed in order to handle problems that do not have strict limits or situations in which events are vaguely determined, as it actually happens in the real world. FC has been proven especially useful in multivariate object clustering. The first objective of clustering is the detection of common structures in the data, clusters, in which each object is attributed. Openshaw has already expressed the idea of applying FL in Geodemography since 1989. The more basic reason is that usually in Geodemography exist two kinds of fuzziness that are encountered in the uncertainties that emerge from the inaccuracy. The first concerns the descriptive characteristics of spatial units, where for example if clustering of neighbouring entities is implemented by the binary logic, the fact that enough entities even if they have similar, are classified differently. The second, concerns the effect of contiguity in the configuration of individual characteristic regions and more specifically in the geographic phenomenon where while neighbouring populations tend to share certain common characteristics in their behaviour despite the other differences, are classified in wrong groups. One reason for these is that the borders of spatial entities are not natural in demographic and economic-social terms (Feng 1998).
Neural Networks: The use of NN for data processing provides the ability of detection of relationships between theoretically independent variables for each object. This fact can boost the research in new paths and approach the under examination problem from different aspects. NN contain several free parameters and for this reason they require many more training data in order to achieve better performance.
3)
M
ETHODOLOGICALA
PPROACHFor the determination of geodemographic evolution of urban regions, a spatiotemporal approach was adopted, under the sense that the observation, the interpretation and the forecast of the under study phenomenon, are accomplished in the flow of time, analyzing and formulating a thorough perception of its progressive formation. It is designated in this sense the importance of the time variable in each decision-making process. Having in mind Tobler's law "everything is related to everything else but nearby things are more related than distant things", a simple and flexible methodology was formulates, in order to identify urban evolution patterns.
Fundamental axis of the proposed methodology comprises the ascertainment that the development of a spatial entity does not depend only on its own exclusive features that it constitutes of, but also from the way in which the neighbouring entities develop, as the frontier contact creates bidirectional relations of assimilation of characteristics and interaction of activities. Often, for the observation of a phenomenon spatial entities are grouped based on common features, in order for the changes to be distinct, particularly when the number of spatial entities is augmented. The formulation of groups that are characterized by a particular breadth of values in the corresponding variables, constitute the constant diachronic reference, based on which each entity is classified and described. This acknowledgement, involves the secession of entities in different groups diachronically, which means that on one hand its stage of development is changed and on the other hand its developmental prospect. In this way, for each time interval, a correspondence between region and spatial unit is formulated and its common encounter, formulates the diachronic image.
Geodemographic clusters: Concerns the FL procedure which constitutes of the creation of a matrix that includes the complete set of temporal data that will be used for the determination of groups. The calibration of the parameters follows, which includes the selection of the desired number of clusters. As the clustering process completes, the changes in the percentages of each spatial unit (SU) lead to individual changes from group to group for each object. Each group that is determined is characterized by certain values in data (cluster centres) and represents a particular kind of growth and development. When the process is completed, the final results are registered in a geo-database base and are visualized with the aid of GIS software.
There is no determined number of variables that can be used by the previously discussed methods. Thus, the flexibility of the methods reflects the flexibility of the methodology as for the ways of exploitation of data, while at the same time it ensures the same effectiveness for different scales of application. It can be applied for every group of spatial entities, e.g. in a system of urban centres, or even on the level of city blocks.
4)
C
ASES
TUDYThe region of Attica lies in the central Greece with an extent of 3,808 sq km and a population nearly 4 million and covers the 2.9% of the total extent of the country. The prefecture of Attica is divided into 108 municipalities, including the capital city of Athens. The data used in this case study come from National Statistical Service of Greece and refer to: a) Population 1961, 1971, 1981,1991, b) Number of buildings 1961, 1971,.1981, 1991, c) Mean Annual Rate of Population for decades 1961-1971, 1971-1981, 1981-1991, d) Mean Annual Rate of Buildings for decades of Buildings 1961-1971, 1971-1971-1981, 1981-1991. e) Building usage from 1961 until 1991 per decade such as: residence, schools buildings, churches, hospitals, clinics, offices, shops, factories, laboratories, other.
The urbanization degree of each municipality was revealed through fuzzy clustering. Fuzzy c-means algorithm with exponent value m of 2, was implemented in order 5 clusters to be created. The optimal choice of the number of classes to be used, was made with reference to a number of validity criteria such as partition coefficient, proportion exponent and classification entropy. These criteria measure the quality of clustering by assigning a value to it. The higher the value the more data points are concentrated around the cluster centers. A matrix 324X9 was initially created. Each of the 108 municipalities presents itself 3 times in the matrix, one for each decade. Clustering was applied for each decade and clusters expressed the urbanization degree of each municipality. Cluster centers are shown in table 1.
POP POP
RATE
BUILDINGS BUILDING RATE
RESIDENCE SCHOOLS OFFICES FACTORY OTHER
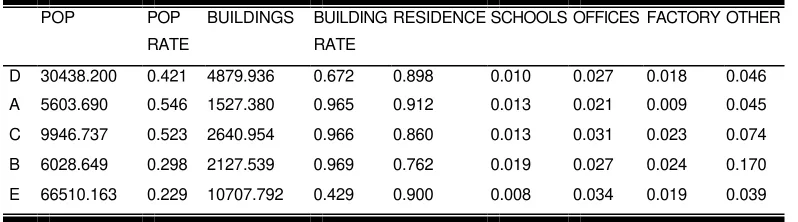
D 30438.200 0.421 4879.936 0.672 0.898 0.010 0.027 0.018 0.046
A 5603.690 0.546 1527.380 0.965 0.912 0.013 0.021 0.009 0.045
C 9946.737 0.523 2640.954 0.966 0.860 0.013 0.031 0.023 0.074
B 6028.649 0.298 2127.539 0.969 0.762 0.019 0.027 0.024 0.170
[image:7.596.108.507.526.637.2]E 66510.163 0.229 10707.792 0.429 0.900 0.008 0.034 0.019 0.039
Table 1. Cluster Centers
4.1 CLUSTER ANALYSIS
of attraction for the population. The commercial-office is 2.7% showing tendencies for continuous concentration of tertiary sector of economy. As conclusion, cluster D is characterized by municipalities with big enough population and number of buildings, the presence of tertiary sector and can be placed as a step, in the course of development, before the completely developed city.
CLUSTER A: The medium annual growth rate of population (54.6 %) is the highest among the clusters, showing the great dynamic in the absorption of new residents. Simultaneously the rate of buildings is equally high (96.5%) something reasonable since increase of population demands buildings for residence. The residential use gets the maximum value of 91,2%, and are preferable for primary or secondary (vacation) residences. It is characteristic that these municipalities present the minimal rate of use of factories, (0,9%), as well as use of offices– shops 2,1 %. Furthermore there is an absence of boisterous activities, small population density and wide natural landscape.
CLUSTER C: Growth rate of population and buildings are very high 52. 3% and 96,6% respectively, showing that municipalities in this team are evaluating quickly towards cluster D. They are characterized by the second smaller percentage of residential use (86%) and the second higher percentage in the uses of offices shops (3,1%) and use of factories (2,3%). From the above, is concluded that municipalities of this cluster, attract working activities such as laboratories, factories, agricultural units and in general tertiary sector and therefore constitute pole of attraction for the population.
CLUSTER B: Growth rate of population is very small (29,8%) but on the contrary building rate is very high mainly due to the intense activity in the primary economic sector. The residential use presents the minimal percentage with 76.2% showing that in these municipalities other type activities dominate. The uses of factories – laboratories and other uses (mainly agricultural) present the greatest values comparatively with all the clusters, 2.4% and 17,0% respectively. Cluster B is composed by municipalities characterized of primary and secondary sector of economy. Thus these municipalities were enough downgraded especially till 1981. These high percentages are decreasing continuously as primary sector gives way to secondary and tertiary sector. As a result the majority of municipalities belonging in this cluster in 1971 have been moved to others in the following years. For example in decade 81-91 more than half of the municipalities, belonging to cluster B in period 71-81, changed cluster.
CLUSTER E: Municipalities in this class present the minimum rates in both population and buildings 22.9% and 42. 9 % respectively and characterized as already developed cities. They are found in a stage of very slow changes, due to the over-concentration of population, the intense building activity of past years and usually the lack of free place to build. The residential use gets the percentage of 90%, while the use of schools, churches, clinics presents the minimal percentage of all clusters. On the other hand use of shops, offices and services in general presents the maximum percentage of 3.4 %. Municipalities in cluster E are powerful urban centers and they constitute pole of attraction for both population and installation of services of tertiary sector.
In decade 61-71 the municipality belongs in cluster D with 64% membership value and as shown in table 3 demographic data is found close to cluster centers of class D. It is obvious that during decade 71-81 the city transforms gradually from D to E cluster, since membership value rises from 7.1% to 36.6% against 32.93% of cluster A. Finally in decade 81-91 the municipality belongs to cluster E with 50.4%. By this process tendencies are identified and future evolution can be simulated.
D A C B E
61-71 0.640658 0.114858 0.126751 0.046508 0.071224
71-81 0.3293 0.110278 0.12308 0.070643 0.366699
[image:9.596.90.515.209.282.2]81-91 0.251538 0.087252 0.097683 0.059034 0.504493
Table 2. Membership function output
POP POP.RATE BUILDINGS B. RATE RESIDENCE SCHOOLS OFFICES FACTORIES OTHER
61-71 42512 0.2938 3929 0.554803 0.929591 0.008685 0.016129 0.004032 0.041563
71-81 67408 0.5856 5425 0.380753 0.933481 0.008591 0.017428 0.003436 0.037064
[image:9.596.73.537.425.629.2]81-91 69749 0.0342 6473 0.193174 0.936615 0.000205 0.018667 0.003692 0.032821
Table 3. Demographic data for municipality during three decades.
.
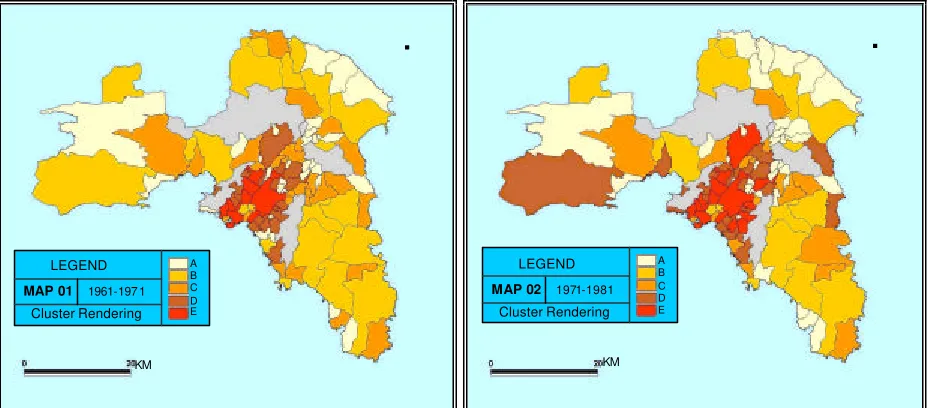
LEGEND
MAP 01 1961-197 1
Cluster Rendering
A B C D E
KM
.
LEGEND
MAP 02 1971-1981
Cluster Rendering
A B C D E
4.2 URBAN MODEL
The type of neural network that was selected was a multilayer perceptron neural network. A matrix consisting of 15 columns and 212 lines was initially created. The first five columns contain membership function values, for each municipality. Columns 6 to 10 represented the values of clusters of surrounding units. The last five columns contain the membership values for the same municipality the next decade. The ten first columns constituted of input dat a and next five desired data. The final selected NN consisted of two hidden layers connected with 550 neurons in a linear transfer function. The values of learning rate momentum are 0.1 and 0.9 respectively. The rms training error is 0.005 (graph1) and the rms test error was 0.0067.
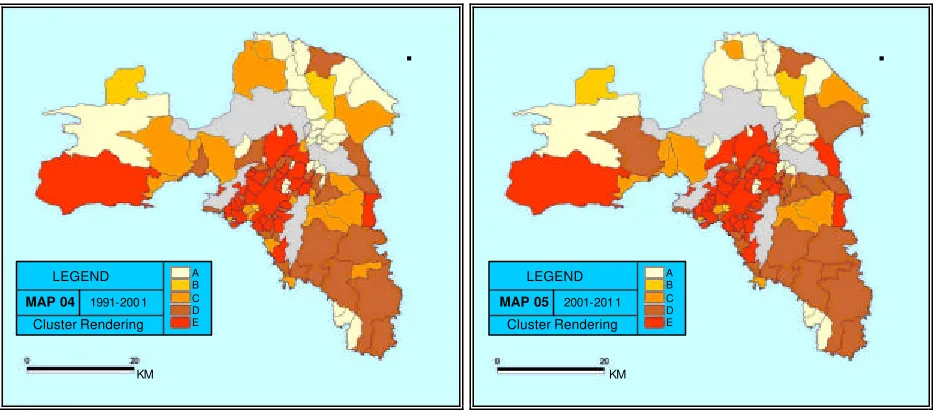
What it is ascertain from the prediction maps 4 and 5 extended to the year 2011, is the propensities and pressures that the municipalities show, rather than the accuracy of the municipalities groups are yield. Hence, it is likely to outcome a polarization state of the district to municipalities of urbane character and to municipalities with basically residential use (mainly for the holiday), almost vanishing the municipalities of group A, as the uses classified to the first economic sector had already transferred out of district. During decade 61-71, 19 (table 1) municipalities (17,8% table 2) were attributed
MSE versus Epoch
0 0,01 0,02 0,03 0,04 0,05 0,06 0,07
1 100 199 298 397 496 595 694 793 892 991 Epoch
MSE
Training MSE
Graph 1. Training MSE versus epoch
.
LEGEND
MAP 03 1981-199 1
Cluster Rendering
A B C D E
to cluster D, and progressively they reach to 25 (22,9%) in decade 81-91. In the prediction decade 2001-2010 this number rises to 35 in a percentage of 32,4 %. In that period 1 out of 3 municipalities were attributed to cluster D while in decade 61-71 the correspondence was 1 to 5. This result keeps pace with the general tendency of urbanization.
61-71 71-81 81-91 91-2001 2001-2010
D 19 23 25 29 35
A 32 36 35 28 27
C 27 18 12 20 10
B 22 16 15 3 3
E 9 16 22 29 34
61-71 71-81 81-91 91-2001 2001-2010
D 17.8% 21.1% 22.9% 26.6% 32.4%
A 29.4% 33.0% 32.0% 25.6% 24.7%
C 24.3% 16.7% 11.8% 18.3% 9.1%
B 20.0% 14.6% 13.3% 2.9% 2.7%
[image:11.596.280.533.155.251.2]E 8.5% 14.6% 20.0% 26.6% 31.1%
Table 4. Number of municipalities per cluster. Table 5 .Percentage of municipalities per cluster.
In cluster A, a high constant concentration of municipalities was observed with a however light declining course. Thus from 32 municipalities belonging in decade 61-71 (29.4%), it raised to 36 (33%) in 71-81 and reaches in 35 (32%) in 81-91. The prediction for 2001-2010 shows that 27(24. 7%) municipalities were attributed to this cluster. In general, municipalities were attributed to cluster A are characterized by high stability over time, since from a total of 30 that remain immutable over time the 20 (66%) were attributed to cluster A. However, population and building rates are the highest of all clusters, which means development and possible transition to other cluster, mainly to cluster D. Cluster C is characterized by municipalities that are in the middle of the evolution process. Only one municipality was attributed to the same cluster over time showing the fluidity of this cluster. In cluster B, that included the under populated municipalities, there was a constant decreasing rate revealing the great evolution in the prefecture of Attica. The 22 (20%) municipalities in period 61-71 became 15 (13,7%) in decade 81-91 and are predicted to be only 3 (2,7%) in period 2001-2010. Cluster E follows a regularly ascendant orbit. In decade 61-71 9 municipalities or 8.2% (mainly round the Capital of Athens) belong in this team. The next decade the percentage amounted in 14.6% and decade 81-91 reached the 20%. Estimation for 2001-2010 resulted in a percentage of 31.1% or 34 municipalities.
.
LEGEND
MAP 05 2001-201 1
Cluster Rendering A B C D E KM
.
LEGENDMAP 04 1991-200 1
[image:11.596.72.539.559.766.2]The intense concentration of population in municipalities offering high services and places of work, draw the installation of new residents and thus they contribute in the continuous sprawl of cities. In period 61-71 the municipalities belonging in categories D and A (that is to say in the developed urban centers) were 28 or 25.8 %. In decade 81-91 the municipalities reach 47 or 42.9% almost half. Finally at the forecast 2010 69 municipalities or 63.1% will belong in clusters D, A almost two out of three municipalities of Attica. Even if the results of fuzzy classification and subsequently the forecast are offered for the deduction of multiple conclusions, further analysis and annotation of maps escapes from the framework of this present paper, as it could constitute a separate study.
5)
C
ONCLUSIONS–
F
URTHER RESEARCHJustifiable possibilities emerge by the use of FL and NN in various spatial problems, which up to today had been characterized as of increased complexity and therefore attracted minor attention. Such a thing does not mean in any case that the classic methods should be suppressed, but should function additionally and in combination with NN, so as to comprehend and solve similar problems through integrated approaches.
The proposed methodological framework is characterized by its simple and simultaneously dynamic structure, not only as far as it concerns the model. It can be adapted in a variety of spatial phenomena, and depending on the problem and each objective, it can incorporate an important number of variables, with the condition of the existence of a sufficient number of elements for the training procedure. FL proved particularly effective for clustering, since each SRU had its own separate profile for each moment in time. Thus, not only a complete picture of the prefecture for each interval was shaped, but also the diachronic change in percentage revealed the future trends for each municipality separately
The conclusions of this paper have a twofold importance. As far as the application is concerned, they have a direct practical and explanatory value for the prefecture of Attica itself, regarding to the trends that will prevail in the municipalities, for their demographic development and the building use changes in the next decades. Having in mind these observations, the individual conclusions of this research are summarised as follows:
® Within the framework of the proposed methodological approach, concessions and compromises, that are often encountered in models formulated using methods of statistical analysis are avoided. On the contrary, the real interaction of data is revealed during the process of training by the corresponding features.
® It designated the comparative advantage from the combinational utilization exploitation of the two methods, FL for clustering and the NN for the volitional forecast, in contrast to their individual application. At the same time it was outlined the significance of the researcher's experience for the successful implementation of models, as well as the dependence on the collection of sufficient data.
dimension and the diachronic change constitute the main causes of their complexity, as for example, the forecast of levels of offer and demand of activities of tertiary sector.
Further development is under way, involving the enrichment of the methodology and the application for the year 2021 when required data become available. Moreover, the integration of the graphical user interface in a GIS environment is important, so as to aid the user to conduct the whole process using only one software environment.
REFERENCES
Feng, ?., Flowerdew, R. (1998), Fuzzy geodemographics: a contribution from fuzzy clustering Methods, st? “Innovations in GIS: Innovations in GIS 5”, (Selected Papers from the fifth National conference on GIS Research UK), Taylor&Francis, UK.
Feng, S., Xu L. (1999), "An Intelligent Decision Support System for Fuzzy Comprehensive Evaluation of Urban Development", Expert systems with a pplications, 16 (1999) 21-32, Elsevier Science
Haykin, S. (1999), Neural Networks: A comprehensive foundation, Prentice-Hall, New Jersey.
Hewitson, B.-Crane, R. (1994), Neural Nets: Application in Geography, Kluwer Academic Publishers, Netherlands.
Kosko, B. (1997), Fuzzy Logic ? ??a ?p?st?µ?, ??d?se?? S??a?µa, ????a
Kropp, J. (1998), "A Neural Network Approach to the Analysis of City Systems", Applied Geography, Vol. 18, No 1, pp. 83-96, Elsevier Science Ltd.
Leontidou, L. (1996), ‘‘Alternatives to modernism in (southern) urban theory: Exploring in-between spaces’’, International Journal of Urban and Regional Research, 20/2, 178-195.
? ?T (1997a), Data Engine: Overview and user Manual, Management Intelligenter Technologien, Germany.
? ?T (1997b), Data Engine: Tutorials and Theory manual, Management Intelligenter Technologien Germany.
Openshaw, S. (1989), “Making Geodemographics more sophisticated”, Journal Market Research Society, 31.
Openshaw, S. (1997), Artificial Intelligence in Geography, John Wiley & Son Ltd, London.
Principe, J.C., Euliano, N.R., Lefebvre, W.C. (2000), Neural and Adaptive Systems: Fundamentals Through Simulations, John Wiley & Sons, Inc.
Rocky Mountain Institute (1998), Green development: integrating ecology and real estate, John Wiley and Sons, New York
USGS (2002), "Urban Dynamics Research Program. Analysis of Land Use Change in Urban Environments", http://landcover.usgs.gov/urban/intro.html