Does the information content of payout initiations
and omissions influence firm risks?
Henk von Eije
Faculty of Economics and Business, University of Groningen, The Netherlands∗
Abhinav Goyal
University of Liverpool Management School, University of Liverpool, United Kingdom†
Cal B. Muckley
UCD School of Business and Geary Institute, University College Dublin, Ireland‡
Abstract
We study the influence on firm risks of NASDAQ and NYSE firm payout initiations and omissions. These pay out events can be interpreted as managerial signals of firm financial life-cycle maturation resulting in concomitant changes in firm risks. We remove confounding payout types and we match on the propensity to initiate or omit informed by determinants of pay out known to investors in advance. For payout event and matched firms, we apply the difference-in-differences method to estimate the effect of the information content of actual initiations and omissions on firm risks. We find consistent significant declines in total, aggregate systematic, and idiosyncratic firm risks after cash dividend initiations and increases after dividend omissions, but only incidentally after share repurchase initiations and omissions.
JEL Classification: G35, G32, C58
Keywords: dividends, repurchases, initiations, omissions, total risk, idiosyncratic risk, systematic firm risks, self-selection
∗
E-mail: [email protected] author:Henk von Eije, University of Groningen, Faculty of Economics and Business, Duisenberg Building 848, PO Box 800, 9700 AV, The Netherlands. The authors would like to thank three anonymous referees, Alok Bhargava, Philip Bourke, Michael Brennan, Amedeo De Cesari, Tom Conlon, Gregory Connor, Lammertjan Dam, Kevin Denny, Tom Flavin, Gustavo Grullon, Ciaran Heavey, Halit Gonenc, Olan Henry, Kevin Maher, Gael Martin, Brendan McCabe, John McConnell, Aljar Meesters, Conall O’Sullivan, Paul Ryan, Bob Scapens, Marianne Simonsen, Peter Smid, Roberto Wessels and Wim Westerman. The usual disclaimer applies.
†
E-mail: [email protected]
‡
1
Introduction
Payout policy and firm risks are two major topics in the field of corporate finance, but
the influence of extreme payout events (payout initiations and omissions) on firm risks
has received scant attention in the literature. Notwithstanding, Brav, Graham, Harvey
and Michaely (2005) report that many financial executives believe that there is a causal
relation between pay outs and risk changes. The objective of this paper is to test whether
changes in firm risks are indeed attributable to the new information content provided to
investors in pay out initiations and omissions. We assess the risk effects of dividends and
repurchases, of initiations and omissions, on total, aggregate systematic, and idiosyncratic
risks. The findings in respect to the estimated risk effects are not only relevant in their
own right, but also because these risk effects are very likely to influence firm values.
In line with the semi-strong form of the efficient market hypothesis (Fama, 1970)
in-vestors can have expectations, based on publicly available information, on prospective pay
out events, which are reflected in price behaviour. However, as managers can have more
information than investors, firms with a similar likelihood of a pay out event, from the
per-spective of investors, do not necessarily exhibit the same incidence of actual payout events.
Payout (especially dividend) initiation and omission events, which are conducted by
man-agement, reveal new information to investors, which results in positive value effects after
initiations and negative value effects after omissions (Christie, 1994, Ikenberry, Lakonishok,
and Vermaelen, 1995, Charitou, Lambertides and Theodoulou, 2011 and Bonaim´e, 2012).
for omissions (Michaely, Thaler, and Womack, 1995).
Recent financial risk related literature suggests that the value effects associated with
pay outs can be due to the new information content on firm maturity signalled to investors
in the pay out. A dividend initiation may indicate that a firm transits from a growth to a
maturity phase, and that it has fewer growth options relative to assets in place. The new
information signalled to investors results in lower systematic risks (Berk, Green and Naik,
1999), and concomitant lower discount rates and increases in firm value (Grullon, Michaely
and Swaminathan, 2002 and Grullon and Michaely, 2004).
We add to the maturity hypothesis that the value effects of the information content of
the payout signal can also arise from changes in firms’ idiosyncratic risk. As idiosyncratic
risk is indicative of growth opportunities (Hoberg and Prabhala, 2005) and cash flow risk
(Bulan, Subramanian and Tanlu, 2007), it is also expected to decline in the transition from
a firm’s high growth to a lower growth phase. For this reason we investigate whether the
information signals provided by payout initiations also influence idiosyncratic firm risk.
In principle, risk related value effects, moreover, do not only arise from signals on firm
maturation after payout initiations. If a firm faces improved investment opportunities,
which can be interpreted as a return to an earlier phase in its financial life-cycle, it may
omit payouts if it finds it optimal to finance the new opportunity internally. Concomitantly,
the firm’s systematic and idiosyncratic risks may increase and its value may decline. Of
course, a firm may also omit if it tries to cope with pure financial distress, and that may
As we wish to address the risk effects of extreme payout events comprehensively, we
distinguish dividend and share repurchase payout channel events. It is likely that there are
different anticipated effects on firm risks according to the payout channel involved. There
are different stylized contexts in which dividend and repurchase payout policies are realized
and dividends and repurchases are not perfect substitutes (Bhargava, 2010). When a firm
progresses in its financial life cycle, from a transitory income to a predominantly permanent
income (Jagannathan, Stephens and Weisbach, 2000), a firm commences pay out using
repurchases, and with the maturation of the firm’s income stream, it may decide to initiate
paying dividends (Grullon, Michaely, and Swaminathan, 2002, Grullon and Michaely, 2004).
In comparison to unexpected repurchase initiations, unexpected dividend initiations may
thus contain a stronger signal of maturation to investors, and have larger risk effects.
We apply propensity scores to identify comparable firms (Rosenbaum and Rubin, 1983),
and non-parametric local linear regression matching to facilitate difference-in-differences
tests (Heckman, Ichimura and Todd, 1998 and Guo and Fraser, 2010). Contrary to the
extant literature which matches on risk factors, we utilize a matching procedure for the
selection of the counterfactual firms, that is based on the publicly available information
in the capital market. Our counterfactual firms therefore have a comparable, ex ante,
propensity to initiate (or omit) pay outs as the firms which actually initiate (or omit). In
respect to the resulting firms, investors are unable to distinguish whether they will initiate
(or omit). We compare the risk changes of firms that do initiate (or omit) to those of
methodology corrects for confounding payout channels.
The paper is organized as follows. Section 2 states the tested hypotheses and explains
why we use a difference-in-differences propensity score matching (PSM) methodology.
Sec-tion 3 presents informaSec-tion about the dataset and associative descriptive statistics. SecSec-tion
4 presents the main results concerning “causal” relations between the information content
of payout initiations and omissions and firm risks. Section 5 reports the conclusions.
2
Hypotheses and methodology
2.1 Hypotheses
As a result of documented managerial expectations, with respect to a negative influence
of pay out on firm risks after dividend and repurchase initiations, we, first, expect that
the payout initiation will reduce aggregate systematic and idiosyncratic firm risks. When
a firm follows a policy of paying dividends (or repurchases), investors might interpret an
omission in dividend pay out (or repurchases) as providing information concerning a less
“mature” firm or concerning an increase in firm risk due to financial distress.
Value reductions arise following payout omissions and relatively small value increases
follow payout initiations. In respect to dividend (and repurchase) initiations and omissions,
we therefore, second, expect that there is an asymmetry in their influence on firm risks.
Third, as repurchases, compared to dividends, are associated with a relatively flexible
payout channel, and a less developed phase of the firm financial life-cycle, we expect smaller
dividend initiations (omissions).
2.2 Methodology
In a hypothesis testing framework, researchers may, to inform their hypotheses tests, use
comprehensive econometric models (Bhargava, 2014) or try to elicit causality effects by
replicating as closely as possible the experimental methods of biomedical sciences. We do
the latter and conduct our hypotheses tests in non-experimental settings. We test our
first set of hypotheses by using propensity score matching (PSM) in combination with
difference-in-differences, while using non-parametric local linear regression techniques. In
order to test our second and third sets of hypotheses, we test for the risk effect difference
in the difference-in-differences of the compared payout policy changes.
2.2.1 Matching on propensity scores
The underpinning rationale in regard to the construction of our sets of matched
counter-factual firms is informed by the capacity of the market to ascribe a propensity, based on
observable firm characteristics (consistent with semi-strong form market efficiency), to a
firm to self-select to a payout event. In order to account for the, ex ante, expectations of
investors in the market, we match on the propensity of a firm to initiate or omit a pay out.
This construction of sets of counterfactual firms differs from Grullon and Michaely (2004),
Grullon, Michaely and Swaminathan (2002) and Bulan, Subramaniam and Tanlu (2007)
who do not match on firm characteristics directly related to the pay out event, but rather
Our matching methodology is motivated directly by the “maturity” hypothesis which
suggests that due to an unobservable shock (from the capital market’s perspective) to the
maturity (the investment opportunity set) of the firm, the firm’s management ultimately
selects to initiate or omit pay out. The unobserved information on firm maturity which is
initially available exclusively to firm management may thus be signalled to investors by way
of a payout event. The payout event, at time periodt, is, hence, an information laden link,
in a chain, which reveals that otherwise unobservable shock. After the new information on
firm maturity investors in the market may adjust their trading of firm equity accordingly
and react less to other news (Jones, Gu and Liu, 2014), and this may hence impact firm
risks.
Our propensity scores,p, of a payout event, are conditional probability estimates from
logistic regression models on k firms comprising the “treated” firms (i) and the
“counter-factual” firms (j)
p(eventk,t= 1) =f(Xk,t−1) (1)
where X is a set of covariates observed in time period, t-1. The set of covariates is
informed, in the first instance, by values of lagged total risk. As risk is a major determinant
of the likelihood to initiate (and omit) pay outs (Lintner, 1956, Hoberg and Prabhala, 2008,
Chay and Suh, 2009), firms that are less risky are more likely to self-select to initiate pay
out. As previous risk levels are not expected to be the sole determinant of initiating
(and omitting), we correct for nine other determinants of pay out and industry dummies
squared time trend in order to account for time variation in the number of initiations and
omissions (Fama and French, 2001 and Julio and Ikenberry, 2004). Consistent with the
maturity hypothesis, we, finally, add the duration of the pay outs to the logistic regressions
of the dividend and repurchase omitting firms.
We conduct a specification test based on an orthogonality restriction between the density
of the propensity scores of the treated firms and the treated and the counterfactual firms
(Shaikh, Simonsen, Vytlacil and Yildiz, 2009), which tests whether the adopted propensity
score matching is appropriate. The logistic regressions which determine the propensity
scores and the associated diagnostic test are presented in Appendix A2.
Prior to applying the logistic regression, we use a screen, in respect to confounding pay
outs, in order to be able to make inferences on the pure effects of payout initiations and
omissions. This means that we, unlike in Grullon and Michaely (2004), Grullon, Michaely
and Swaminathan (2002) and Bulan, Subramaniam and Tanlu (2007), exclude observations
for both counterfactual firms and treated firms when the alternative payout channel is used
by the firm during the two year period before the event until one year after the event. We,
moreover, require that the treated firms do not alter their payout decision one year after
the payout event. Finally, we use one-to-many matching based on local linear regressions.
This matching procedure uses comparatively more information on the counterfactual firms
than the one-to-one standard matching algorithms used in Grullon and Michaely (2004),
2.2.2 Difference-in-differences
In respect to the treated firms that actually self-select to conduct a payout event and
the propensity score matched counterfactual firms, we apply difference-in-differences (DID)
to firm risks. As investors are, ex ante, unable to distinguish between these treated and
counterfactual firms, in respect to their propensities to a payout event, we compare the risk
changes (∆y) of firms that do initiate (or omit) (∆yi) to those of the firms that do not (∆yj).
If observed risk changes - between the treated and counterfactual firms - ultimately differ
(∆yi−∆yj 6= 0), then we infer a relation between firm risk changes and the information
content embedded in the only observed remaining difference between these sets of firms,
namely the initiation (or omission) of the pay out.
While propensity score matching mitigates time varying observable bias, in the observed
propensities to initiate (omit), in comparison to a pure DID approach, the use of DID
mitigates biases due to unobservable time invariant firm effects. In particular, the DID
approach is important if the matching in the propensity scores does not give identical
initial total, aggregate systematic or idiosyncratic risk levels for firms which conduct a
payout event and firms that do not (Chab´e-Ferret, 2012). Such differences may occur,
specifically in aggregate systematic and idiosyncratic risks, despite the comparability, from
the perspective of the investors, of the likelihood of a payout event.
We require that the DID start date of the risk measures precedes the payout event by
two years (t-2). The reason for conducting DID in this way is that we wish to compare
are the only measures by which one can estimate comparable initiation and omission
ef-fects. Repurchase announcements neither necessarily result in actual repurchases nor in
the announced amounts or timing of repurchases (Bonaim´e, 2012). Moreover, repurchase
omissions may occur without any announcement. However, we do wish to account for any
effects of announcements that may take place in the year, t-1, (before the payout event),
and so we use risk measures in t-2, two years before the actual payout event as a starting
point. Furthermore, actual payout events can take place early in the event year, t, but also
at the end of that year. For the latter reason, in conducting DID, we end our measurements
of risk effects not in the event year, but in the year after the event year, t+1. We expect
that persistent risk effects of payout events, if any, will be evident in the, ex-post, risk
measurements.
Hence, rather than rely solely on the standard matching estimator assumption of
“selec-tion on observables” we combine it with DID to “...improve the quality of non-experimental
evaluation results significantly” (Blundell and Costa-Dias, 2000, p.438). Indeed,
Heck-man, Ichimura, Smith and Todd (1998) provide evidence that this methodology, relative to
straightforward matching, is associated with lower bias.
2.2.3 The estimator and inference
The DID methodology allocates the effects of a treatment to the differences in changes
between treated and counterfactual firms. Our DID non-parametric estimator (consistent
with Rosenbaum and Rubin, 1983 and Blundell and Costa-Dias, 2000), δ, is defined as
risk) change between fiscal year (t-2) and fiscal year (t+1) for the treated (i) and the
counterfactual (j) firms, respectively. The estimator of the average treatment effect can be
expressed as
δ= 1
n X
i∈P
∆yi− X
j∈C
w(i, j)∆yj
(2)
whereP (C) represents the common support region set of all treated (counterfactual)
firms and n refers to the number of treated firms. Moreover, w(i, j) refers to the local
linear regression tri-cube kernel weights of the counterfactual firms (Guo and Fraser, 2010,
p.260).
Inference based on the PSM DID approach relies on the construction of a set of
counter-factual firms which addresses the missing observation dilemma of what would happen to the
firm risks of payout event firms if they did not conduct a pay out. The estimated average
treatment effect,δ, on the treated, is, of course, only an appropriate approximation if there
are no unobserved or unaccounted effects that make the risk changes of the counterfactual
firms different from the risk changes of the treated firms. To estimate the standard errors
for this estimator, we use the bootstrap method. The DID estimator with non-parametric
local linear regression matching is not only asymptotically normal but also asymptotically
linear and hence bootstrapping is likely to be valid in this context (Heckman, Ichimura,
3
Data description
Our dataset comprises payout initiations and omissions, from 1972 to 2012, of firms listed at
the NASDAQ or the NYSE and reporting in United States dollars. We use the
COMPUSTAT-CRSP linking table and select NYSE and NASDAQ firms with share codes 10 and 11. Our
principal payout variables are the actual initiations (omissions) of pay outs of dividends
and net repurchases. We require that dividend and repurchase observations are available,
though they may be zero. We follow Fama and French (2001) and Skinner (2008) to
calcu-late net repurchases.
To correct for survivorship bias, our dataset comprises currently active and dead firms.
We remove regulated utilities (codes 4900-4999) and financial firms (codes 6000-6999),
firms with no fiscal year ends and firms without permanent company numbers. After this
screen, we have 10,339 firms. For these remaining firms, we download the daily returns and
calculate the corresponding weekly (Wednesday) returns. The data are matched by date to
the risk free rates, the Small Minus Big and the High Minus Low returns from the website
of Kenneth French.1 We calculate the sample standard deviation of the excess weekly
Wednesday returns as a measure of total risk. Then, we estimate, for each firm year, Fama
and French (1993) Ordinary Least Squares regressions in the 52 week period preceding a
fiscal year end. We calculate the sample standard deviation of the regression residuals to
estimate the firm’s idiosyncratic risk. The aggregate systematic risk is calculated as the
square root of the difference between the squares of total and idiosyncratic risk. As a
result, we obtain the annual sample estimates of weekly total, aggregate systematic and
idiosyncratic risks.
As a constraint to ensure stock liquidity, in each fiscal year, we require that there are
not more than 5 zero weekly return observations and that there are at least 48 non-missing
values for the weekly return observations. In addition, we retain observations only when the
fiscal year end of the firm is more than a full year after the initial public offerering (IPO),
where an IPO is identified as the first day of non-zero prices in CRSP. This screening
procedure leaves 7,740 firms and up to 77,021 firm-year observations.
In panel A of Appendix A1 we present a disaggregation of total risk, TRISK, into its
constituent components of aggregate systematic risk, SRISK, and residual idiosyncratic
risk, IRISK. The disaggregation of systematic risk into the coefficients and the risk
fac-tors of the Fama and French (1993) model are not reported. The mean weekly total risk
is 7.3%. It represents an annual risk of 52.6% (7.3×√52). The reported summary risk
measurements show that the majority of total risk is idiosyncratic risk, 6.5%, and the mean
of the aggregate systematic component, SRISK, is 3.1%. Panel A of Appendix A1 also
reports the distribution of firms which adopt specific payout channels, and the risk levels
associated with these payout channels. The distinction between payout channels is
moti-vated by Renneboog and Trojanowski (2011), who distinguish three payout channels (solely
repurchases, solely dividends, and both types of pay out) besides non-payment. The main
observation is that firms which do not pay out or exclusively adopt the repurchases payout
which exclusively use the dividend payout channel or combine repurchase and dividend pay
outs exhibit smaller total risk (5.1% and 4.8%, respectively). A similar associative pattern
is reported in respect to aggregate systematic risk, SRISK, and idiosyncratic risk, IRISK.
In panel B of Appendix A1, we report the explanatory variables in the logit model
specifi-cations. We winsorize all the variables (including the risks), except for firm age, AGE, and
the duration of uninterrupted dividend, DDUR, and repurchase, RDUR, pay outs.
4
Empirical findings
In Table 1, we present the rationale for the method by which we establish the influence of
the information content of dividend initiations on firm risks. In panel A we show, consistent
with Bartram, Brown and Waller (2013), that firms paying dividends have a mean level of
total risk about 44% (0.039/0.089×100) lower than firms not paying dividends. We also
find a significantly lower aggregate systematic risk associated with dividend payers, and
also a significantly lower idiosyncratic risk. In panel B, we show that the difference in risk
measures becomes smaller, if one compares the risks of dividend initiating firms relative to
non-initiating firms. The latter group consists not only of non-payers, but also of dividend
payers and repurchasers.
[Please insert Table 1 about here.]
In panel C, we omit the confounding repurchasers. Our set of counterfactual firms is the
subset of 17,549 firm observations where there is neither a contemporaneous, a subsequent,
firms continues to pay out in the subsequent fiscal year. Using this improved benchmark
of dividend initiating firms’ counterfactuals, we show that total, aggregate systematic and
idiosyncratic risks are still significantly smaller for dividend initiators.
In panel D, we measure the changes in risks of dividend initiators from year t-2 until
year t+1, where t is the fiscal year of the dividend initiation, and compare them with
the changes in risks of the counterfactual firms. Possibly due to the maturation of the
firms over time, the firm risks reduce. The decline in the risks of the dividend initiators,
however, is larger. The difference-in-differences method indicates that the reductions of
risks of dividend initiators are also significantly greater than the risk reductions of the
counterfactual firms.
The difference-in-differences method, however, does not address the issue of whether
the initiating firms and the counterfactual firms are comparable in respect to a propensity
to initiate. In panel E, we account for observable publicly available information on ten
variables, one-digit industry dummies and a quadratic time trend in the propensity scores
from which we derive the closest comparable firms that do not initiate. The logistic equation
by which we find these comparable counterfactual firms is presented in the “DI” column
in Appendix A2. We also report in the Appendix that the Shaikh, Simonsen, Vytlacil,
and Yildiz (2009) specification test statistic does not reject the null hypothesis of a correct
logistic model specification, which allows matching.
We then allocate to each dividend initiation a weighted value of the change in risk
is estimated by local linear regression using the Stata code, psmatch2, of Leuven and Sianesi
(2003), while requiring that there is a common support region, setting the bandwidth to
0.02 and using trimming at 5%. Using bootstrapped standard errors shows significant
declines in the total, aggregate systematic and idiosyncratic risks of dividend initiators
relative to the changes in these risks for the corresponding sets of counterfactual firms
(Table 1, panel E). Having corrected for confounding variables (repurchases) and after
having matched on the observable covariates, we find support for a larger reductive effect
of the cash dividend initiations on firm risks, in comparison to the change of risks on the
comparable counterfactual firms. Specifically, after dividend initiations, there is a weekly
(annual) 1.2% (8.65%), 0.5% (3.61%) and 1% (7.21%) greater reduction in total, aggregate
systematic and idiosyncratic firm risks, respectively. We interpret this as the effect on firm
risks of the information content of a dividend initiation.
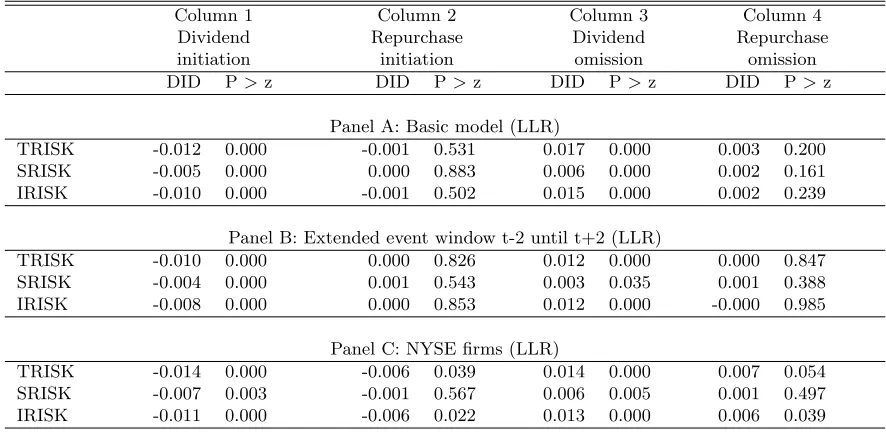
In Table 2, we use these local linear regression propensity score matching
difference-in-differences estimates, to study the influences of the information content of dividend
and repurchase initiations and omissions on firm risks. In panel A, we present findings
for dividend and repurchase initiations and omissions, consistent with panel E of Table
1. In the remaining panels of Table 2 we present robustness tests. We extend the event
window (panel B), study NYSE firms only (panel C), study firms that initiate or omit
above median real amounts of pay out (panel D), study the effects of omitting firms with
negative income in the fiscal year before omission (panel E) and we use the nearest neighbour
also conduct sensitivity analyses of our estimated treatment effects in respect to different
specifications of bandwidths and trimming. These results do not generally materially differ
from the results presented in panel A of Table 2.
[Please insert Table 2 about here.]
In panel A, we present findings for dividend and repurchase initiations and omissions.
It is evident that neither repurchase initiations nor omissions impart significant information
to the capital market which influences firm risks. In contrast, the information content of
dividend initiations and omissions impart negative and positive total, aggregate systematic
and idiosyncratic risk effects, respectively.
In panel B, we extend the event window (with one additional fiscal year) after the pay
out initiation or omission to test if there is evidence of mean reversion of risk changes after
the event. As a result, our estimates of the influence of dividend payout initiations and
omissions on firm risks (panel A) may overestimate the real effects. Panel B thus shows the
difference, from t-2 to t+2, in the changes in risk levels of the initiating and omitting firms
with the changes in risk levels of the counterfactual firms. We find that the effects of payout
initiations and omissions, across payout channels, on firm total, aggregate systematic and
idiosyncratic risks, in the extended time window, are substantively comparable to, albeit
slightly smaller than, the findings in panel A.
In panel C, we report the results for the firms listed on the NYSE. Overall, the findings
idiosyn-cratic risk effects for dividend initiations (omissions) but not for repurchase omissions. The
exceptions are in respect to the information content of repurchase initiations and
omis-sions, where significant (or marginally significant) effects on total and idiosyncratic risks
are reported.
In panel D, following Jones, Gu and Liu (2014) in respect to their study of large dividend
initiations, we conduct tests of initiations and omissions in respect to large real pay out
amounts (above the median of real pay out amounts) relative to counterfactual firms. In
this panel, we find again significant influences on firm risks in respect to both dividend
initiations and omissions. In the context of large real payout amounts, we also find a
significant positive influence of large repurchase omissions on firm risks. In panel E, we
show, for omitting firms with negative net income in the previous year, the estimation of
the information content of payout omissions in respect to firm risks. We find results that
do not substantively differ from those reported in panel A. In panel F, the basic model is
estimated using nearest neighbour matching with no replacement and the results are not
found to materially alter for dividends. However, there is evidence of a decline in total and
idiosyncratic risks for repurchase initiators.
In Table 3, we report if there are significantly different risk effects between single
pay-out channel initiations and omissions (columns 1 and 2) and different risk effects between
different payout channel initiations/omissions (columns 3 and 4), using mean difference
in difference-in-differences in risks about payout events. The test results are reported for
[Please insert Table 3 about here.]
In column 1, we report, across panels A to F, that there is no significant difference
between absolute risk effects after dividend initiations and omissions. In column 2, we
report that there is also no difference in absolute risk effects after repurchase initiations
and omissions. The main implication of these results is that the well-known value effect
asymmetry after payout initiations and omissions cannot be entirely explained by changes
in firm risks. Turning to column 3 (4), we show that the differences in risks after
initi-ations (omissions) between payout channels is generally significant. This finding suggests
that repurchases and dividends are not substitutes. Their risk effects are not comparable.
The findings are substantively similar across panels A:F. As noteworthy exceptions, the
aggregate systematic risk effect after dividend and repurchase omissions does not appear
to significantly differ in respect to an extended event window (panel B) and NYSE firms
(panel C). In respect to NYSE firms (panel C), total and idiosyncratic risk effects also do
not significantly differ across dividend and repurchase initiations (omissions).
5
Conclusion
Firm payout initiations and omissions impart value effects either as inadvertent
manifes-tations of these payout decisions or as deliberate payout signals provided by management.
Such value effects may be caused by changes in risk and it is therefore not surprising that
Brav, Graham, Harvey and Michaely (2005) find that many managers believe that there is
informa-tion content of payout initiainforma-tions and omissions on total and idiosyncratic risks as well as
on aggregate systematic risk, which includes the market, the Small Minus Big and the High
Minus Low risk factor measures of Fama and French (1993). This influence is estimated
through difference-in-differences obtained by local linear regression after propensity score
matching (Heckman, Ichimura and Todd 1998 and Guo and Fraser, 2010), informed by
publicly available information and in line with the semi-strong form of the efficient market
hypothesis (Fama, 1970).
One major finding is that the information contents of dividend and repurchase initiations
(omissions) differ. Dividend initiations (omissions), consistent with the life-cycle maturity
hypothesis, reduce (increase) firm total, aggregate systematic and idiosyncratic risks, while
the initiation (omission) of share repurchases generally does not. This supports the idea
that risk averse managers are reluctant to omit dividends (Lintner, 1956), but that this is
not necessarily the case for omitting repurchases. Furthermore, this finding weakens the
case for analysing total pay outs (Skinner, 2008), as it is necessary to distinguish dividends
and repurchases concerning risk effects.
Therefore, in corroboration with findings in Grullon, Michaely, and Swaminathan (2002)
in respect to dividend payout changes, but unlike Bulan, Subramanian and Tanlu (2007),
we find that the aggregate systematic risk of a firm is influenced by the information
con-tent of dividend initiations. We also find that idiosyncratic and total risks are influenced
by dividend initiations and omissions. Our findings do not generally change in respect
ini-tiations and omissions when firms make losses. As far as risk is concerned, changes in
systematic and idiosyncratic risks after dividend initiations (omissions), can be considered
as a potential cause of a change in firm value. Generally, we do not find risk effects
af-ter repurchase initiations or omissions. The insignificant aggregate systematic risk effects
of repurchase initiations and omissions in the majority of cases are inconsistent with the
findings of Grullon and Michaelly (2004). However, noteworthy exceptions include total
and idiosyncratic risk decreases after NYSE firm repurchase initiations and idiosyncratic
risk increases after NYSE repurchase omissions. Furthermore, after repurchase omissions
by large real amounts, total, aggregate systematic and idiosyncratic risks increase.
Extensions of the present paper may prove insightful. For instance, it may be worthwhile
to explore the influences on firm risks if the alternative payout type is concurrently used or
if one type of payout replaces the other. In addition, a pay out switch from no pay out to
a simultaneous initiation of both payout types may be investigated. This is an interesting
avenue of future research as a combination of both payout types is now prevalent in practice
(Renneboog and Trojanowski, 2011). Furthermore, given the well-documented asymmetry
of value effects across dividend initiations and omissions and the symmetric risk effects
documented in this paper, it would be especially interesting to study value and cash flow
effects using the adopted local linear regression propensity score matching
difference-in-differences methodology. Finally, as we show that dividend payout initiations and omissions
strongly influence idiosyncratic risks, future research might be able to assess the extent to
References
Abadie, A., Imbens, G.W., 2006. Large sample properties of matching estimators for average treatment effects. Econometrica 74, 235-267.
Bartram, S.M., Brown, G., Waller, W., 2013. How important is financial risk? Journal
of Financial and Quantitative Analysis,forthcoming.
Berk, J.B., Green, R.C., Naik, V., 1999. Optimal investment, growth options, and security returns. Journal of Finance 54, 1553-1607.
Bhargava, A., 2010. An econometric analysis of dividends and share repurchases by U.S. firms. Journal of the Royal Statistical Society: Series A 173, 631-656.
Bhargava, A., 2014. Dividend payments and share repurchases of U.S. firms: An econo-metric approach. In: Lee, C-F., Lee, J.C. (Eds.), Handbook of Financial Economet-rics and Statistics, Springer.
Blundell, R., Costa-Dias, M., 2000. Evaluation methods for non-experimental data. Fiscal Studies 21, 427-468.
Bonaim´e, A.A, 2012. Repurchases, reputation, and returns. Journal of Financial and
Quantitative Analysis 47, 469-491.
Brav, A., Graham, J.R., Harvey, C.R., Michaely, R., 2005. Payout policy in the 21st
century. Journal of Financial Economics 77, 483-527.
Brockman, P., Unlu, E., 2009. Dividend policy, creditor rights and the agency costs of debt. Journal of Financial Economics 92, 276-299.
Bulan,L., Subramanian,N., Tanlu,L., 2007. On the timing of dividend initiations. Fi-nancial Management 36, 31-65.
Chab´e-Ferret, S., 2012. Matching vs differencing when estimating treatment effects
with panel data: The example of the effect of job training programs on earnings. TSE Working Paper No. 12-356, Toulouse School of Economics.
Charitou, A., Lambertides, N., Theodoulou, G., 2011. Dividend increases and ini-tiations and default risk in equity returns. Journal of Financial and Quantitative Analysis 46, 1521-1543.
Chay, J.B., Suh, J., 2009. Payout policy and cash-flow uncertainty. Journal of Financial Economics 93, 88-107.
Fama, E.F., 1970. Efficient capital markets: A review of theory and empirical work. Journal of Finance 25, 383-417.
Fama, E.F., French, K.R., 1993. Common risk factors in the returns on stocks and bonds. Journal of Financial Economics 56, 3-56.
Fama, E.F., French, K.R., 2001. Disappearing dividends: Changing characteristics or lower propensity to pay? Journal of Financial Economics 60, 3-43.
Fr¨olich, M., 2004. Finite-sample properties of propensity-score matching and weighting
estimators. The Review of Economics and Statistics 86, 77-90.
Grullon, G., Michaely, R., 2004. The information content of share repurchase programs. Journal of Finance 59, 651-680.
Grullon, G., Michaely, R., Swaminathan, B., 2002. Are dividend changes a sign of firm maturity? The Journal of Business 75, 387-424.
Guo, S., Fraser, M.W., 2010. Propensity score analysis: Statistical methods and ap-plications. Advanced Quantitative Techniques in the Social Sciences Series 11, Sage Publication.
Heckman, J.J., Ichimura, H., Todd, P.E., 1998, Matching as an econometric evaluation estimator. Review of Economic Studies 65, 261-294.
Heckman, J.J., Ichimura, H., Smith, J., Todd, P.E., 1998, Characterising selection bias using experimental data. Econometrica 66, 1017-1099.
Hoberg, G., Prabhala, N.R., 2008. Disappearing dividends, catering, and risk. Review of Financial Studies 22, 79-116.
Ikenberry, D., Lakonishok, J., Vermaelen, T., 1995. Market underreaction to open market share repurchases. Journal of Financial Economics 39, 181-208.
Jagannathan, M., Stephens, C.P., Weisbach, M.S., 2000. Financial flexibility and the choice between dividends and stock repurchases. Journal of Financial Economics 57, 355-384.
Jones, J.S., Gu, J., Liu, P., 2014. Do dividend initiations signal a reduction in risk? Evidence from the option market. Review of Quantitative Finance and Accounting 42, 143-158.
Julio, B., Ikenberry, D., 2004. Reappearing dividends. Journal of Applied Corporate Finance 16, 89-100.
Leuven, E., Sianesi, B., 2003. PSMATCH2: Stata module. (Revised version of
2012-07-19). Available via Internet: /http://ideas.repec.org/c/boc/bocode/s432001.
Lintner, J., 1956. Distribution of incomes of corporations among dividends, retained earnings, and taxes. The American Economic Review 46, 97-113.
Michaely, R., Thaler, R.H., Womack, K.L., 1995. Price reactions to dividend initiations and omissions: Overreaction or drift? Journal of Finance 50, 573-608.
Renneboog, L., Trojanowski, G., 2011. Patterns in payout policy and payout channel choice. Journal of Banking and Finance 35, 1477-1490.
Rosenbaum, P.R., Rubin, D.B., 1983. The central role of the propensity score in ob-servational studies for causal effects. Biometrika 70, 41-55.
Shaikh, A.M., Simonsen, M., Vytlacil, E.J., Yildiz, N., 2009. A specification test for the propensity score using its distribution conditional on participation. Journal of Econometrics 151, 33-46.
Table 1 The rationale to establish the influence of NYSE and NASDAQ dividend initiations on firm risks, 1972-2012
Observations TRISK SRISK IRISK Panel A: Differences in firm risks of dividend paying firms versus firms that do not pay dividends Non payer 45,778 0.089 0.035 0.080
Payer 31,243 0.050 0.024 0.043 Difference -0.039 -0.011 -0.037
P-value 0.000 0.000 0.000
Panel B: Differences in firm risks of dividend initiating firms versus firms that do not initiate dividends Non initiator 75,454 0.074 0.031 0.065
Initiator 1,567 0.067 0.029 0.058 Difference -0.007 -0.002 -0.007
P-value 0.000 0.011 0.000
Panel C: Differences in firm risks of dividend initiating firms (D=1 & FD=1) versus firms that do not initiate dividends (D=0 & FD=0), with an additional screen: LLD=0 & LD=0 & LLR=0 & LR=0 & R=0 & FR=0 Non initiator 17,549 0.091 0.036 0.081
Initiator 407 0.064 0.029 0.056 Difference -0.026 -0.007 -0.025
P-value 0.000 0.000 0.000
Observations DTRISK DSRISK DIRISK
Panel D: Differences in firm risk changes between fiscal years t-2 and t+1 for dividend initiating firms (D=1 & FD=1) versus firms that do not initiate dividends (D=0 & FD=0), with an additional
screen: LLD=0 & LD=0 & LLR=0 & LR=0 & R=0 & FR=0
Non initiator 14,818 -0.003 -0.001 -0.003 Initiator 361 -0.013 -0.005 -0.012 Difference -0.010 -0.004 -0.009
P-value 0.000 0.000 0.000
Panel E: Differences in firm risk changes between fiscal years t-2 and t+1 for dividend initiating firms (D=1 & FD=1) versus firms that do not initiate dividends (D=0 & FD=0), with an additional screen: LLD=0 & LD=0 & LLR=0 & LR=0 & R=0 & FR=0 and local linear regression
matching based on ten observed variables, a quadratic time trend and one digit industry dummies Non initiator 14,711 -0.002 -0.000 -0.002
Initiator 339 -0.015 -0.006 -0.013 Difference -0.012 -0.005 -0.010 P-value (bootstrapped) 0.000 0.000 0.000
Table 2 Difference-in-differences effects of NYSE and NASDAQ payout initiations and omis-sions after propensity score matching, 1972-2012
Column 1 Column 2 Column 3 Column 4 Dividend Repurchase Dividend Repurchase initiation initiation omission omission DID P>z DID P>z DID P>z DID P>z
Panel A: Basic model (LLR)
TRISK -0.012 0.000 -0.001 0.531 0.017 0.000 0.003 0.200 SRISK -0.005 0.000 0.000 0.883 0.006 0.000 0.002 0.161 IRISK -0.010 0.000 -0.001 0.502 0.015 0.000 0.002 0.239
Panel B: Extended event window t-2 until t+2 (LLR)
TRISK -0.010 0.000 0.000 0.826 0.012 0.000 0.000 0.847 SRISK -0.004 0.000 0.001 0.543 0.003 0.035 0.001 0.388 IRISK -0.008 0.000 0.000 0.853 0.012 0.000 -0.000 0.985
Panel C: NYSE firms (LLR)
TRISK -0.014 0.000 -0.006 0.039 0.014 0.000 0.007 0.054 SRISK -0.007 0.003 -0.001 0.567 0.006 0.005 0.001 0.497 IRISK -0.011 0.000 -0.006 0.022 0.013 0.000 0.006 0.039 Panel D: Large real amounts involved in the payout initiation or omission versus firms that do not change
their policy (LLR)
TRISK -0.015 0.000 -0.002 0.218 0.020 0.000 0.008 0.010 SRISK -0.008 0.000 -0.001 0.455 0.011 0.000 0.005 0.004 IRISK -0.012 0.000 -0.002 0.265 0.017 0.000 0.006 0.030
Panel E: Basic model, but dividend and repurchase omissions measured for firms with negative lagged income (LLR)
TRISK -0.012 0.000 -0.001 0.531 0.013 0.000 -0.001 0.770 SRISK -0.005 0.000 0.000 0.883 0.006 0.001 -0.002 0.448 IRISK -0.010 0.000 -0.001 0.502 0.012 0.000 -0.000 0.908
Panel F: Basic model with one nearest neighbour (NN) matching and no replacement TRISK -0.013 0.000 -0.005 0.021 0.019 0.000 0.004 0.156 SRISK -0.006 0.000 -0.001 0.610 0.008 0.000 0.002 0.129 IRISK -0.011 0.000 -0.005 0.009 0.017 0.000 0.003 0.184
[image:26.612.91.534.147.363.2]Table 3 Comparison of the different NYSE and NASDAQ risk effects between single payout channel initiations and omissions and between different payout channel initiations and omissions, 1972-2012
Column 1 Column 2 Column 3 Column 4 - DI - DO - RI - RO DI - RI DO - RO DDD P>z DDD P>z DDD P>z DDD P>z
Panel A: Basic model
TRISK -0.004 0.225 -0.002 0.502 -0.011 0.000 0.014 0.000 SRISK -0.000 0.770 -0.002 0.223 -0.006 0.000 0.004 0.035 IRISK -0.005 0.112 -0.001 0.587 -0.009 0.000 0.013 0.000
Panel B: Extended event window t-2 until t+2
TRISK -0.003 0.357 -0.001 0.774 -0.010 0.000 0.012 0.001 SRISK 0.001 0.658 -0.002 0.294 -0.005 0.001 0.002 0.217 IRISK -0.004 0.133 -0.000 0.927 -0.008 0.000 0.012 0.000
Panel C: NYSE firms
TRISK -0.000 0.924 -0.001 0.900 -0.007 0.071 0.007 0.128 SRISK 0.001 0.736 -0.000 0.887 -0.006 0.054 0.004 0.153 IRISK -0.002 0.654 -0.000 0.905 -0.005 0.157 0.006 0.150
Panel D: Large real amounts involved in the payout initiation or omission versus firms that do not change their payout policy
TRISK -0.005 0.222 -0.005 0.129 -0.013 0.000 0.012 0.004 SRISK -0.003 0.277 -0.004 0.052 -0.007 0.000 0.005 0.048 IRISK -0.004 0.194 -0.004 0.207 -0.010 0.000 0.011 0.004
Panel E: Basic model, but dividend and repurchase omissions measured for firms with negative lagged income
TRISK -0.001 0.772 0.002 0.619 -0.011 0.000 0.015 0.005 SRISK -0.001 0.770 0.002 0.517 -0.006 0.000 0.008 0.006 IRISK -0.001 0.696 0.001 0.729 -0.009 0.000 0.012 0.011
Panel F: Basic model with one nearest neighbour (NN) matching and no replacement TRISK -0.006 0.126 0.001 0.713 -0.009 0.011 0.016 0.000 SRISK -0.001 0.604 -0.001 0.424 -0.006 0.005 0.006 0.009 IRISK -0.006 0.064 0.002 0.553 -0.006 0.041 0.014 0.000
Appendix A1 Descriptive statistics of the variables, NYSE and NASDAQ, 1972-2012
Panel A: Means of the weekly risk measures
Observations TRISK SRISK IRISK
All observations 77,021 0.073 0.031 0.065 D=0, R=0 33,960 0.092 0.036 0.083 D=0, R=1 11,818 0.082 0.033 0.073 D=1, R=0 20,662 0.051 0.025 0.044 D=1, R=1 10,581 0.048 0.024 0.041
Panel B: Descriptive statistics of the variables
Observations Mean SD Median Min Max TRISK 77,021 0.073 0.040 0.063 0.020 0.264 SRISK 77,021 0.031 0.019 0.026 0.004 0.118 IRISK 77,021 0.065 0.038 0.055 0.017 0.250 LNTA 77,021 5.267 1.910 5.111 1.198 10.697 RETE 76,891 -0.443 5.256 0.479 -47.476 22.586 NITA 77,018 -0.025 0.252 0.040 -1.830 0.305 DATA 77,021 0.126 0.388 0.065 -0.623 2.946 MTB 76,695 2.461 4.427 1.654 -20.579 36.325 LTDTA 76,843 0.173 0.182 0.130 0.000 0.964 CATA 77,019 0.167 0.202 0.081 0.000 0.932 SDNITA 77,018 0.080 0.148 0.031 0.001 1.207 AGE 77,021 12.928 10.236 10.000 2.000 52.000 DDUR 77,021 4.132 7.575 0.000 0.000 41.000 RDUR 77,021 0.984 2.260 0.000 0.000 31.000