26
A proportional analysis of dissimilar Mobility Models in
Ad- hoc Sensor Network over DSR Protocol
V.Vasanthi
Ph.D Research Scholar, Department of Computer Science,
Karpagam University Coimbatore.
Hemalatha.M
Prof & Head,
Department of Software Systems and Research, Karpagam University
Coimbatore.
ABSTRACT
With the current advances like wireless networks is becoming most useful technology is increasing popularity. Simulation is the technique which is used for evaluation of wireless networks. There is numerous number of Network Simulator’s available. Here we are using NS2 simulation tool is used to find that which mobility model is best for real-life Scenarios. The Mobility model gives information like movement of nodes and how it works with the protocol and connectivity of nodes in an excellent manner. In this paper we are analyzing the mobility model which is best in incorporate more Realistic mobility model. We are taken four different mobility model in different models like entity models (Manhattan model and gauss markov model) and group mobility model (Reference Point Group Model) and Random Waypoint mobility model. Random waypoint is used as a default mobility model in many network simulations. Our comparative analysis for the mobility models which is existing mobility models are discussed on a variety of simulation settings and parameters to find these results are as follows Control Overhead, Generated packets and Received packets.
Keywords
Mobility models, DSR protocol, RWP, MM, Gauss-markov, RPGM, Manhattan, Ad-hoc Sensor Network, Simulation
1.
INTRODUCTION
Ad-hoc Wireless Sensor Networks: It is an emerging recent interested topic in wireless ad-hoc networks and in particularly wireless sensor networks as a Research topic. It is a wireless, self-organizing, sensing, processing, and communication systems formed by co-operating sensor nodes within communication range of each other that forms temporary network. In this their topology is dynamic, decentralized, ever changing and the sensor nodes may move around arbitrarily. The progress in computational and communicational technology is an emerging field based on low cost and also for reliability. They have great long-term economic potential, ability to transform our lives; it gives new technological and conceptual optimized problems. Some, such as location, deployment, and tracking some environment, are fundamental issues and then, in that many applications rely on them for needed information.
Important characteristics of AWSN are:
• Mobility of nodes • Node failures
• Scalability
• Dynamic network topology
• Communication failures • Heterogeneity of nodes
• Large scale of deployment
Mobility model is the model which gives the movement of nodes is found to have significant impact on analysis of results. The movement patterns have an influence the topology of network. Due to this reason, many different mobility models are proposed in last decade.
The rest of the paper is organized as follows: Section 2 describes related works with regards to studying the performance of different mobility models using routing Protocol. Section 3 overview of DSR routing protocol and discussion of the mobility models like Random Way point, Reference Point Group Mobility Model, Manhattan and the Gauss-Markov mobility models. Section 4 illustrates the simulation results and compares the mobility models with respect to the results obtained for the Control overhead, Packets generated, and Received Packets. Section 6 conclusion and Future work of this paper.
2.
RELATED WORKS
A brief survey of performance metrics, mobility metrics and routing in WSNs is presented in this section. WSN have been an extensively studied area of research, [1] examines the area in detail giving a review of the architecture ranging from management, communication, coordination, and current and potential applications. Broch et al., [11] evaluates that on-demand protocol such as Dynamic Source Routing and AODV perform better than table-driven ones such as Destination Sequenced Distance Vector (DSDV) routing protocol at high mobility rates, while DSDV perform quite well at low mobility rates. High mobility and its effects on the network operation have also been explored recently in WSN. In [14], the author compares the performance of proactive Destination Sequenced Distance Vector (DSDV) Protocols under the Different Mobility Models. Random mobility has been studied for improving data capacity [3], [4] and networking performance [1]. However, in such cases the latency of data transfer cannot be bounded deterministically, and delivery itself is in jeopardy if the data is cleared from the sensor node buffer.
3.
DYNAMIC SOURCE ROUTING (DSR)
PROTOCOL:
27 uses source routing supplied by packet’s originator to
determine packet’s path through the network instead of independent hop-by-hop routing decisions made by each node [8].
The packet in source routing which is going to be routed through the network carries the complete ordered list of nodes in its header through which the packet will pass. Fresh routing information [9] is not needed to be maintained in intermediate nodes in design of source routing, since all the routing decisions are contained in the packet by themselves.
4.
DISCUSSION OF MOBILITY
MODELS (MM):
In this section we are going to present about the mobility models studied in this paper as follows [14]. These models are in builded in Bonn motion tool.
Random waypoint model (RWP):
In this model nodes are assumed to be placed randomly in the simulation Area. The movement of each node is independent of other nodes [14]. The nodes are chosen as random target location to move. In this model nodes are distributed randomly over a convex Area [12].
Manhattan model (MHN):
In this model it is assume the region is divided into grid and then the square blocks of identical block length. The nodes movement is decided from one street at one time [14]. To start with this equal chance is given to every node. After a node is selected in initial location, a node begins to move in same direction and reaches in other street intersections, then the subsequent street in which it moves to chosen probabilistically.
Reference Point Group Mobility (RPGM)
:
It is group mobility model. It is a Spatial Dependencies mobility model. The RPGM mobility model works as follows: Nodes move as a group with each group having a group leader (a logical centre for the group) whose movement determines the group’s mobility pattern.Gauss-markov mobility model (GM)
:
The nodes are placed as randomly and it works as independently.It is a Temporal Dependencies mobility model. In this model initially, the nodes are placed at random locations in the network. The movement of a node is independent of the other nodes in the network [14]. Each node i have assigned a mean speed, i S, and mean direction, i of movement. For every constant time period, a node the speed and direction of movement based on the speed and direction during the previous time period, along with a certain degree of randomness incorporated in the calculation.
5.
SIMULATION RESULTS:
To assess the performance of DSR protocol with different mobility model .we have implemented them within the version 2.24 of the ns2 [17] network simulator. The performance analysis for these simulations was conducted by using the discrete-event simulator, NS2. The simulator was used to simulate the mobility environment and the Open System Interconnections (OSI) layers utilized in wireless simulation. The gateway selection function uses in all cases the criterion of minimum distance to the gateway, in order to get a fair comparison between the approaches. The periodic advertisements sent out by the gateways are issued every 2 seconds. We have set up a scenario consisting of 50 to 250 mobile nodes using 802.11b at 2 Mb/s with a radio range of 300 m. The size of area is 1000*1000m2. Ten active UDP
sources have been simulated, sending out a constant bit rate of 20Kb/s using 512 bytes/packet.
Movement patterns have been generated using the Bonn Motion [10, 11] tool, creating scenarios with the Random Waypoint, Gauss–Markov and Manhattan mobility models, Reference point group mobility model. Random Waypoint is the most widely used mobility model in MANET research because of its simplicity. Nodes select a random speed and destination around the simulation area and move toward that destination. Then they stop for a given pause time and repeat the process. The Gauss–Markov model makes nodes movements to be based on previous ones, so that there are not strong changes of speed and direction. Finally, Manhattan Grid models the simulation area as a city section which is only crossed by vertical and horizontal streets. Nodes are only allowed to move through these streets.
All simulations have been run during 300seconds, with speeds randomly chosen between 0 m/s and (2, 4, 6, 8, 10) m/s as a Speed Variations in all mobility models. In this subsection we focus on the following as control overhead, dropped Packets and Received Packets as a metric during the simulation in order to evaluate the performance of the different mobility models.
5.1
Control Overhead (CO):
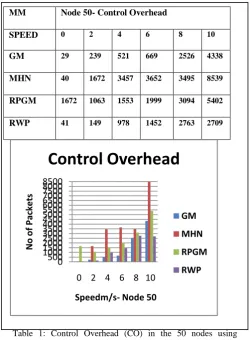
The control overhead is defined as the total number of control packets exchanged successfully.Table1 and Fig 1
:
CO in 50 nodes
Table1
:
CO in 50 nodes
Table 1: Control Overhead (CO) in the 50 nodes using different Mobility model with different Speed (maximum speed = 10 m/s).In Table 1 and fig 1 represents the Control Overhead in accordance with Speed. By using 50 nodes, the performance of Manhattan model gives better CO results. At 0 Speed RPGM is giving 1672 packets as high packets, and for Speed 2, 4, 6, 8, 10 Manhattan models giving high
MM Node 50- Control Overhead
SPEED 0 2 4 6 8 10
GM 29 239 521 669 2526 4338
MHN 40 1672 3457 3652 3495 8539
RPGM 1672 1063 1553 1999 3094 5402 RWP 41 149 978 1452 2763 2709
0 500 1000 1500 2000 2500 3000 3500 4000 4500 5000 5500 6000 6500 7000 7500 8000 8500
0 2 4 6 8 10
N
o
o
f Pack
e
ts
Speedm/s- Node 50
Control Overhead
GM
MHN
RPGM
[image:2.595.303.554.371.712.2]28 transmission of packets successfully and also it differs with
[image:3.595.80.549.73.747.2]other models.
Table 2 and Fig 2
:
CO in 50 nodes
able 2 and fig2: CO in 100 nodes
6.
TYPESET TEXT
6.1
Normal or Body Text
Please use a 9-point Times Roman font, or other R
6.2
This paragraph is a repeat of 3.1
[image:3.595.240.550.90.584.2]Please use a 9-point Times Roman font, or other Roman font with serifs, as close as possible in appearance to Times Roman in which these guidelines have been set. The goal is to have a 9-point text, as you see here. Please use sans-serif or non-proportional fonts only for special purposes, such as distinguishing source code text. If Times Roman is not available, try the font named Computer Modern Roman. On a Macintosh, use the font named Times. Right margins should be justified, not ragged.
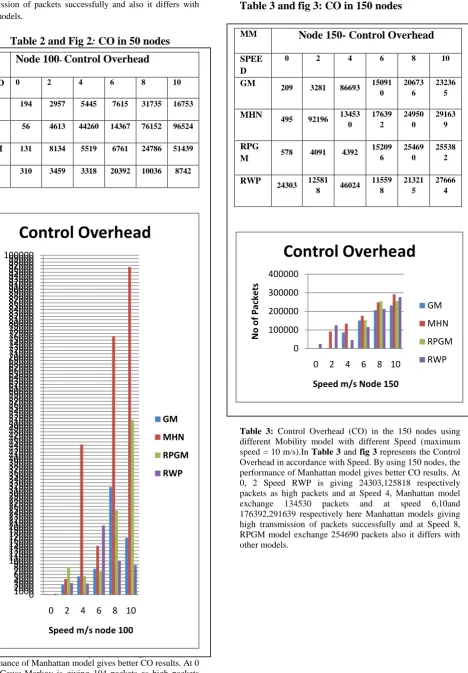
Table 2: Control Overhead (CO) in the 100 nodes
using different Mobility model with different
Speed (maximum speed = 10 m/s). In Table 2 and
fig 2 represents the Control Overhead in
By Table 2: Control Overhead (CO) in the 100 nodes using different Mobility model with different Speed (maximum speed = 10 m/s). In Table 2 and fig 2 represents the Control Overhead in accordance with Speed. By using 100 nodes, the performance of Manhattan model gives better CO results. At 0 Speed Gauss-Markov is giving 194 packets as high packets and at Speed 2,RPGM model exchange 8134 packets and at speed 4,6,8,10and 44260,14367,76152,96524 respectively here Manhattan models giving high transmission of packets successfully and also it differs with other models.
Table 3 and fig 3: CO in 150 nodes
Table 3: Control Overhead (CO) in the 150 nodes using different Mobility model with different Speed (maximum speed = 10 m/s).In Table 3 and fig 3 represents the Control Overhead in accordance with Speed. By using 150 nodes, the performance of Manhattan model gives better CO results. At 0, 2 Speed RWP is giving 24303,125818 respectively packets as high packets and at Speed 4, Manhattan model exchange 134530 packets and at speed 6,10and 176392,291639 respectively here Manhattan models giving high transmission of packets successfully and at Speed 8, RPGM model exchange 254690 packets also it differs with other models.
MM
Node 100
-Control Overhead
SPEED 0 2 4 6 8 10
GM 194 2957 5445 7615 31735 16753
MHN 56 4613 44260 14367 76152 96524 RPGM 131 8134 5519 6761 24786 51439 RWP 310 3459 3318 20392 10036 8742
0 1000 2000 3000 4000 5000 6000 7000 8000 9000 10000 11000 12000 13000 14000 15000 16000 17000 18000 19000 20000 21000 22000 23000 24000 25000 26000 27000 28000 29000 30000 31000 32000 33000 34000 35000 36000 37000 38000 39000 40000 41000 42000 43000 44000 45000 46000 47000 48000 49000 50000 51000 52000 53000 54000 55000 56000 57000 58000 59000 60000 61000 62000 63000 64000 65000 66000 67000 68000 69000 70000 71000 72000 73000 74000 75000 76000 77000 78000 79000 80000 81000 82000 83000 84000 85000 86000 87000 88000 89000 90000 91000 92000 93000 94000 95000 96000 97000 98000 99000 100000
0 2 4 6 8 10
N o o f p ac ke ts
Speed m/s node 100
Control Overhead
GM
MHN
RPGM
RWP
MM
Node 150- Control Overhead
SPEED
0 2 4 6 8 10
GM
209 3281 86693 15091 0
20673 6
23236 5
MHN 495 92196 13453 0 17639 2 24950 0 29163 9 RPG
M 578 4091 4392
15209 6 25469 0 25538 2 RWP
24303 12581
8 46024 11559 8 21321 5 27666 4 0 100000 200000 300000 400000
0 2 4 6 8 10
N o o f Pack e ts
Speed m/s Node 150
Control Overhead
GM
MHN
RPGM
[image:3.595.44.301.98.735.2]29
Table 4 and fig 5: CO in 200 nodes
Please use a 9-point Times Roman font, or other Roman font with serifs, as close as possible in appearance to Times Roman in which these guidelines have been set. The goal is to have a 9-point text, as you see here. Please use sans-serif or non-proportional fonts only for special purposes, such as distinguishing source code text. If Times Roman is not available, try the font named Computer Modern Roman. On a
Table 4: Control Overhead (CO) in the 200 nodes using
different Mobility model with different Speed (maximum
speed = 10 m/s). In Table 4 and fig 4 represents the Control
Overhead in accordance with Speed. By using 200 nodes, the
performance of RPGM model gives better CO results. At 0,
Speed RPGM is giving 71180 respectively packets as high
packets and at Speed 2, RWP model exchange 304784
packets and at speed 4,6 packets exchanged 473917,514712
respectively and at Speed 8,RWP model exchange 628702
packets and at Speed 10, RPGM models giving high
transmission of 740247 packets successfully also it differs
with other models.
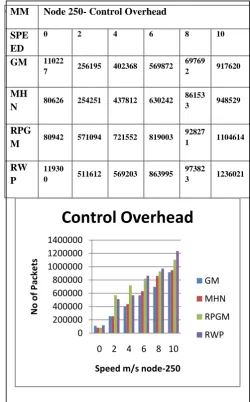
Table 5and fig 5: CO in 250 nodes
: CO in 250 nodes
Table 4: Control Overhead (CO) in the 250 nodes using
different Mobility model with different Speed (maximum
speed = 10 m/s). In Table 5 and fig 5 represents the Control
Overhead in accordance with Speed. By using 250 nodes, the
performance of RWP model gives better CO results. At 0
Speed, RWP is giving 119300 packets are exchanged
successfully and at Speed 2,4, RPGM model exchange
571094,721552 packets respectively and at 6 Speed RWP
model exchange 863995 packets which giving high
transmission of packets successfully and at Speed 8,10,
RPGM model exchange 973823,1236021 packets respectively
also it differs with other models.
Overview of Control Overhead (CO): This Control
overhead (CO) estimate gives us an idea about how
successful the protocol is in exchanging packets to the
application layer. A high value indicates that most of the
packets are being exchanged to the higher layers and is a
good indicator of the DSR protocol performance and
Different Mobility models. Among different mobility models
Manhattan model and RPGM models exchanging the packets MM
Node 200- Control Overhead
SPEED 0 2 4 6 8 10
GM 61527 187830 288050 417917 495131 607848
MHN 36434 146496 285299 387865 503112 548114
RPGM 71180 303741 473917 514712 599167 740247
RWP 316 304784 439703 510587 628702 557924
0 200000 400000 600000 800000
0 2 4 6 8 10
N
o
o
f Pack
e
ts
Speed M/s Node-200
Control Overhead
GM
MHN
RPGM
RWP
MM Node 250- Control Overhead
SPE ED
0 2 4 6 8 10
GM 11022
7 256195 402368 569872 69769
2 917620
MH
N 80626 254251 437812 630242
86153
3 948529
RPG
M 80942 571094 721552 819003
92827
1 1104614
RW P
11930
0 511612 569203 863995 97382
3 1236021
0 200000 400000 600000 800000 1000000 1200000 1400000
0 2 4 6 8 10
N
o
o
f Pack
e
ts
Speed m/s node-250
Control Overhead
GM
MHN
RPGM
[image:4.595.34.307.72.414.2]30 overall performance is good among the other models which
we selected the models from group and random models.
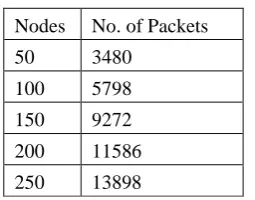
2. Generated Packets (GP):
It is defined as Number of Packets Generated Successfully.Nodes No. of Packets
50 3480
100 5798
150 9272
200 11586
250 13898
The above mentioned table gives generated packets for nodes
50 -250 Received Packets (RP) in the 50 nodes using different
Mobility model with different Speed (maximum speed = 10
m/s at time intervals of 2 m/s).At Node 50,100,150,200,250
the result of generated packets are same in all mobility models
which we are compared.
[image:5.595.67.195.134.234.2]3. Received Packets (RP
):
It is defined as number of packets received to the destination successfully.Table 6 and fig 6: RP in 50 nodes
Table 6: Received Packets (RP) in the 50 nodes using different Mobility model with different Speed (maximum speed = 10 m/s). In Table 6 and fig 6 represents the Received Packets in accordance with Speed. By using 50 nodes, the performance of RWP, Gauss-Markov model gives better RP results. At 0 Speed, RWP, Gauss-Markov and Manhattan is giving 3480 packets are Received to Destination successfully and at Speed 2,4, Gauss-Markov
[image:5.595.57.372.142.694.2]model receive 3469,3434 packets respectively and at 6 Speed Gauss-Markov model receive 3429 packets successfully and at Speed 8,10, Gauss-Markov model receive 3353,3289 packets respectively also it differs with other models. In overall node 50 RPGM model is very less packets are received among the other models.
Table 7and fig 7: RP in 100 nodes
Table 7: Received Packets (RP) in the 100 nodes using different Mobility model with different Speed (maximum speed = 10 m/s). In Table 7 and fig 7 represents the Received Packets in accordance with Speed. By using 100 nodes, the performance of RWP, Gauss-Markov model gives better RP results. At 0,2 Speed, Manhattan is giving 5798,5657 packets are Received to Destination successfully and at Speed 4, RWP model receive 5690 packets respectively and at 6 Speed Gauss-Markov model receive 5642 packets successfully and at Speed 8, RWP model receive 5433 packets and at Speed 10,Gauss-Markov Model receive 5511 packets successfully and also it differs with other models. In overall node 100, the performance of RPGM model is very fewer packets are received among the other models.
MM Node 50- Received Packets
SPEE D
0 2 4 6 8 10
GM 3480 3469 3434 3429 3353 3289
MHN 3480 2000 3036 2946 3081 2902
RPGM 2000 2789 1731 3081 1630 1565
RWP 3480 3465 3433 3368 3235 3306
0 1000 2000 3000 4000
0 2 4 6 8 10
N
o
o
f
Pack
e
ts
Speed m/s- node 50
Received Packets
GM
MHN
RPGM
RWP
MM Node 100- Received Packets
SPEE D
0 2 4 6 8 10
GM 5789 5736 5657 5642 4590 5511
MHN 5798 5657 3512 4905 2431 1716
RPG
M 5790 5287 5603 5471 3539 3101
RWP 5787 5477 5690 4487 5433 5463
0 5000 10000
0 2 4 6 8 10
N
o
o
f p
ac
ke
ts
Speed m/s node 100
Received Packets
GM
MHN
RPGM
[image:5.595.300.554.177.501.2] [image:5.595.42.298.347.676.2]31
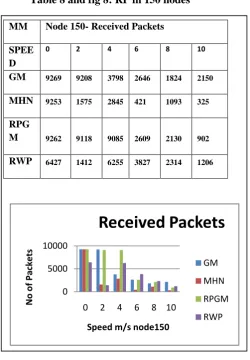
Table 8 and fig 8: RP in 150 nodes
Fig 8: RP in 150 nodes
[image:6.595.320.558.99.329.2]Table 8: Received Packets (RP) in the 150 nodes using different Mobility model with different Speed (maximum speed = 10 m/s). In Table 8 and fig 8 represents the Received Packets in accordance with Speed. By using 150 nodes, the performance of Gauss-Markov model and RPGM gives better RP results. At 0,2 Speed, Gauss-Markov Model is giving packets are Received to Destination successfully and at Speed 4, RPGM model receive 9085 packets Received and at 6 Speed Gauss-Markov model receive 2646 packets successfully and at Speed 8, RWP model receive 2314 packets and at Speed 10,Gauss-Markov Model receive 2150 packets successfully and also it differs with other models. In overall node 150, the performance of Manhattan model is very fewer packets are received among the other models.
Table 9: RP in 200 nodes
Fig 9: RP in 200 nodes
Table 9: Received Packets (RP) in the 200 nodes using different Mobility model with different Speed (maximum speed = 10 m/s). In Table 9 and fig 9 represents the Received Packets in accordance with Speed. By using 200 nodes, the performance of Gauss-Markov model and RPGM gives better RP results. At 0, 2,6,10 Speed, RWP Model is giving 11572, 1802, 465 1438 packets respectively and at Speed 4, 8 Manhattan model receive 742,377 packets respectively Received and also it differs with other models. In overall node 200, the performance of Gauss-markov model is very fewer packets are received among the other models.
Table 10: Received Packets (RP) in the 250 nodes using different Mobility model with different Speed (maximum
speed = 10 m/s).
Table10: RP in 250 nodes
0 500 1000 1500 2000 2500 3000 3500 4000 4500 5000 5500 6000 6500 7000 7500 8000 8500 9000 9500 10000 10500 11000 11500 12000 12500
0 2 4 6 8 10
N
o
o
f Pack
e
ts
Speed m/s node200
Received Packets
GM
MHN
RPGM
RWP
MM Node 150- Received Packets
SPEE D
0 2 4 6 8 10
GM 9269 9208 3798 2646 1824 2150
MHN 9253 1575 2845 421 1093 325
RPG
M 9262 9118 9085 2609 2130 902
RWP 6427 1412 6255 3827 2314 1206
0 5000 10000
0 2 4 6 8 10
N
o
o
f Pack
e
ts
Speed m/s node150
Received Packets
GM
MHN
RPGM
RWP
MM Node 200- Received Packets
SPEED
0
2
4
6
8
10
GM 2763 320 241 122 299 136
MHN 5273 1292 742 221 377 590
RPGM 1316 848 421 180 89 30
RWP 11572 1802 425 465 344 1438
MM Node 250- Received Packets
SPEED
0
2
4
6
8
10
GM 856 377 303 408 129 81
MHN 903 1479 194 352 219 99
RPGM 2149 308 30 367 51 75
RWP 483 423 900 20 428 21
0 2000 4000
0 2 4 6 8 10
N
o
o
f Pack
e
ts
Speed m/s node 250
Received Packets
GM
MHN
RPGM
[image:6.595.57.279.611.773.2]32 In Table 10 and fig 10 represents the Received Packets in
accordance with Speed. By using 250 nodes, the performance of Manhattan model and RPGM gives better RP results. At 2, 10 Speed, Manhattan Model is giving 1479, 99 packets respectively and at Speed 0, through RPGM model 2149 packets Received successfully and at Speed 4, 8, through RWP model 900,428 packets receive successfully and also it differs with other models. In overall node 250, the performance of RWP model is very fewer packets are received among the other models.
Overview of Received Packets (RP): This Received Packets estimate gives us an idea about how successful the Received packets by using of the DSR protocol and Different Mobility models. Among different mobility models Manhattan model and RWP models received packets is good with generated Packets which we selected the models from group and random models. When the network is small then the Received packets is 95% and above. When the network is high (i.e. Nodes high) the performance of Received Packets is low.
7.
CONCLUSION AND FUTURE WORK
In this paper
,
main aim is to prove that the analyzing behavior of different mobility models over DSR Routing protocol gives more different behavioral. The mobility model extremely affects the performance results of a Routing protocol in realistic environment. The behavior of the mobility models with DSR protocol have been compared and observed the high variance in results.We have used NS2 simulation tool for analyzing with Control overhead, Generated Packets and Received Packets. Our findings show that this model fails to provide that existing Mobility models give high variance in Result. The Mobility models which we taken for analysis has same generated packets when the number of mobile nodes and Speed varies. The overall performance of Control Overhead (CO) the models Manhattan model and RPGM models exchanging the packets overall performance is good among the other models which we selected the models from group and random models. The overall performance of Received Packets (RP) is that the models when the network is small then the Received packets is 95% and above. When the network is high (i.e. Nodes high) the performance of Received Packets is low. We are going to compare Obstacle Mobility Model with same nodes and Speed as future; by finding the defects and behaviors based on this a new method using graph-theory based model is found for best mobility results.
8.
ACKNOWLEDGEMENT
I thank Karpagam University for the motivation and Encouragement to make this Research work as a successful one.
REFERENCES
[1] Ariyakhajorn, Jinthana Wannawilai, Pattana Sathitwiriyawong, Chanboon “A Comparative Study of Random Waypoint and Gauss-Markov Mobility Models in the Performance Evaluation of MANET” 2 April 2007 [2] B. Divecha, A. Abraham, C. Grosan and S. Sanyal, “Impact of Node Mobility on MANET Routing Protocols Models,” Journal of Digital Information Management, Vol. 4, No. 1, pp. 19 – 23, February 2007.
[3] B. Liang and Z. Haas, “Predictive Distance-based Mobility Management for PCS Networks,” Proceedings of the IEEE International Conference on Computer Communications, Vol. 3, pp. 1377-1384, March 1999. [4] C. Bettstetter, H. Hartenstein and X. Perez-Costa,
“Stochastic Properties of the Random-Way Point Mobility Model,” Wireless Networks, pp. 555 –567, Vol. 10, No. 5, September 2004.
[5] C. E. Perkins and E. M. Royer, “Ad hoc On- Demand Distance Vector Routing,” Proceedings of the 2nd IEEE Workshop on Mobile Computing Systems and Applications, pp. 90-100, February1999.
[6] C. E. Perkins and P. Bhagwat, “Highly Dynamic Destination Sequenced Distance Vector Routing for Mobile Computers,” ACM SIGCOMM, pp. 234 –244, October 1994.
[7] C-K. Toh, “Associatively-based Routing for Ad hoc-Mobile Networks,” IEEE personal Communications, Vol. 4, No. 2, pp. 103-109, 1997.
[8] D. B. Johnson, D. A. Maltz, and J. Broch, “DSR: The Dynamic Source Routing Protocol for Multi-hop Wireless Ad hoc Networks,” Ad hoc-Networking, edited by Charles E. Perkins, Chapter 5, pp. 139-172, Addison-Wesley, 2001.
[9] D. Maltz, “The Dynamic Source Routing Protocol for Multi-Hop Ad Hoc Networks,” Nov 5, 1999.
[10] http://chandra-s2.blogspot.in/2009/01/how-to-run-bonnmotion-for-ns-2.html.
[11] https://net.cs.unibonn.de/fileadmin/ag/martini/projekte/B onnMotion/src/BonnMotion_Docu.pdf.
[12] F. Bai, N. Sadagopan and A. Helmy, “IMPORTANT: A Framework to Systematically Analyze the Impact of Mobility on Performance of Routing Protocols for Ad hoc Networks,” Proceedings of the IEEE International Conference on Computer Communications, pp. 825-835,March-April, 2003.
[13] Kapang Lego et. al. “Comparative Study of Ad-hoc Routing Protocol AODV, DSR and DSDV in Mobile Adhoc NETwork” Indian Journal of Computer Science and Engineering Vol. 1 No. 4 2010PP.no 364-371 [14] M. I. M. Saad and Z. A. Zukarnain, “Performance
Analysis of Random-based Mobility Models in MANET Routing Protocol,” European Journal of Scientific Research, Vol. 32, No. 4, pp. 444-454,2009.
[15] N. Meghanathan and A. Farago, “On the Stability of Paths, Steiner Trees and Connected Dominating Sets in Mobile Ad Hoc Networks,” Elsevier Ad HocNetworks, Vol. 6, No. 5, pp. 744 – 769, July 2008.
[16] Vasanthi.V, Ajith Singh. N, Romen Kumar. M and M.Hemalatha 2011 “A Detailed study of Mobility model in sensor network” Int., Journal of Theoretical and Applied Information Technology (JATIT), and ISSN: 1992-8645, Scopus, and I.F-1.71 15th Nov2011 vol 33(1) pg.no.7-14.
[17] Teerawat issariyakul, Ekram Hossain,”Introduction to Network Simulator NS-2,2nd Edition 2011.
AUTHOR PROFILE
V.Vasanthi completed M.Sc (C.S), M. Phil; in Computer Science. She is Ph.D scholar in Karpagam University under the guidance of Dr.M.Hemalatha. Area of Research is Advanced Network - Ad-Hoc Wireless sensor network, MANET. She Published Six Papers in international Journals and two international Conferences and one national Conference.