Munich Personal RePEc Archive
Pensions at a glance: public policies
across OECD countries
Queisser, Monika and Whitehouse, Edward
OECD, DELSA
May 2005
Online at
https://mpra.ub.uni-muenchen.de/10907/
ORGANISATION FOR ECONOMIC CO-OPERATION AND DEVELOPMENT
Pensions at a Glance
ORGANISATION FOR ECONOMIC CO-OPERATION
AND DEVELOPMENT
The OECD is a unique forum where the governments of 30 democracies work together to address the economic, social and environmental challenges of globalisation. The OECD is also at the forefront of efforts to understand and to help governments respond to new developments and concerns, such as corporate governance, the information economy and the challenges of an ageing population. The Organisation provides a setting where governments can compare policy experiences, seek answers to common problems, identify good practice and work to co-ordinate domestic and international policies.
The OECD member countries are: Australia, Austria, Belgium, Canada, the Czech Republic, Denmark, Finland, France, Germany, Greece, Hungary, Iceland, Ireland, Italy, Japan, Korea, Luxembourg, Mexico, the Netherlands, New Zealand, Norway, Poland, Portugal, the Slovak Republic, Spain, Sweden, Switzerland, Turkey, the United Kingdom and the United States. The Commission of the European Communities takes part in the work of the OECD.
OECD Publishing disseminates widely the results of the Organisation’s statistics gathering and research on economic, social and environmental issues, as well as the conventions, guidelines and standards agreed by its members.
Also available in French under the title:
Les pensions dans les pays de l’OCDE
PANORAMA DES POLITIQUES PUBLIQUES
© OECD 2005
No reproduction, copy, transmission or translation of this publication may be made without written permission. Applications should be sent to This work is published on the responsibility of the Secretary-General of the OECD. The
FOREWORD
Foreword
T
his report provides indicators for comparing pension policies across OECD countries. It looks at the main features of pension systems, such as contribution rates to defined-contribution schemes, accrual rates in earnings-related schemes, ceilings to pensionable earnings and indexation of pensions in payment.Based on the parameters and rules of 2002 (but including legislated changes that are phased in over time), future pension entitlements are calculated for workers starting their careers today.
Pension entitlements are shown on both a gross and a net basis taking into account taxes and social security contributions paid by workers and pensioners. The results cover all mandatory parts of the retirement-income system, including resource-tested benefits, basic pensions, as well as public and compulsory private pension schemes.
Comprehensive policy indicators are also developed of the cost of countries’ pension promises, the potential resource transfer to pensioners and the structure of the pension package.
Country Studies (Part II) provide a summary of each country’s pension system and include detailed country-specific results.
This report was prepared by Monika Queisser of the Social Policy Division of the Directorate for Employment, Labour and Social Affairs, and Edward Whitehouse, a consultant to the OECD and director of Axia Economics, London. Gordon Keenay assisted with the analysis of the tax position of pensioners. David Stanton provided guidance in the early stages of the project. National officials provided invaluable active assistance in collecting information on their countries’ pension and tax systems.
Delegates to the OECD Working Party on Social Policy advised on modelling procedures and development of indicators for cross-country comparison of pension systems. They also gave constructive comments on earlier drafts of the report.
TABLE OF CONTENTS
Table of Contents
Preface: Why Pensions at a Glance? . . . 9
Introduction . . . 11
Executive Summary. . . 15
Part I
Monitoring Pension Policies
Chapter 1. Pension-system Typology. . . 211. First-tier, redistributive pensions . . . 22
2. Second-tier, mandatory, insurance pensions . . . 24
Notes . . . 25
Chapter 2. Comparing Pension-system Parameters . . . 27
1. First-tier, redistributive schemes . . . 28
2. Second-tier, earnings-related schemes . . . 28
3. Earnings measures and valorisation in earnings-related schemes . . . 31
4. Defined-contribution schemes . . . 33
5. Ceilings on pensionable earnings . . . 33
6. Pension eligibility ages . . . 34
7. Indexation of pensions in payment . . . 34
8. Taxes and social security contributions. . . 34
Notes . . . 37
Chapter 3. Modelling Pension Entitlements . . . 39
1. Future entitlements under today’s parameters and rules. . . 40
2. Coverage . . . 40
3. Economic variables . . . 41
4. Average earnings data. . . 42
5. Taxes and social security contributions. . . 42
6. Indicators and results . . . 42
Notes . . . 45
Chapter 4. Replacement Rates . . . 47
1. Gross replacement rates . . . 48
2. Net replacement rates . . . 51
TABLE OF CONTENTS
Chapter 5. Relative Pension Levels . . . 55
Chapter 6. Pension Wealth. . . 59
Notes . . . 63
Chapter 7. Key Indicators . . . 65
1. Weighted averages and the earnings distribution . . . 66
2. Weighted average pension levels and pension wealth . . . 67
3. Structure of the potential resource transfer to pensioners . . . 68
Notes . . . 70
Annex I.1. Differences between Defined-benefit, Points and Notional-accounts Pension Systems . . . 71
Annex I.2. Sensitivity Analyses . . . 73
Annex I.3. Progressivity of Pension Benefit Formulae. . . 81
Bibliography . . . 84
Part II
Country Studies
Introduction . . . 89Australia . . . 91
Austria . . . 95
Belgium . . . 98
Canada. . . 102
Czech Republic . . . 105
Denmark . . . 108
Finland. . . 112
France . . . 116
Germany . . . 120
Greece . . . 123
Hungary . . . 127
Iceland . . . 130
Ireland . . . 133
Italy . . . 136
Japan . . . 140
Korea . . . 143
Luxembourg . . . 146
Mexico . . . 149
Netherlands . . . 152
New Zealand . . . 155
Norway . . . 158
Poland . . . 161
Portugal . . . 164
Slovak Republic. . . 167
Spain . . . 170
TABLE OF CONTENTS
Switzerland . . . 177
Turkey . . . 180
United Kingdom . . . 183
United States . . . 187
VOLUNTARY, OCCUPATIONAL PENSIONS . . . 191
Canada. . . 193
Denmark . . . 196
United Kingdom . . . 198
United States . . . 200
List of Box 3.1. Modelling pensions . . . 44
List of Tables 1.1. Structure of pension systems in OECD countries . . . 23
2.1. Summary of pension system parameters . . . 29
2.2. Earnings measure and valorisation: earnings-related schemes . . . 32
2.3. Procedures for adjustment of pensions in payment by country and scheme . . . . 35
2.4. Categories of concession available to pensioners . . . 37
3.1. Earnings of the average production worker, 2002 . . . 43
4.1. Gross replacement rates by earnings level, mandatory pension programmes, men. . . 49
4.2. Net replacement rates by earnings level, mandatory pension programmes, men. . . 52
6.1. Total life expectancy at age 65, 2040 projected mortality rates . . . 61
6.2. Gross pension wealth by earnings level, mandatory pension programmes, men. . . 63
7.1. Weighted average pension level and pension wealth . . . 67
7.2. Contribution of different components of pension systems to total pension promise . . . 69
I.3.1. Indicators of the progressivity of pension benefit formulae . . . 82
List of Figures 4.1. Gross replacement rates at different earnings levels . . . 50
4.2. Net replacement rates at different earnings levels . . . 51
5.1. The link between pre-retirement earnings and pension entitlements . . . 57
7.1. Distribution of earnings, average of 16 OECD countries . . . 66
I.2.1. Total gross replacement rates for low, average and high earners by rate of return on defined-contribution pensions. . . 74
I.2.2. Total gross replacement rates for low, average and high earners by rate of growth of economy-wide average earnings . . . 77
PREFACE: WHY PENSIONS AT A GLANCE?
Preface: Why Pensions at a Glance?
R
eforming pensions is one of the biggest challenges of the century. All OECD countries have to adjust to the ageing of their populations and re-balance retirement income provision to keep it adequate and ensure that the retirement income system is financiallysustainable. Demographers have been warning us for some time that ageing is looming and that when it strikes populations and workforces will rapidly age. But many governments preferred to ignore the call for reform and cling to the hope of postponing solutions beyond the next election or claiming that rather painless remedies could be found. Immigration of younger workers, more women in work and higher productivity were put forward in the hope that more painful solutions could be avoided. All of these factors can certainly help to cope with ageing and especially with the financing of pensions but the increases necessary to compensate for ageing are so large that one cannot rely on them alone.
Most OECD countries have realised this and have undertaken numerous reforms during past years. But pension reform is a difficult task. It involves long-term policy decisions under uncertain conditions and often the likely impact of these decisions on the well-being of pensioners is not spelt out clearly. More than most other areas, pension reform is a highly sensitive topic. Not only does it lead to heated ideological debates, but it makes people protest in the streets, and even forces governments to retreat from needed reforms.
As people working on pension reforms around the world, we at the OECD Secretariat are asked time and again for the “right” solution to the problem. Which country does it the best way, which country is doing the worst job, which systems are the most generous, will it be possible to reform without increasing pensioner poverty, and will countries be able to pay for the promises they are making?
There are no simple answers to these questions. National retirement-income systems are complex and pension benefits depend on a wide range of factors. Differences in retirement ages, benefit calculation methods and adjustment of paid-out pensions make it very difficult to compare pension policies across countries. Another problem is that life expectancies at retirement differ from one country to another, which means that some countries will have to pay pensions for a much longer period of retirement than others. As a result national debates are often full of misleading claims regarding the generosity and affordability of other countries’ pension arrangements.
PREFACE: WHY PENSIONS AT A GLANCE?
This report presents the first direct comparison of pension promises across OECD countries. It provides a novel framework to assess the future impact of today’s pension policies, including their economic and social objectives. It takes account of the detailed rules of pension systems but summarises them in measures that are easy to compare. Pension benefits are projected for workers at different levels of earnings, covering all mandatory sources of retirement income for private-sector workers, including minimum pensions, basic and means-tested schemes, earnings-related programmes and defined contribution schemes. Another novelty is the inclusion of the large effects of the personal income tax and social security contributions on living standards in work and in retirement: all indicators are presented gross and net of taxes and contributions.
The framework can be used in different ways. As it is flexible to changing assumptions, the impact of policy reforms and economic developments on pension entitlements can be simulated. It can provide answers to questions such as what would happen if a country switched from wage to price indexation of pensions, or changed the benefit accrual rate. It can also inform on the impact of changes in economic growth, interest rates, wage growth or inflation on pensions of future retirees. The OECD will use the framework to monitor pension reforms in member countries by updating this report regularly. This report is the first in a biennial series which will be produced in co-operation with the European Commission.
Public opinion on pensions is changing. People are realising that a shrinking number of young workers will have trouble paying for more and more pensioners. Time has come to open a frank debate among all members of society and address the question of how the cost of ageing should be distributed in each society. Our publication aims to contribute to this debate by shedding more light on the social and economic implications of pension reform.
John Martin
INTRODUCTION
Introduction
N
ational retirement-income systems are complex and diverse. As a result, comparing them across countries is difficult.Cross-country analysis of pension systems has typically taken three forms:
● An institutional approach consisting of: descriptions of schemes’ structures, rules and parameters. One example is the biennial reports, published as Social Security Programmes throughout the World by the United States Social Security Administration and the International Social Security Association. Another is the Mutual Information System on Social Security (Missoc) produced by the European Commission.
● An income-distribution analysis: using household survey data to assess the incomes of older people relative to the population as a whole. An example is the OECD’s latest income-distribution analysis, published as Förster and Mira d’Ercole (2005). Disney and Whitehouse (2001, 2003) provide a survey of cross-country studies of older people’s economic well being.
● A financial and fiscal analysis: projecting pension expenditures into the future (typically public expenditures alone). The OECD has regularly produced such projections for its member countries, the latest published as Dang et al. (2001).
Each of these traditional methods of cross-country analysis of pension systems has its disadvantages.
The first – institutional analysis – is an essential part of making international comparisons, but is very difficult to use as the basis for policy comparisons given the level of detail involved.
The second – income-distribution analysis – is backward-looking. The economic well-being of today’s older people depends on the rules of the pension system in the past. These have been in constant flux. Monitoring and analysing pension policy needs to focus on the rules of today’s systems. Their effects – on contributors and beneficiaries, and on the economy as a whole – will be felt for decades to come.
INTRODUCTION
This report adopts a fourth approach: microeconomic projections of pension benefits for workers at different levels of earnings. As such, its aim is to provide the means to assess the broad impact of pension policies, including both their economic and social objectives.
This approach has many advantages:*
● Like the institutional approach, it takes account of the detailed rules of pension systems
but summarises them in measures that are easy to compare across countries.
● It is forward looking, assessing the future implications of today’s pension policies. It does
not confuse the situation of current retirees and those approaching retirement with the long-run stance of the pension system.
● It is “decomposable”. Its primary aim is to assess the parameters and rules of the
pension system without the “noise” of other influences. The effects of countries’ demographic profile, macroeconomic aggregates, earnings distribution, etc. can be isolated both from one another and from pension policy choices.
Furthermore, this microeconomic technique, which has been applied to all 30 OECD member countries, is:
● comprehensive and adaptable, since it covers all mandatory sources of retirement
income for private-sector workers, including minimum pensions, basic and means-tested schemes, earnings-related programmes and defined-contribution schemes;
● novel, since it includes new indicators of the average generosity of pension schemes, of
the scale and structure of the potential resource transfer to older people and of the progressivity of pension benefit formulae;
● broad, covering the full earnings range from low- to high-income workers;
● flexible to assumptions, such as economic variables (inflation, interest rates, real
earnings growth) or parameters (e.g., what would happen if a country switched from wage to price indexation of pensions, or changed the accrual rate, etc.); and
● inclusive, since it also allows for the large effects of the personal income tax and social
security contributions on living standards in work and in retirement (which is often ignored, especially in cross-country analyses).
The structure of this report is as follows. The first chapter gives a typology of pension systems. The intention here is not to classify countries; rather it is to give an indication of which countries have which features in their mandatory pension systems.
In Chapter 2, this framework is filled out with cross-country comparisons of the parameters and rules of all types of pension schemes. There is also information on the treatment of pensioners and pension incomes under the personal income tax and social security contributions.
The third chapter outlines the methodology and the assumptions that have to be made to generate comparative information on pension entitlements. (The sensitivity of the results to assumptions is examined in Annex I.2.)
INTRODUCTION
The remaining chapters contain comparative information on pension benefits. Chapters 4 and 5 present the main results on pension entitlements across countries. Chapters 6 and 7 extend the analysis to provide more comprehensive indicators that are of most use in monitoring pension policies.
ISBN 92-64-01871-9 Pensions at a Glance
Public Policies across OECD Countries © OECD 2005
EXECUTIVE SUMMARY
R
ecent years have seen a wave of pension reforms across OECD countries. These changes were motivated primarily by concerns about the financial sustainability of pension systems in the context of ageing populations. An in-depth look at pension systems reveals complex structures and rules, which make it difficult to compare retirement-income regimes. Nevertheless, sharing experience of pension reform and its impact provides valuable information for policy makers.The report shows how large a pension people who start work now can expect to receive when they retire. This analysis answers a number of policy questions. Do retirement-income systems protect against poverty? Are they financially sustainable? How do they treat people who have low incomes or time out of employment? The report is the first in a series that will appear every two years. Future editions will also assess the impact of pension reforms.
This report shows the direction in which pension systems are heading. The cross-country comparisons reveal a diversity of pension provision in OECD countries. The analysis presented in this report covers all mandatory pension schemes – not only public pension systems, but also all compulsory private pensions. It also examines safety-nets for the elderly, and it takes account of differences in taxes, both across countries and between workers and pensioners. As such, this report provides a complete picture of the transfers across and within generations, and thus of the social adequacy of pension systems. Pension programmes have two main objectives. The first is redistribution of income towards low-income pensioners and prevention of destitution in old age. The second is helping workers maintain living standards during retirement by replacing income from work at an adequate level. Most countries pursue both goals in their overall pension policy, but there is large variation in the balance of emphasis between the two each objectives.
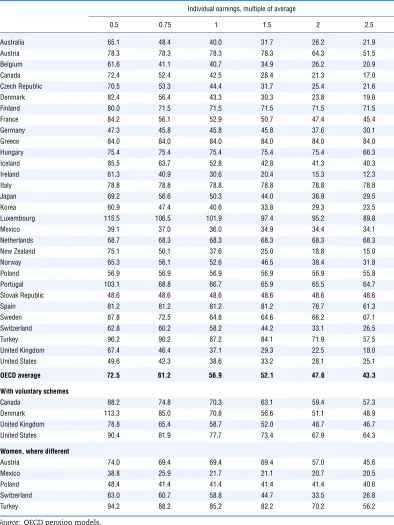
This report shows that workers on average earnings in OECD countries can expect their post-tax pension to be worth just under 70% of their earnings after tax. The countries with the lowest net replacement rate are Ireland and New Zealand, which have just basic pension schemes and net replacement rates of less than 40%. The United Kingdom and the United States have slightly higher net replacement rates of around 50%.
Low-income workers in OECD countries on half of average earnings will receive a net replacement rate on average of about 85%. But pensions for poor workers are very low in some countries. In Germany, Mexico, the Slovak Republic and the United States, safety-net pensions for full-career workers are worth less than a quarter of economy-wide average earnings.
Some countries have aimed to link contributions and benefits more closely. In Italy, Poland and Hungary, for example, the redistributive features of pension systems have been all but eliminated. If the pension system does not redistribute to poorer people, then means-tested safety-net provisions will generally play a more prominent role in retirement incomes.
EXECUTIVE SUMMARY
This report reveals that the personal tax system plays an important role in old-age support. Pensioners often do not pay social security contributions and, as personal income taxes are progressive, the average tax rate on pension income is typically less than the tax rate on earned income. In addition, most income tax systems give preferential treatment either to pension incomes or to pensioners, by giving additional allowances or credits to older people.
Net replacement rates at average earnings are 22% larger than gross replacement rates (averaging across the OECD). However, the effect of taxes and contributions on low earners is more muted than on average because the former pay less in taxes and contribution than higher-income workers. The differential between gross and net replacement rates for low earners is 17% on average.
Most countries withdraw tax concessions from richer pensioners. However, Germany and the United States are two exceptions. They provide tax concessions across the income range (although this is changing in Germany).
The adjustment of pensions in payment to reflect changes in costs or standards of living – “indexation” – has long been central to the debate on the financial sustainability of pension systems. Nearly all OECD countries now link pensions to consumer prices. However, some still adjust pensions in line with average earnings, which may cost more than 20% more than if pensions were indexed to prices.
A related feature is “valorisation”: the adjustment of past earnings to account for changes in living standards between the time when pension rights are earned and when they are claimed. Until very recently, valorisation has received much less attention than indexation despite its powerful impact on pension benefits.
Most OECD countries revalue past earnings in line with economy-wide earnings growth. But there are several exceptions – Belgium, France, Korea, and Spain – where past earnings are valorised with prices. Wages usually grow faster than prices, so price valorisation leads to substantially lower replacement rates than earnings valorisation. Price valorisation for a full-career could result in a pension 40% lower than under earnings valorisation.
Pension wealth – the present value of the future stream of pension payments – is the most comprehensive indicator of pension promises. It takes into account the level at which pensions are paid, the age at which people become eligible to receive a pension, people’s life expectancy and how pensions are adjusted after retirement to reflect growth in wages or prices. Luxembourg has the highest pension wealth for a worker who earned average earnings, worth 18 times average earnings for men and nearly 22 times for women (due to higher female life expectancy). This is equivalent to USD 587 000 at the time of retirement, nearly treble the average for OECD countries. The lowest pension wealth for someone who has earned average earnings when working is found in Ireland, Mexico, New Zealand, the United Kingdom and the United States, where it is less than six times average earnings.
EXECUTIVE SUMMARY
PART I
Monitoring Pension Policies
ISBN 92-64-01871-9 Pensions at a Glance
Public Policies across OECD Countries © OECD 2005
PART I
Chapter 1
I.1. PENSION-SYSTEM TYPOLOGY
T
here have been numerous typologies of retirement-income systems. The terminology used in these categorisations has become very confusing. Perhaps the most commonly-used typology is the World Bank’s “three-pillar” classification (World Bank, 1994), between “a publicly managed system with mandatory participation and the limited goal of reducing poverty among the old [first pillar]; a privately managed mandatory savings system [second pillar]; and voluntary savings [third pillar]”. But this is a prescriptive rather than a descriptive typology. Subsequent analysts have allocated all public pension programmes to the first pillar. This has included earnings-related public schemes, which certainly do not meet the original definition of the first pillar. The most recent addition is the concept of a “zero pillar”, comprising non-contributory schemes aimed at alleviating poverty among older people. But this is rather closer to the original description of a first pillar.The OECD has developed a taxonomy that avoids the concept of pillars altogether. It aims, instead, for a global classification for pension plans, pension funds and pension entities that is descriptive and consistent over a range of countries with different retirement-income systems (OECD, 2004).
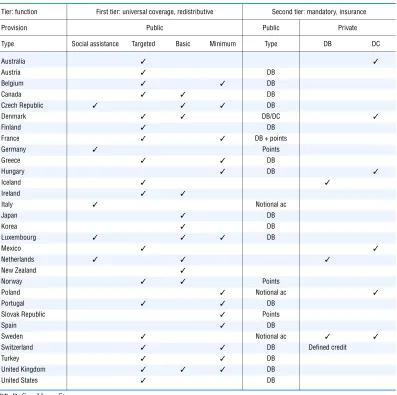
The approach adopted here follows this line. It is based on the role and objective of each part of the pension system. The framework has two mandatory tiers: a redistributive part and an insurance part. Redistributive components of pension systems are designed to ensure that pensioners achieve some absolute, minimum standard of living. Insurance components are designed to achieve some target standard of living in retirement compared with that when working. Voluntary provision, be it individual or employer-provided, makes up a third tier. Within these tiers, schemes are classified further by their form (public or private, defined benefit or defined contribution). This typology therefore clearly separates form from function, and description from prescription. Table 1.1 summarises the systems of the 30 OECD member countries divided into the redistributive first tier and the insurance second tier.
1. First-tier, redistributive pensions
All OECD countries have safety-nets in place that aim to prevent poverty of the elderly. These schemes, called “first-tier, redistributive schemes” here, can be of four different types: social assistance, separate targeted retirement-income programmes, basic pension schemes and minimum pensions within earnings-related plans. All of these are provided by the public sector and are mandatory.
In basic pension schemes, the benefit is either flat-rate, i.e., the same amount is paid to every retiree, or it depends only on years of work (but not on past earnings). Additional income from other sources does not change the entitlement to the basic pension. Eleven countries have a basic pension scheme.1
I.1. PENSION-SYSTEM TYPOLOGY
retiree receives), broader-income tested (reducing payments if, for example, a retiree has income from savings) or broader means-tested (reducing the pension to take account of both income and assets). There are 18 OECD countries with this type of pension programme.2
[image:20.539.72.469.80.475.2]Minimum pensions are similar to targeted plans since they also aim to prevent pensions from falling below a certain level. But the institutional set-up and the eligibility conditions are different. Minimum pensions, as they are defined here, are part of the rules of the second-tier, earnings-related pension provision. Usually, retirees must have paid contributions for a minimum number of years in order to receive this benefit. Minimum credits in earnings-related schemes, such as those in Belgium and the United Kingdom,
Table 1.1. Structure of pension systems in OECD countries
DB: Defined benefit. DC: Defined contribution.
Notes on first-tier schemes: Social assistance refers to general programmes that also cover older people. Targeted covers specific schemes for older people that are resource-tested. Basic schemes are either universal, flat-rate programmes or pay a flat amount per year of coverage. Minimum pensions are redistributive parts of earnings-related schemes. Notes on second-tier schemes: Includes quasi-mandatory schemes with broad coverage. France has two programmes: the public scheme and mandatory occupational plans. Denmark’s scheme is a hybrid of DB and DC.
Source:Based on information provided by national authorities.
Tier: function First tier: universal coverage, redistributive Second tier: mandatory, insurance
Provision Public Public Private
Type Social assistance Targeted Basic Minimum Type DB DC
Australia ✓ ✓
Austria ✓ DB
Belgium ✓ ✓ DB
Canada ✓ ✓ DB
Czech Republic ✓ ✓ ✓ DB
Denmark ✓ ✓ DB/DC ✓
Finland ✓ DB
France ✓ ✓ DB + points
Germany ✓ Points
Greece ✓ ✓ DB
Hungary ✓ DB ✓
Iceland ✓ ✓
Ireland ✓ ✓
Italy ✓ Notional ac
Japan ✓ DB
Korea ✓ DB
Luxembourg ✓ ✓ ✓ DB
Mexico ✓ ✓
Netherlands ✓ ✓ ✓
New Zealand ✓
Norway ✓ ✓ Points
Poland ✓ Notional ac ✓
Portugal ✓ ✓ DB
Slovak Republic ✓ Points
Spain ✓ DB
Sweden ✓ Notional ac ✓ ✓
Switzerland ✓ ✓ DB Defined credit
Turkey ✓ ✓ DB
United Kingdom ✓ ✓ ✓ DB
I.1. PENSION-SYSTEM TYPOLOGY
have a similar effect: benefits for workers with very low earnings are calculated as if the worker had earned at a higher level.
Finally, five countries do not have specific, targeted programmes for older people. In these cases, poor older people are entitled to the same general social-assistance benefits that are available to the whole population.
Half of OECD countries rely on one primary instrument to prevent old-age poverty, but the rest have a combination of two or three schemes.
2. Second-tier, mandatory, insurance pensions
The second tier in this typology of pension schemes plays an “insurance” role. It aims to ensure that retired people have an adequate replacement rate (retirement income relative to earnings before retirement) and not just a poverty-preventing absolute standard of living. Like the first tier, it is mandatory. Only Ireland and New Zealand do not have some form of mandatory, second-tier provision.
Some 17 countries have public, defined-benefit (DB) plans, making them by far the most common form of pension-insurance provision in OECD countries. In DB schemes, the amount a pensioner will receive depends on the number of years of contributions made throughout the working life and on some measure of individual earnings from work.
The next most common form of pension-insurance provision is the defined-contribution (DC) plan. In these schemes, each worker has an individual account in which contributions are saved and invested, and the accumulated capital is usually converted into a pension-income stream at retirement; lump-sum withdrawals are rarely permitted. Typically, the capital has to be used to buy an annuity, i.e., a guaranteed pension payment until death, which meets certain conditions (such as indexation of benefits and provision of survivors’ benefits).
There are different ways in which DC schemes are organised. In Australia, employers must cover their workers through an industry-wide fund or a financial-service company. In Hungary, Mexico and Poland, DC plans are strictly individual: workers choose a pension provider without employer involvement. In Sweden, workers pay only a small contribution into the mandatory individual accounts. They have a wide range of choices of how to invest their savings. A public agency acts as a clearing house and intermediary between workers and investment managers. There is additional DC provision for most workers in Sweden under the quasi-mandatory occupational plans. In Denmark, investments under the national retirement-savings plan are managed centrally, but with choice of portfolio from 2005.
Finally, some countries have earnings-related schemes that do not follow the “traditional” DB model. First, there are points systems: the French occupational plans and the German, Norwegian and Slovak public schemes. Workers earn pension points based on their individual earnings for each year of contributions. At retirement, the sum of pension points is multiplied by a pension-point value to convert them into a regular pension payment.
I.1. PENSION-SYSTEM TYPOLOGY
Mandatory contributions to Swiss occupational plans look at first like a DC scheme, since individuals and their employers must pay a contribution rate that varies with age. But the government sets the minimum rate of return that the scheme must pay and a mandatory annuity rate at which the accumulation is converted into a low of pension payments. This means that the system has strong elements of a DB plan.
Notes
1. Note that Korea is included here because the earnings-related pension scheme has a flat component which pays a percentage of economy-wide average earnings for each year of contributions.
ISBN 92-64-01871-9 Pensions at a Glance
Public Policies across OECD Countries © OECD 2005
PART I
Chapter 2
I.2. COMPARING PENSION-SYSTEM PARAMETERS
T
he main features of OECD member countries’ pension systems are summarised in Table 2.1. This follows the typology of the previous chapter (Table 1.1), dividing the pension system into two tiers. The summary necessarily leaves out much of the institutional details. More complete descriptions are provided in the country studies.1. First-tier, redistributive schemes
The level of benefits under first-tier, redistributive schemes is expressed as a percentage of average earnings in each country. (Section 4 in Chapter 3 shows the average earnings data and describes their sources.)
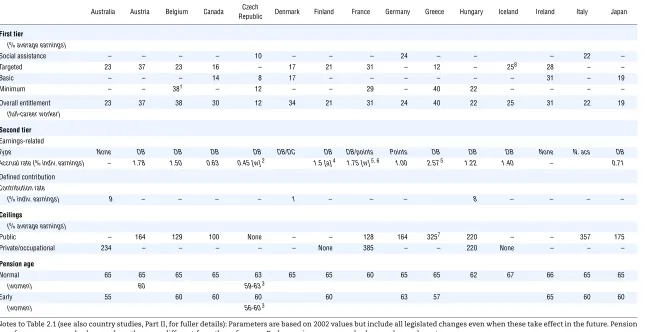
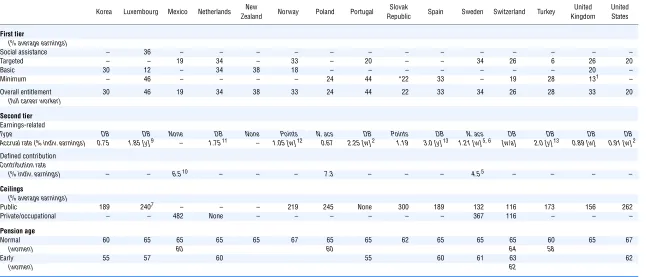
In the cases of minimum pensions and basic schemes, the benefit entitlement is shown for a worker who enters at age 20 and works without interruption until he reaches the standard pension eligibility age. In most OECD countries, this is age 65. The social-assistance level is shown only when there is no specific, targeted scheme for poor pensioners. (Only full-career workers with very low earnings will be eligible for the targeted and social-assistance programmes; the majority of beneficiaries will be those with short and interrupted contribution histories.) The final row shows the total, first-tier benefit to which a full-career worker would be entitled. This is relevant because, in some cases, workers can receive several different types of first-tier benefits at the same time, while in others, people are only eligible for one of the different programmes.
The average minimum retirement benefit across OECD countries is a little under 29% of average earnings. The minimum pension in the Czech Republic is exceptionally low at just 12% of average earnings. The basic pension in Japan, minimum pension in Mexico and the targeted scheme in the United States are also on the low side, providing benefits worth one fifth or less of average earnings. At the other end of the spectrum, Luxembourg and Portugal have minimum pensions worth well above 40% of average earnings. Greece’s minimum pensions, the targeted plan in Austria and the minimum pension credits in Belgium are also high compared to other OECD countries.
2. Second-tier, earnings-related schemes
The information on the second, earnings-related insurance tier begins with the type of earnings-related scheme that is provided: defined benefit, points or notional accounts. The main parameter which accounts for differences in the value of these schemes is the accrual rate per year of contribution, that is, the rate at which a worker earns benefit entitlements for each year of coverage. The accrual rate is expressed as a percentage of the earnings that are “covered” by the pension scheme. Most pension schemes cover only part of workers’ earnings to calculate pension benefits. Often, contributions to the scheme are charged only on part of the earnings. The rationale behind such ceilings is the view that higher-income workers can save individually if they want to reach a high replacement rate.
I.2. COMPARIN G P E N S IO N-SYSTEM P A P E N S IO N S AT A G L AN CE – I S BN 9 2 -64-01 871 -9
– © OE
C
D
20
[image:25.765.60.710.54.386.2]05
Table 2.1. Summary of pension system parameters
Notes to Table 2.1 (see also country studies, Part II, for fuller details): Parameters are based on 2002 values but include all legislated changes even when these take effect in the future. Pension ages for women are only shown where these are different from those for men. Early pension ages are only shown where relevant.
DB: Defined benefit. DC: Defined contribution. N. acs: Notional accounts. – Not relevant.
[w] = Varies with earnings. [y] = Varies with years of service. [a] = Varies with age.
Australia Austria Belgium Canada Czech
Republic Denmark Finland France Germany Greece Hungary Iceland Ireland Italy Japan
First tier
(% average earnings)
Social assistance – – – – 10 – – – 24 – – – 22 –
Targeted 23 37 23 16 – 17 21 31 – 12 – 258 28 – –
Basic – – – 14 8 17 – – – – – – 31 – 19
Minimum – – 381 – 12 – – 29 – 40 22 – – – –
Overall entitlement 23 37 38 30 12 34 21 31 24 40 22 25 31 22 19
(full-career worker)
Second tier
Earnings-related
Type None DB DB DB DB DB/DC DB DB/points Points DB DB DB None N. acs DB Accrual rate (% indiv. earnings) – 1.78 1.50 0.63 0.45 [w]2 1.5 [a]4 1.75 [w]5, 6 1.00 2.575 1.22 1.40 – 0.71
Defined contribution
Contribution rate
(% indiv. earnings) 9 – – – – 1 – – – 8 – – – –
Ceilings
(% average earnings)
Public – 164 129 100 None – – 128 164 3257 220 – – 357 175
Private/occupational 234 – – – – – None 385 – – 220 None – – –
Pension age
Normal 65 65 65 65 63 65 65 60 65 65 62 67 66 65 65
(women) 60 59-633
Early 55 60 60 60 60 63 57 65 60 60
I.2. COMPARIN G P E N S IO N-SYSTEM P A R A METERS PE NSI O NS AT A GL ANC E – ISB N 92 -6 4-0 1 8 7 1 -9 – © O E CD 2 0 30
Table 2.1. Summary of pension system parameters (cont.)
1. Belgium, United Kingdom: minimum benefit calculated from minimum credit.
2. Czech Republic, Portugal, United States: higher accrual rates for lower earnings, lower accrual rates for higher earnings. 3. Czech Republic: pension ages for women vary with the number of children.
4. Finland: higher accrual rates at older ages.
5. France, Greece, Sweden: data shown combines two different programmes (public and occupational plans). 6. France, Sweden: higher accrual rates for higher earnings.
7. Greece: effective ceiling calculated from maximum pension.
8. Iceland: includes three different programmes (basic pension and two supplements). 9. Luxembourg: accrual rate is higher for longer contribution periods.
10. Mexico: additional contribution of 5.5% of minimum wage. 11. Netherlands: accrual rate varies between occupational schemes. 12. Norway: lower accrual rate for higher earnings.
13. Spain, Turkey: higher accrual rate for early years of service and lower for later years. Source: Based on information provided by national authorities.
Korea Luxembourg Mexico Netherlands New
Zealand Norway Poland Portugal
Slovak
Republic Spain Sweden Switzerland Turkey
United Kingdom
United States
First tier
(% average earnings)
Social assistance – 36 – – – – – – – – – – – – –
Targeted – – 19 34 – 33 – 20 – – 34 26 6 26 20
Basic 30 12 – 34 38 18 – – – – – – – 20 –
Minimum – 46 – – – – 24 44 *22 33 – 19 28 131 –
Overall entitlement 30 46 19 34 38 33 24 44 22 33 34 26 28 33 20
(full career worker)
Second tier
Earnings-related
Type DB DB None DB None Points N. acs DB Points DB N. acs DB DB DB DB Accrual rate (% indiv. earnings) 0.75 1.85 [y]9 – 1.7511 – 1.05 [w]12 0.67 2.25 [w]2 1.19 3.0 [y]13 1.21 [w]5, 6 [w/a] 2.0 [y]13 0.89 [w] 0.91 [w]2
Defined contribution
Contribution rate
(% indiv. earnings) – – 6.510 – – – 7.3 – – – 4.55 – – – –
Ceilings
(% average earnings)
Public 189 2407 – – – 219 245 None 300 189 132 116 173 156 262
Private/occupational – – 482 None – – – – – – 367 116 – – –
Pension age
Normal 60 65 65 65 65 67 65 65 62 65 65 65 60 65 67
(women) 60 60 64 58
Early 55 57 60 55 60 61 63 62
I.2. COMPARING PENSION-SYSTEM PARAMETERS
defined-benefit variety for which accrual rates can be calculated in a straightforward way. For the alternative types of earnings-related scheme – points systems and notional accounts – it is also possible to calculate an “effective” accrual rate.
For points systems, such as the German public plan, French occupational schemes and the new Slovak public pension, the effective accrual rate shown in Table 2.1 is the ratio of the cost of a pension point to the pension-point value, expressed as percentage of individual earnings. This, like the accrual rate in DB schemes, gives the benefit earned each year as a proportion of earnings in that year. The details of this calculation are set out in Annex I.1.
In the notional-accounts schemes, the effective accrual rate is calculated in a similar way. Again, this ratio gives the annual pension entitlement as a proportion of earnings in a given year. The calculation is again described in detail in Annex I.1.
In a little under half of the countries with earnings-related plans (of all three types), the accrual rates are linear: that is, a single percentage rate applies across the range of covered earnings and to each and every year of coverage. In the other countries, the pension benefit earned for each year of coverage varies, either with individual earnings, with the number of years of contributions or with individual age. Table 2.1 shows a “typical” accrual rate in these cases; the details are provided in the country studies (Part II).
In seven cases, the accrual rate varies with earnings (indicated in Table 2.1 by [w]). In the public schemes of the Czech Republic, Switzerland, Portugal and the United States, the pattern is progressive, giving higher replacement rates to lower-income workers. In the United Kingdom, the accrual rates are U-shaped, highest for low earners, then smaller, then higher again. In the occupational plans of France and Sweden, the schemes are designed to offset the redistribution in the public scheme; they pay a higher replacement rate to high earners on their pay above the ceiling of the public plan.
In the occupational plans of Finland and Switzerland, pension accrual increases with age (shown as [a]).
Three countries have accrual rates that vary with length of service ([y]). In Luxembourg, the accrual rate increases for people with a longer contribution history. In Spain and Turkey, there are three accrual rates. The pattern is the reverse of that in Luxembourg: the highest accrual rate is for the first few years of coverage and the lowest for later years in longer contribution histories.
3. Earnings measures and valorisation in earnings-related schemes
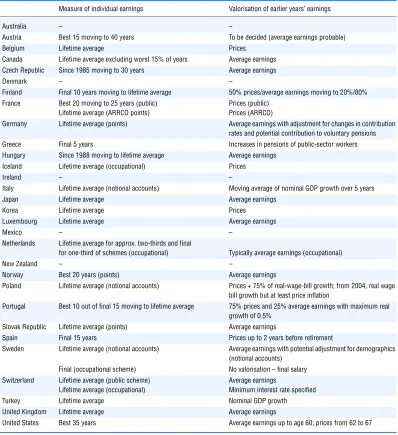
There are two important mechanisms in earnings-related schemes that greatly influence the level of benefits that pensioners will eventually receive. The first is the measure of individual earnings used in the benefit formula. Entitlements in these schemes are calculated in relation to the past earnings of the individual worker but the way in which these are measured differs among countries. The measure might be, for example, a period of final earnings, the lifetime average or a number of best years of earnings. When individual earnings increase over a worker’s career, as is often the case, using only final or a few last years of earnings will result in a higher benefit than when taking into account early years of the career when earnings were much lower.
I.2. COMPARING PENSION-SYSTEM PARAMETERS
they are claimed. In final-salary schemes there is obviously no need for valorisation but it is common in schemes where benefits are based on earnings over a longer period. Both rules are summarised in Table 2.2. Again, more detail is provided in the country studies.
[image:28.539.71.469.83.518.2]Of the 25 countries with earnings-related schemes, 20 use lifetime average (or close to lifetime average) pay as the earnings measure for calculating pension benefits. This means that all (or nearly all) years of previous earnings count in determining the pension entitlement. The exceptions are the public schemes of France, Greece, Portugal and Spain, the Norwegian points-based scheme and Swedish occupational pensions. Earnings are averaged over shorter periods in these cases. Some countries are currently phasing in longer averaging periods for earnings in their benefit calculation (Austria, Finland, Hungary and Portugal).
Table 2.2. Earnings measure and valorisation: earnings-related schemes
– Country does not have an earnings-related scheme. Source:Based on information provided by national authorities.
Measure of individual earnings Valorisation of earlier years’ earnings
Australia – –
Austria Best 15 moving to 40 years To be decided (average earnings probable)
Belgium Lifetime average Prices
Canada Lifetime average excluding worst 15% of years Average earnings Czech Republic Since 1985 moving to 30 years Average earnings
Denmark – –
Finland Final 10 years moving to lifetime average 50% prices/average earnings moving to 20%/80% France Best 20 moving to 25 years (public)
Lifetime average (ARRCO points)
Prices (public) Prices (ARRCO)
Germany Lifetime average (points) Average earnings with adjustment for changes in contribution rates and potential contribution to voluntary pensions
Greece Final 5 years Increases in pensions of public-sector workers Hungary Since 1988 moving to lifetime average Average earnings
Iceland Lifetime average (occupational) Prices
Ireland – –
Italy Lifetime average (notional accounts) Moving average of nominal GDP growth over 5 years
Japan Lifetime average Average earnings
Korea Lifetime average Prices
Luxembourg Lifetime average Average earnings
Mexico – –
Netherlands Lifetime average for approx. two-thirds and final
for one-third of schemes (occupational) Typically average earnings (occupational)
New Zealand – –
Norway Best 20 years (points) Average earnings
Poland Lifetime average (notional accounts) Prices + 75% of real-wage-bill growth; from 2004, real wage bill growth but at least price inflation
Portugal Best 10 out of final 15 moving to lifetime average 75% prices and 25% average earnings with maximum real growth of 0.5%
Slovak Republic Lifetime average (points) Average earnings
Spain Final 15 years Prices up to 2 years before retirement
Sweden Lifetime average (notional accounts) Average earnings with potential adjustment for demographics (notional accounts)
Final (occupational scheme) No valorisation – final salary
Switzerland Lifetime average (public scheme) Lifetime average (occupational)
Average earnings
Minimum interest rate specified
Turkey Lifetime average Nominal GDP growth
United Kingdom Lifetime average Average earnings
I.2. COMPARING PENSION-SYSTEM PARAMETERS
Table 2.2 shows valorisation rules – and the equivalent policies for notional accounts and points systems – in the final column.1 In 14 cases, past earnings are valorised in line with growth of earnings (or close, as in the United States). In Italy and Turkey, adjustments are linked to a measure of GDP growth. Valorisation is purely with prices in Belgium, France (both the public scheme and occupational plans) and Spain. Finland, Poland and Portugal valorise with a mix of earnings and prices.
The effect of valorisation policy on pension entitlements can be very large. This is due to a “compound-interest” effect. On the baseline economic assumptions used in this report – i.e., real wage growth of 2% and price inflation of 2.5% – prices valorisation for a full-career (between age 20 and 65) results in a pension that would be 40% lower than a policy of full adjustment of earlier years’ pay in line with economy-wide average earnings.
4. Defined-contribution schemes
Among OECD countries, Australia has the largest mandatory defined contribution scheme: employers must pay 9% of their employees’ earnings into their pension accounts. In Mexico, the contribution is 6.5% of earnings with the government paying 5.5% of the minimum wage into all accounts. For an average earner, the total contribution comes to 7.1% of earnings, similar to Poland’s contribution rate (7.3%). Hungary has slightly higher contributions (8% of earnings). In Denmark and Sweden, the mandatory contribution rates are much lower. The savings scheme in Denmark requires contributions of just 1% of earnings, but DC occupational plans (which cover the vast majority of employees) have contribution rates that vary between 9 and 17%. In Sweden, where there are two DC programmes, the mandatory scheme requires contributions of 2.5% of earnings and the occupational plan, 2%.
5. Ceilings on pensionable earnings
Most countries do not require high-income workers to contribute to the pension system on their entire earnings. Usually, a limit is set on the earnings used both to calculate contribution liability and pension benefits. This ceiling on the earnings covered by the pension system has an important effect on the structure, size and cost of the second-tier systems. High ceilings or the absence of a ceiling means that high-income workers receive a high replacement rate and there is little need for take-up of voluntary private pensions.
The average ceiling on public pensions for 19 countries is 183% of average economy-wide earnings.2 In addition to those countries with no ceiling, the ceiling on pensionable pay is very high relative to average pay in Italy. By contrast, at roughly the level of average economy-wide earnings, the Canadian ceiling is exceptionally low. Belgium, France and Sweden also have relatively low ceilings, of the order of 125-135% of average earnings. In these countries, around 15-20% of workers earn above the ceiling of the public scheme.
defined-I.2. COMPARING PENSION-SYSTEM PARAMETERS
It is possible to calculate an overall ceiling on mandatory pensions, including mandatory private and occupational schemes where appropriate. This averages 225% of average earnings across 21 countries, which is rather higher than the 183% average ceiling on public schemes alone.
6. Pension eligibility ages
Table 2.1 shows that the majority of OECD member countries have a standard retirement age of 65 for men. Pension eligibility ages for women are still lower in several countries but, in most of these, they will be equalised gradually with those of men (Belgium, Hungary and the United Kingdom). Iceland, Norway and the United States stand out as having a standard pension age of 67. At the other extreme, France and Turkey are the only countries which allow normal retirement at age 60. Two-thirds of OECD member countries also have special provisions for early retirement.3
7. Indexation of pensions in payment
Indexation refers to the policy for the up-rating of pensions in payment from the point of claim of the pension benefit onwards. Typically, pension benefits are adjusted in line with an index of consumer prices, although in some cases the adjustments also take account of changes in average earnings.
Few countries had formal indexation rules when pension schemes were established. But the high-inflation era of the 1970s led most governments to adopt automatic procedures.4 There are still a few cases of discretionary adjustments, particularly for social-assistance type benefits or those linked to minimum wages.
However, most indexation is fully to prices. Many countries moved from earnings indexation to prices during the 1980s and 1990s as a cost-cutting measure (given that wages have grown faster than prices in nearly all countries). With price indexation, the purchasing power of pensions is preserved. But the standard of living of individual retirees over time falls behind that of workers.
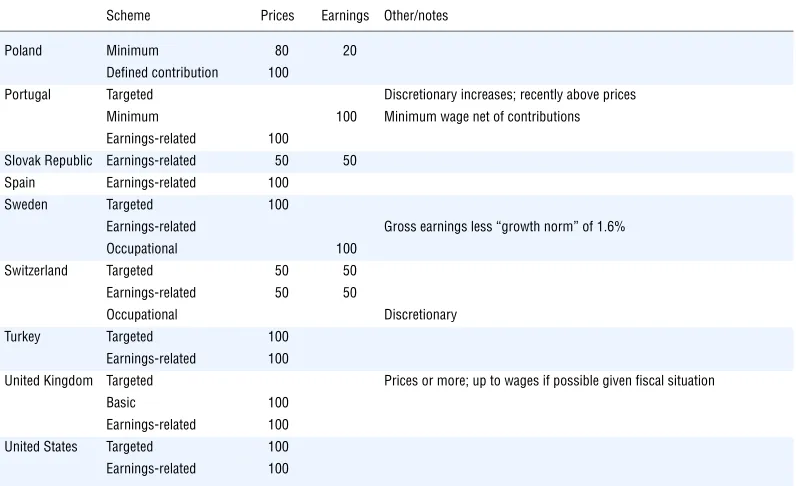
Some countries, such as Finland, Hungary, Poland and the Slovak Republic have adopted indexation to a mix of price and wage inflation, as pioneered by Switzerland. Table 2.3 gives an overview of procedures for adjusting pensions in payment by both country and pension programme.
8. Taxes and social security contributions
I.2. COMPARING PENSION-SYSTEM PARAMETERS
Table 2.3. Procedures for adjustment of pensions in payment by country and scheme
Percentage of total adjustment linked to prices or earnings
Scheme Prices Earnings Other/notes
Australia Targeted 100
Defined contribution Individual choice
Austria Earnings-related Discretionary; prices assumed in modelling
Belgium Social assistance 100
Price index excludes alcohol, cigarettes and fuel; increases only if inflation exceeds 2%
Minimum pension 100 Earnings-related 100
Canada Targeted 100
Basic 100
Earnings-related 100
Czech Republic Basic 67 33
Adjustment to prices plus increases of at least one third of real wage growth
Earnings-related 67 33
Minimum 100
Denmark Targeted 100
Basic 100
ATP Discretionary
Defined contribution Periodic bonuses
Finland Basic 100
Earnings-related 80 20
France Targeted 100
Minimum 100
Earnings-related 100
Occupational 100 No automatic procedure but recent practice
Germany Social assistance Discretionary
Earnings-related 100 Wages net of pension contributions
Greece Minimum 100
Targeted Discretionary
Earnings-related Discretionary
Hungary Minimum 50 50
Earnings-related 50 50
Defined contribution 50 50
Iceland Targeted 100 In line with public-sector pay Occupational 100 Minimum legal uprating
Ireland Targeted 100
Basic pension 100
Italy Social assistance Discretionary
Earnings-related 75-100 Increase between full and 75% price indexation depending on pension level
Japan Basic 100
Earnings-related 100
Korea Earnings-related 100
Luxembourg Social assistance Discretionary
Basic 100 At least prices with extra increase related to earnings growth
Minimum 100
Earnings-related 100
Mexico Minimum 100 Equal to real value of minimum wage for 1997
Defined contribution 100 Individual can also choose gradual withdrawal
Netherlands Basic 100 Net minimum wage
Occupational 100 No legal requirement but customary
New Zealand Basic 100
Norway Targeted 100
Basic 100
I.2. COMPARING PENSION-SYSTEM PARAMETERS
The relevant features of personal income taxes and social security contributions are divided into three categories:
● Age-based tax allowances and tax credits, which exceed those available to taxpayers of
working age. In many cases, the concessions are targeted on those with modest incomes and are withdrawn as income increases.
● Reliefs for some or all of pension income received. Several countries exempt fully or partially
pensions paid from public sources from the personal income tax. And, in some cases, there is a preferential tax treatment for modest pensions paid from private-sector schemes.
● Social security contributions are typically levied only on wage income6 and not on pension benefits. However, some countries charge contributions on pension income for health and long-term care insurance or for survivors’ insurance.
[image:32.539.71.469.106.349.2]Table 2.4 gives an overview of the three categories of concessions in the 30 OECD countries. Although the table reports concessions to income streams from private pensions, it excludes, for example, reliefs granted to lump-sum withdrawals from personal or occupational pension plans. Furthermore, other aspects of the tax treatment of private pensions (such as the treatment of contributions and investment returns at the fund level) are not considered in this table.
Table 2.3. Procedures for adjustment of pensions in payment by country and scheme (cont.)
Percentage of total adjustment linked to prices or earnings
Source:Based on information provided by national authorities. Scheme Prices Earnings Other/notes
Poland Minimum 80 20
Defined contribution 100
Portugal Targeted Discretionary increases; recently above prices
Minimum 100 Minimum wage net of contributions
Earnings-related 100
Slovak Republic Earnings-related 50 50
Spain Earnings-related 100
Sweden Targeted 100
Earnings-related Gross earnings less “growth norm” of 1.6%
Occupational 100
Switzerland Targeted 50 50
Earnings-related 50 50
Occupational Discretionary
Turkey Targeted 100
Earnings-related 100
United Kingdom Targeted Prices or more; up to wages if possible given fiscal situation
Basic 100
Earnings-related 100
I.2. COMPARING PENSION-SYSTEM PARAMETERS
Notes
1. Adjustments related to valorisation exist also in the different variants of earnings-related schemes. In notional accounts, the exact corollary to valorisation is the notional interest rate applied, which again adjusts benefits between the time they were earned and that time that they are drawn. Similarly, procedures for uprating the value of a pension point in points systems have the same effect. (The detailed reasoning is shown in Annex I.1.)
2. This excludes the eight countries where there is no public pension scheme for which a ceiling is relevant (such as basic or targeted programmes) and the three countries that have no ceiling on earnings eligible for a public pension.
3. Preliminary work on the value of pension benefits at different retirement ages has been published in Casey et al. (2003) and OECD (2001).
4. See Weaver (1988). In practice, benefit increases have often strayed from that set out in the rules: see Vordring and Goudswaard (1997).
5. See Whiteford (1995) for a discussion of these issues.
[image:33.539.69.469.82.444.2]6. There are some social contributions with a broader base than earnings, such as the CSG (contribution sociale généralisée) in France.
Table 2.4. Categories of concession available to pensioners
Source:Based on information provided by national authorities. Increased tax allowances
or tax credit
Relief or partial relief for pension income
Social security contributions paid by pensioners
Australia ✓ –
Austria Low
Belgium ✓ Low
Canada ✓ ✓ None
Czech Republic ✓ None
Denmark ✓ None
Finland ✓ Low
France ✓ Low
Germany ✓ Low
Greece None
Hungary ✓ None
Iceland None
Ireland ✓ None
Italy ✓ ✓ None
Japan ✓ Low
Korea ✓ ✓ None
Luxembourg ✓ Low
Mexico ✓ None
Netherlands ✓ Low
New Zealand –
Norway ✓ ✓ Low
Poland Low
Portugal None
Slovak Republic None
Spain None
Sweden None
Switzerland None
Turkey ✓ None
United Kingdom ✓ None
ISBN 92-64-01871-9 Pensions at a Glance
Public Policies across OECD Countries © OECD 2005
PART I
PART I
Chapter 3
I.3. MODELLING PENSION ENTITLEMENTS
T
his report adopts a “microeconomic” approach to comparing retirement-income systems, looking at prospective individual entitlements under all 30 of OECD member countries’ pension regimes. These microeconomic techniques were first developed for the retirement-income reviews of nine OECD countries (OECD, 2001).This chapter outlines the details of the structure, coverage and basic economic and financial assumptions underlying the calculation of future pension entitlements on a comparative basis. It also sets out the main indicators used to compare pensions; these are shown for the 30 OECD countries in Part II.
1. Future entitlements under today’s parameters and rules
The pension entitlements that are compared are those that are currently legislated. All pension system parameters reflect the situation in the year 2002.1 Changes in rules that have already been legislated, but are being phased-in gradually, are assumed to be fully in place from the start.2 It is assumed that the pension rules remain unchanged.3, 4
The calculations show the pension entitlements of a worker who enters the system today and retires after a full career. This is defined here as entering at age 20 and working until the standard pension-eligibility age, which, of course, varies between countries. The implication is that the length of career varies with the statutory retirement age: 40 years for retirement at 60, 45 years for retirement at 65.
The reason for modelling only full careers is that periods out of the labour market are covered in many countries pension systems, with credits for periods in higher education, military service, unemployment, child rearing, etc. Simply assuming that people who are not in work are not covered by the pension system during career gaps would produce inaccurate figures for pension entitlements.
The results are shown for a single person only. This is because the rules governing benefits for married couples are complex in many countries, and because the results depend on assumptions over both partners’ career histories.
2. Coverage
The pension models presented here include all mandatory pension schemes for private-sector workers, regardless of whether they are public (i.e. they involve payments from government or from social security institutions, as defined in the System of National Accounts) or private.5 Systems with near-universal coverage are also included, provided they cover at least 90% of employees. For example, such a degree of coverage of occupational plans is achieved through centralised collective bargaining in the Netherlands and in Sweden.
I.3. MODELLING PENSION ENTITLEMENTS
included in the main results. But the results including these schemes are shown as memorandum items in the tables presented in the cross-country analysis below, and the details of the calculations are set out in the country studies.
Mandatory personal pensions, known as “individual accounts” in some countries, are also included. These are of the defined contribution type, so the pension benefit depends on contributions made and investment returns earned. The countries that have recently introduced these schemes have made them mandatory for new labour-market entrants; the majority of older workers are covered only by the old, public scheme in some of these countries.
Resource-tested benefits for which retired people may be eligible are also included. As described above, these can be means-tested, where both assets and income are taken into account, purely income-tested or withdrawn only against pension income. Leaving these benefits out of the model would give a misleading picture of the situation of low-income retirees. The comparisons assume all entitled pensioners take up these benefits.6 Where there are broader means tests, taking account also of assets, the income test is taken as binding. It is assumed that the whole of income during retirement comes from the mandatory pension scheme when calculating pensions entitlements (or from the voluntary pension in the four countries where these are modelled).
In some OECD countries there are entirely separate schemes for civil servants and other public-sector workers.7 Some also have special programmes for agricultural workers and the self-employed. These are not included here. The comparisons currently look only at the main national scheme for private-sector employees.
Pension entitlements are compared for workers with earnings between 0.3 times and three times the economy-wide average. This large range permits the pensions of both the poorest and richer workers to be examined, and it is sufficiently broad to include people who are employed part-time.
3. Economic variables
The comparisons are based upon a single set of economic assumptions for all 30 countries. In practice, the level of pensions received is affected by economic growth, wage growth and inflation, and these will vary across countries. A single set of assumptions, however, ensures that the outcomes of the different pension regimes are not affected by different economic conditions. In this way, differences across countries in pension levels reflect differences in pension systems and policies alone.
The baseline assumptions are:
● real earnings growth: 2% per year (given the assumption for price inflation, this implies
nominal wage growth of 4.55%);
● individual earnings: assumed to grow in line with the economy-wide average. This
means that, in the baseline case, the individual is assumed to remain at the same point in the earnings distribution, earning the same percentage of average earnings in every year of the working life;
● price inflation: 2.5% per year;
● real rate of return on funded, defined-contribution pensions: 3.5% per year;
I.3. MODELLING PENSION ENTITLEMENTS
● mortality rates: the baseline modelling uses country-specific projections (made in 2002)
from the United Nations/World Bank population database for the year 2040;
● earnings distribution: composite indicators use the OECD average earnings distribution
(based on 16 countries) with country-specific data used where available.
Changes in these baseline assumptions will obviously affect the resulting pension entitlements. A sensitivity analysis of the effect of these assumptions is presented in Annex I.2. This analysis allows, for example, for economy-wide earnings growth of between zero and 3% per year, for returns on defined-contribution schemes of between zero and 6% per year and for individual earnings that grow faster than the economy-wide average by up to two percentage points per year or slower by up to one percentage point per year.
The real rate of return on defined-contribution pensions is assumed to be net of administrative charges. In practice, this assumption might disguise genuine differences in administrative fees between countries.8
The calculations assume the following for the pay-out of pension benefits: when DC benefits are received upon retirement, they are paid in the form of a price-indexed life annuity at an actuarially-fair price.9 This is calculated from mortality data. Because of improvements in life expectancy, someone retiring at a given age after having contributed a given amount to a DC scheme will in the future receive a lower pension than a person retiring today would receive. Similarly, the notional annuity rate in notional accounts schemes is calculated from mortality data using the indexation rules and discounting assumptions employed by the respective country.
4. Average earnings data
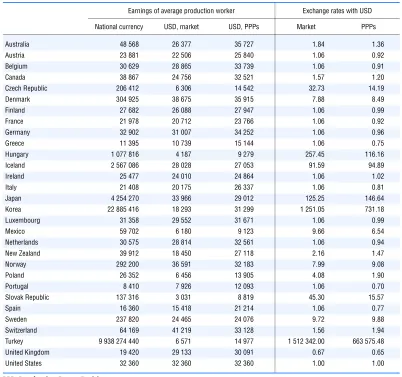
It is difficult to produce data on average earnings that are consistent across countries. Consequently, the OECD’s average production worker series is currently the only one available for all 30 member countries. The series shows average earnings for full-time adult workers in manufacturing.10 The data for 2002 are shown in Table 3.1. For comparison across countries, earnings are also shown in US dollars. The conversions are calculated using the average market exchange rate for 2002 and the exchange rate calculated using purchasing power parities (that is, the exchange rate that equalises the cost of a standard basket of goods and services between countries).
5. Taxes and social security contributions
The information on taxes and social security contributions on which the calculations of the net indicators are based can be found in each country study (Part II). The studies describe the tax and social security contribution regimes in each country as they applied to pensioners in 2002.11 General provisions and the tax treatment of workers for 2002 can be found in the OECD report Taxing Wages (2003). The conventions used in that report, such as which payments are considered taxes, are followed here.
6. Indicators and results
The basic indicators used in this report are:
● the replacement rate: pension entitlements as a share of individual lifetime average earnings; ● the relative pension level: pension entitlements as a share of average economy-wide