Clemson University
TigerPrints
All Dissertations
Dissertations
12-2018
Cyber Physical System Security — DoS Attacks on
Synchrophasor Networks in the Smart Grid
Xingsi Zhong
Clemson University, [email protected]
Follow this and additional works at:
https://tigerprints.clemson.edu/all_dissertations
This Dissertation is brought to you for free and open access by the Dissertations at TigerPrints. It has been accepted for inclusion in All Dissertations by an authorized administrator of TigerPrints. For more information, please [email protected].
Recommended Citation
Zhong, Xingsi, "Cyber Physical System Security — DoS Attacks on Synchrophasor Networks in the Smart Grid" (2018).All Dissertations. 2289.
Cyber
Physical
System
Security
—
DoS
Attacks
on
Synchrophasor
Networks
in
the
Smart
Grid
A Dissertation Presented to the Graduate School of
Clemson University
In Partial Fulfillment
of the Requirements for the Degree Doctor of Philosophy Computer Engineering by Xingsi Zhong December 2018 Accepted by:
Dr. Ganesh Kumar Venayagamoorthy, Committee Chai Dr. Richard R. Brooks, Committee Co-Chair
Dr. Rajendra Singh Dr. James J. Martin
Abstract
With the rapid increase of network-enabled sensors, switches, and relays, cyber-physical system security in the smart grid has become important. The smart grid operation demands reliable communication. Existing encryption technologies ensures the authenticity of delivered messages. However, commonly applied technologies are not able to prevent the delay or drop of smart grid communication messages.
In this dissertation, the author focuses on the network security vulnerabilities in synchropha-sor network and their mitigation methods. Side-channel vulnerabilities of the synchrophasynchropha-sor network are identified. Synchrophasor network is one of the most important technologies in the smart grid transmission system. Experiments presented in this dissertation shows that a DoS attack that ex-ploits the side-channel vulnerability against the synchrophasor network can lead to the power system in stability.
Side-channel analysis extracts information by observing implementation artifacts without knowing the actual meaning of the information. Synchrophasor network consist of Phasor Measure-ment Units (PMUs) use synchrophasor protocol to transmit measureMeasure-ment data. Two side-channels are discovered in the synchrophasor protocol. Side-channel analysis based Denial of Service (DoS) attacks differentiate the source of multiple PMU data streams within an encrypted tunnel and only drop selected PMU data streams. Simulations on a power system shows that, without any counter-measure, a power system can be subverted after an attack. Then, mitigation methods from both the network and power grid perspectives are carried out.
Form the perspective of network security study, side-channel analysis, and protocol trans-formation has the potential to assist the PMU communication to evade attacks lead with protocol identifications.
Computational Network (CCN) prediction of PMU data is studied and used to implement a Virtual Synchrophasor Network (VSN), which learns and mimics the behaviors of an objective power grid. The data from VSN is used by the Automatic Generation Controllers (AGCs) when the PMU packets are disrupted by DoS attacks. Real-time experimental results show the CCN based VSN effectively inferred the missing data and mitigated the negative impacts of DoS attacks.
In this study, industry-standard hardware PMUs and Real-Time Digital Power System Simulator (RTDS) are used to build experimental environments that are as close to actual production as possible for this research.
The above-mentioned attack and mitigation methods are also tested on the Internet. Man-In-The-Middle (MITM) attack of PMU traffic is performed with Border Gateway Protocol (BGP) hijacking. A side-channel analysis based MITM attack detection method is also investigated. A game theory analysis is performed to give a broader view of this problem.
Acknowledgments
I would like to thank my advisor, Dr. G. Kumar Venayagamoorthy, and co-advisor Dr. Richard R. Brooks for their unconditional support to carry out the research and write the dis-sertation. This work might not have been accomplished without their abundant knowledge, and professional experiences. I would also like to thank them for their patience and dedication of time. Additionally, I would like to thank Dr. Rajendra Singh, and Dr. James J Martin for serving as my advisory committee. Lastly, thanks to my parents for their understanding and decades of support.
This work is supported in part by the US National Science Foundation (NSF) under grants 1312260, 1308192, 1232070, NSF Cyber-Physical Systems (CPS) grant 1544910, U.S. Dept. of State award number S-LMAQM-12-GR-1033, and the Duke Energy Distinguished Professor Endowment Fund. Any opinions, findings and conclusions or recommendations expressed in this material are those of the author(s) and do not necessarily reflect the views of the financial supports.
Table of Contents
Title Page . . . i
Abstract . . . ii
Acknowledgments . . . iv
List of Tables . . . vii
List of Figures . . . viii
1 Introduction . . . 1
1.1 Overview . . . 1
1.2 Cyber Physical Systems Security of Smart Grid . . . 2
1.3 Objectives . . . 11
1.4 Contributions to Date . . . 11
1.5 Organization of this Dissertation . . . 12
1.6 Publications . . . 12
1.7 Summary . . . 14
2 Background . . . 15
2.1 Overview . . . 15
2.2 The Synchrophasor Protocol . . . 15
2.3 Security Gateways . . . 16
2.4 Side-Channel Analysis . . . 18
2.5 Man-In-The-Middle Attack . . . 20
2.6 Summary . . . 21
3 Side-Channel analysis of PMU Traffic . . . 22
3.1 Overview . . . 22
3.2 PMU Packet Size Side-Channel Analysis . . . 23
3.3 Inter-Packet Timing Delay Side-Channel Analysis . . . 28
3.4 Results . . . 32 3.5 Summary . . . 34 4 Traffic Camouflage . . . 37 4.1 Overview . . . 37 4.2 Related Work . . . 38 4.3 Background . . . 39 4.4 Traffic Camouflage . . . 41 4.5 Experiment . . . 44
4.6 Summary . . . 47
5 Denial of Service Attack on Phasor Measurement Unit . . . 49
5.1 Overview . . . 49
5.2 Two Area Four Machine Power System with Utility-Scale PV Plant and PMUs . . . 50
5.3 AGC Operation Under Attack . . . 55
5.4 Consequences of DoS Attacks . . . 56
5.5 Summary . . . 57
6 Virtual Synchrophasor Network . . . 58
6.1 Overview . . . 58
6.2 Cellular Computational Network . . . 58
6.3 AGC Operation Under Attack . . . 60
6.4 Experiment and Results Analysis . . . 63
6.5 Summary . . . 65
7 VSN Resiliency . . . 66
7.1 Overview . . . 66
7.2 Virtual Synchrophasor Network . . . 66
7.3 System Resiliency with VSN . . . 68
7.4 Results and Analysis . . . 70
7.5 Summary . . . 77
8 Border Gateway Protocol Hijacking Detection . . . 79
8.1 Overview . . . 79
8.2 Border Gateway Protocol in Smart Grid . . . 80
8.3 Border Gateway Protocol Hijacking . . . 80
8.4 Packet Timing Side-Channel Analysis . . . 82
8.5 Results . . . 87
8.6 Summary . . . 92
9 Game Theory Analysis . . . 93
9.1 Overview . . . 93
9.2 Two-Person Zero-Sum (TPZS) game . . . 94
9.3 Results and Analysis . . . 96
9.4 Summary . . . 97
10 Conclusions . . . 98
10.1 Overview . . . 98
10.2 Chapter Summaries . . . 98
10.3 Future Research Directions . . . 100
10.4 Summary . . . 100
Appendices . . . 101
A Consequences and Mitigation of DoS Attack on Single PMU with VSN . . . 102
B PhasorToolBox – A Python Package for Synchrophasor Application Prototyping . . 112
C Game Theory Analysis Payoff Matrices . . . 129
List of Tables
1.1 Documented Security Vulnerabilities . . . 3
3.1 Map of Synchrophasor Data Frame Sizes to PMU Model Numbers . . . 26
3.2 Map of PMU configuration packet size to PMU Model Numbers . . . 26
3.3 Map of Packet Sizes to PMU Model Numbers . . . 27
3.4 Accuracy Rate Using Inter-Packet Timing Delay Side-Channel with Window Size of 11 33 3.5 Accuracy Rate Using Inter-Packet Timing Delay Side-Channel with Window Size of 9 33 3.6 Accuracy Rate Using Inter-Packet Timing Delay Side-Channel with Window Size of 7 34 3.7 Accuracy Rate Using Packet Size Side-Channel . . . 34
4.1 PMU packet fields in application layer . . . 42
4.2 TPR-FPR with different thresholds . . . 47
7.1 Simulated DoS patterns for the second training stage. . . 68
7.2 Ten Operating Conditions. . . 70
1 Generator Rated values and power outputs . . . 102
2 AGC Parameters . . . 102
3 The Change of Energy In One Minutes Window After A Fault . . . 110
4 The Change of Energy In One Minutes Window After A Fault . . . 111
5 The latency test results . . . 126
6 Use Zero for AGC . . . 129
7 Use Sixty for AGC . . . 130
8 Use The Last Available Data for AGC . . . 130
9 Use SCADA for AGC . . . 131
10 Use VSN for AGC . . . 131
11 Drop All PMUs . . . 132
List of Figures
1.1 An Example Synchrophasor Network . . . 3
2.1 Example of frame transmission order. This figure is from IEEE Standard C37.118.2 [52] 16 2.2 Mapping of IEEE C37.118 data into a TCP or UDP packet A transport layer header and trailer are shown, as it would be when using Ethernet. This figure is from IEEE Standard C37.118.2 [52] . . . 16
2.3 Observed sequence diagram of Synchrophasor protocol in application layer . . . 17
2.4 The PMU measurement packet encryption. . . 18
2.5 An example of a DoS attack in a VPN tunnel: (a) A VPN network carries Ping traffic and data streams from two PMUs to control center; (b) During a DoS attack, a PMU data stream within the VPN tunnel is identified and dropped. . . 19
3.1 Network configuration for packet size sampling of PMU 0. . . 24
3.2 Network configuration for packet size sampling of PMU 1. . . 25
3.3 Network configuration for packet separation. . . 25
3.4 HMM Inference Process. . . 29
3.5 A typical histogram of encrypted single PMU traffic captured in one hour. The hor-izontal axis indicates timing delay, the vertical axis indicates the number of packets. Peak value of “a” is 0.024978s and peak value of “b” is 0.050002s. “c” is been trimmed during HMM inference. . . 30
3.6 HMM of one PMU in encrypted VPN tunnel. . . 30
3.7 Histogram of one hour of data, which contains packets from PMU 0 and PMU 1 with no PRBS in power grid. The peak value at 278 presents packets from PMU 0. The peak value at 406 presents packets from PMU 1 . . . 35
3.8 Histogram of one hour of data where packets are captured from PMU 0 with no PRBS in power grid. . . 35
3.9 Histogram of one hour of data where packets are captured from PMU 1 with no PRBS in power grid. . . 36
4.1 The symbolization of inter-packet timing delays of legitimate PMU traffic . . . 44
4.2 The HMM of inter-packet timing delay side-channel of legitimate PMU traffic . . . . 44
4.3 Screenshot of botnet traffic (part) . . . 45
4.4 Experiment setup. . . 45
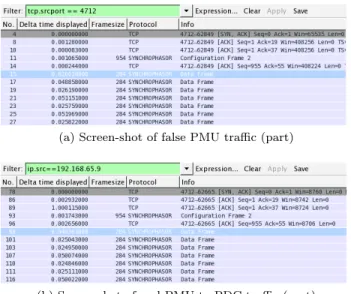
4.5 Comparison between false PMU traffic and real PMU to PDC traffic . . . 46
4.6 Comparison between camouflaged Zbot packet and PMU measurement packet . . . . 48
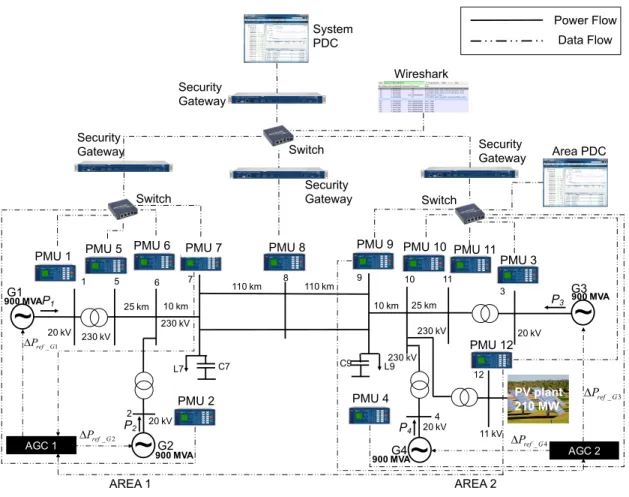
5.1 Two-area four machine power system with a 210 MW PV plant. . . 50
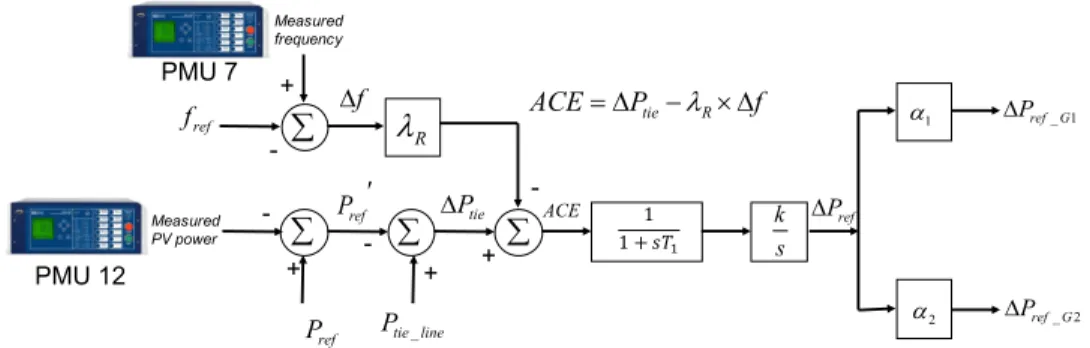
5.2 The Area 1 AGC (AGC1) diagram for tie-line bias control using PMU data. . . 51
5.3 The symbolization of inter-packet timing delays of legitimate PMU traffic. . . 52
5.4 Normalized evaluation map of observed inter-packet delta time. . . 53
5.6 (a) Frequency predictions with PV integration. (b) Absolute Percentage Error (APE)
of the PV predictions. . . 55
6.1 CCN based VSN architecture for frequency prediction in 2-area 4-machine power system with PV plant. . . 59
6.2 The Area 1 AGC (AGC1) diagram for tie-line bias control using PMU data, old data, or VSN data. . . 61
6.3 The flowchart for AGC operations under DoS attacks. This includes four possible cases studied: 1) packet arrived beforet+ ∆t and used for AGC; 2) packet did not arrive before t+ ∆t and value ‘0’ is used for AGC; 3) packet did not arrive before t+ ∆tand last arrived value is used for AGC; 4) packet did not arrive before t+ ∆t and VSN estimated value is used for AGC. . . 61
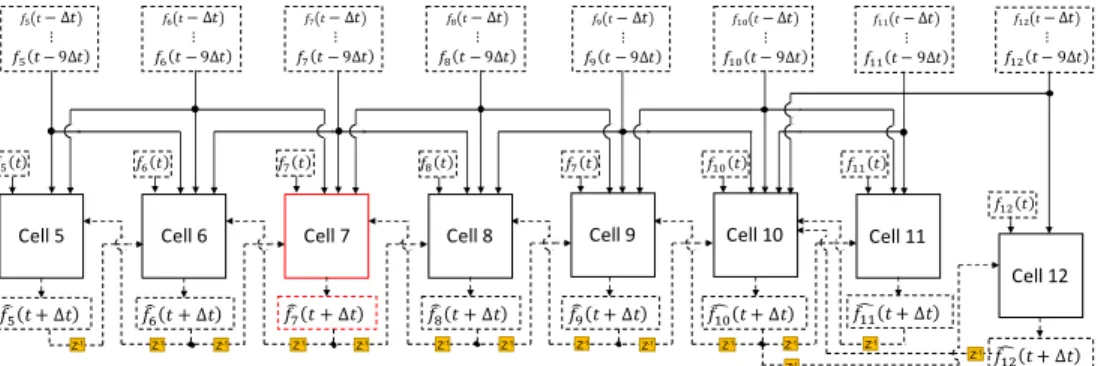
6.4 Recursive VSN prediction procedure for Bus 7 for two consecutive ∆ttime intervals. 63 7.1 The illustration of time frames of the DoS attack experiments. . . 69
7.2 The illustration of IEEE 68-Bus System with VSN integrated. . . 71
7.3 Frequency response at Bus 7 during attack on primary layer PMUs for 20 seconds. . 72
7.4 Frequency response at Bus 9 during attack on primary layer PMUs for 20 seconds. . 73
7.5 Frequency response at Bus 7 during attack on primary layer and secondary PMUs for 20 seconds. . . 73
7.6 Frequency response at Bus 9 during attack on primary layer and secondary PMUs for 20 seconds. . . 74
7.7 Frequency response at Bus 7 during attack on all PMUs except PMU 12 for 20 seconds. 74 7.8 Frequency response at Bus 9 during attack on all PMUs except PMU 12 for 20 seconds. 75 7.9 The accumulate absolute percentage error of Cell 7 frequency predictions under each attack case. . . 75
7.10 The accumulate absolute percentage error of Cell 9 frequency predictions under each attack case. . . 75
7.11 CPS1 of area one under different operation conditions and attacks. . . 76
7.12 CPS1 of area two under different operation conditions and attacks. . . 76
7.13 CPS1 of area three under different operation conditions and attacks. . . 77
7.14 CPS1 of area four under different operation conditions and attacks. . . 77
7.15 CPS1 of area five under different operation conditions and attacks. . . 77
8.1 The latency is changing over time. . . 81
8.2 An incidence of an unexpected latency change that might cause by a network traffic route change. The average latency increased to 0.6 seconds. This incidence lasted for about an hour. . . 81
8.3 The four stages of BGP hijacking attack experiments performed in this study. . . 82
8.4 The absolute delays of PMU traffic before and after the BGP routing switched from Phoenix to Amsterdam. . . 83
8.5 The absolute delays of PMU traffic before and after the BGP routing switched from Amsterdam to Phoenix. . . 83
8.6 The inter-packet delays of PMU traffic before and after the BGP routing switched from Phoenix to Amsterdam . . . 84
8.7 The inter-packet delays of PMU traffic before and after the BGP routing switched from Amsterdam to Phoenix. . . 84
8.8 The CUSUM of absolute delays of PMU traffic before and after the BGP routing switched from Phoenix to Amsterdam. . . 86
8.9 The CUSUM of absolute delays of PMU traffic before and after the BGP routing switched from Amsterdam to Phoenix. . . 87
8.10 The F-Test of absolute delays of PMU traffic before and after the BGP routing switched from Phoenix to Amsterdam. . . 88 8.11 The F-Test of inter-packet delays of PMU traffic before and after the BGP routing
switched from Phoenix to Amsterdam. . . 88 8.12 The F-Test of absolute delays of PMU traffic before and after the BGP routing
switched from Amsterdam to Phoenix. . . 89 8.13 The F-Test of inter-packet delays of PMU traffic before and after the BGP routing
switched from Amsterdam to Phoenix. . . 89 8.14 ROC of applying CUSUM algorithm on the PMU packets’ absolute delay for BGP
hijacking detection. The best operation point gives 91.56% TPR and 4.47% FPR . . 90 8.15 ROC of applying F-Test algorithm on the PMU packets’ absolute delay for BGP
hijacking detection. The best operation point gives 97.72% TPR and 6.35% FPR . . 90 8.16 ROC of applying CUSUM algorithm on the PMU packets’ inter-packet delay for BGP
hijacking detection. The best operation point gives 50% TPR and 56% FPR . . . 91 8.17 ROC of applying F-Test algorithm on the PMU packets’ inter-packet delay for BGP
hijacking detection. The best operation point gives 89.61% TPR and 14.12% FPR . 91 1 Tie-line energy change ∆E in one minute window after a DoS attack under different
scenarios. Please note that the Countermeasure B and Countermeasure A case 2 in figure (a) are overlapped. (a) Four or less packets are blocked. (b) Five or more packets are blocked. . . 102 2 System responses after a fault. One packet from PMU 7 is blocked by a DoS attack.
(a) Frequency response at Bus 7. (b) Power generation of generator 2. (c) Power generation of generator 3. (d) Tie-line power flow. . . 103 3 System responses after a fault. Five packets from PMU 7 are blocked by a DoS
attack. (a) Frequency response at Bus 7. (b) Power generation of generator 2. (c) Power generation of generator 3. (d) Tie-line power flow. . . 104 4 System responses after a fault. 100 packets from PMU 7 are blocked by a DoS attack.
(a) Frequency response at Bus 7. (b) Power generation of generator 2. (c) Power generation of generator 3. (d) Tie-line power flow. . . 105 5 System responses after a fault. Five packets from PMU 7 are blocked by a DoS
attack with Countermeasure A applied. (a) Frequency response at Bus 7. (b) Power generation of generator 2. (c) Power generation of generator 3. (d) Tie-line power flow.106 6 System responses after a fault. 300 packets from PMU 7 are blocked by a DoS
attack with Countermeasure A applied. (a) Frequency response at Bus 7. (b) Power generation of generator 2. (c) Power generation of generator 3. (d) Tie-line power flow.107 7 System responses after a fault. Five packets from PMU 7 are blocked by a DoS
attack with Countermeasure B applied. (a) Frequency response at Bus 7. (b) Power generation of generator 2. (c) Power generation of generator 3. (d) Tie-line power flow.108 8 System responses after a fault. 300 packets from PMU 7 are blocked by a DoS
attack with Countermeasure B applied. (a) Frequency response at Bus 7. (b) Power generation of generator 2. (c) Power generation of generator 3. (d) Tie-line power flow.109 9 Synchrophasor message frame format. The size of payload varies depends on frame
type and the configuration frame. Please note the unit is byte. . . 112 10 The payload format in a synchrophasor data frame. ‘NUM PMU ’, ‘PHNMR’,
‘AN-NMR’, and ‘DGNMR’ are obtained from the configuration frame. Please note the unit is byte. . . 113 11 The communication sequence of a data transmission session using the ‘TCP-only’,
‘UDP-only’, and ’TCP/UDP’ communication methods. . . 115 12 The flowchart of the parser module’s parsing method. . . 117 13 The output of ‘show()’ method. . . 118
14 The logs while trying to connect a non synchrophasor device. . . 119 15 An illustration of the ‘buffer’ status change under different configurations. ‘t’ presents
the GPS time stamp of the measurement data. ‘∆t’ presents the timing interval between two synchrophasor measurements. ‘t´ ’ presents the clock time. ‘c’ presents the client instances. . . 119 16 An illustration of a synchrophasor network built with the proposed package. . . 121 17 A screen shot of the real-time frequency meter example presented in Section B.3.6 . 123 18 The timeline of events related to one synchronized synchrophasor measurements. The
‘Latency to synchronize the received synchrophasors ’ is considered as the time dif-ference between the last data frame received until the user-defined callback function is started. . . 126 19 The time series of latencies caused by the proposed package. In this test, 15 PMUs
are connected, one hour of data is collected. All PMUs are using TCP/UDP commu-nication method. . . 127 20 The time series of latencies caused by the proposed package. In this test, 15 PMUs
are connected, one hour of data is collected. All PMUs are using UDP Spontaneous Data Transmission communication method. . . 127 21 The time series of latencies caused by the proposed package. In this test, 15 PMUs
are connected, one hour of data is collected. All PMUs are using TCP communication method. . . 127
Chapter 1
Introduction
1.1
Overview
The “smart grid” is a modern power system that uses information and communication tech-nologies to provide more efficient, reliable, and sustainable energy than traditional power grid [110]. Different from the conventional power grid, a smart grid allows for a bidirectional flow of informa-tion and energy, and the penetrainforma-tion of renewable energy sources, smart parking lots and prosumers makes the smart grid more flexible but also challenging to control [19]. Real-time monitoring and feed back from network connected sensors and devices are crucial to smart grid operations. As the network connection has become a part of the control loop of the smart grid, the smart grid is facing a whole new challenge in the area of network security.
Smart grid technologies such as synchrophasor networks consisting of Phasor Measurement Units (PMUs) make it possible to monitor, analyzes, and control the electric power grid in real-time. PMUs are one of the most important network connected devices used in smart grid. The PMU measure frequencies, currents, voltages, and phase angles. Thses measurements are labeled with GPS time tags and transmitted to the Phasor Data Concentrator (PDC) at system control centers through synchrophasor networks for further analysis and control. Synchrophasor technology enables reliable and efficient power system operation but also make the system susceptible to network issues, such as connection instability and Denial of Service (DoS) attacks. Power system instability could result from modified, delayed or dropped measurement packets from PMUs in closed-loop application.
The subject of this study involves the security of smart grid synchrophasor networks (PMUs, PDCs, computers and communication systems), commonly known by the power systems society as the cyber-security of smart grids [77] [2] instead of the power systems security.
One common prejudice in smart grid study is that encryption is the solution to most network security issues, and data manipulation or data replay attacks are the most threating network attacks faced by smart grid operations. It is indeed necessary to deploy encrypted communication channels such as using the security gateways to establish Virtual Private Network (VPN) tunnels between locations, which also eliminates many cyber vulnerabilities, including data manipulation or data replay attacks. However, the deployment of encrypted communication is far from the complete solution.
1.2
Cyber Physical Systems Security of Smart Grid
In this section, the current security vulnerabilities found in literature, that are relevant to PMUs, are discussed and mapped to four general attack classes. Known network security vulnera-bilities are also addressed in hopes of exposing gaps where further research needs to be conducted on their specific effects on PMU networks. These attacks and countermeasures are surveyed to provide future research possibilities.
Electricity is essential to maintaining the standard of living globally. Citizens need a reli-able power grid. Increasing consumption requires either that more energy be produced or energy generation be increasingly efficient. The “smart grid” is a modern power system that uses informa-tion and communicainforma-tion technologies to provide efficient, reliable, and sustainable energy [110]. A smart grid allows for bidirectional flow of information and energy in transmission and distribution systems [19]. Real-time monitoring provides situational awareness of system conditions, and ensures that power is continuously available to consumers. Although real-time feedback is critical to power system operations, communications are susceptible to cyber-attacks.
Synchrophasor technology using Phasor Measurement Units (PMUs) provide feedback of the current state of the power system in real time. Synchrophasor measurements are sent to a substation/control center and stored in a database. PMUs communicate to the substation/control center using TCP/IP network connections. The use of TCP/IP makes the system vulnerable to known cyber-attacks. Stallings [101] divides attacks into four general classes: interruption,
inter-Public/Private networks Public/Private networks PMU Security Gateway PMU PMU Security Gateway Security Gateway Security Gateway
Security Gateway Security Gateway PDC
PDC Super PDC
Figure 1.1: An Example Synchrophasor Network.
Table 1.1: Documented Security Vulnerabilities
Current PMU Attacks General Class of Attack References to Attack
Denial of Service Interruption [19–21, 61, 63, 78, 100, 103, 120, 124]
Physical Attack Interruption [11, 19, 21, 63]
Man in the Middle Interception/Fabrication [19, 21, 31, 63, 78, 80, 120]
Packet Analysis Interception [21, 78, 80, 103]
Malicious Code Injection Modification [19, 21, 31, 45, 72, 78, 100, 120, 123]
Data Spoofing Fabrication [11, 19, 21, 78, 96, 103, 120]
ception, modification, and fabrication. In this study, the current PMU security vulnerabilities are surveyed and mapped into four attack classes. Known network vulnerabilities are also presented under the four attack classes. Previous research, shown in Table 1.1, has investigated PMU vulner-ability to Denial of Service (DoS), malicious code injection, packet analysis, physical damage, and data spoofing attacks.
Fig. 1.1 shows an example Synchrophasor network. Global Positioning System (GPS) time stamps allow measurements to be synchronized so the network can be analyzed as a whole [20]. Once the synchrophasors synchronized with the GPS, each measurement the synchrophasor sends across the network includes a time stamp. All electrical distribution line measurements are sent via a network connection to a PDC. The PDC is a regional command station for the grid [63]. The PDC stores measurements for additional processing.
1.2.1
Interruption Attacks
The simplest interruption attack is a physical attack, for example, cutting a cable. A more sophisticated attack is denial of service. DoS attackers attempt to consume systems resources, such
as bandwidth, to prevent users from accessing the system. DoS attacks can use flaws in network protocols to deny access to legitimate users. One common type of DoS attack is an Internet Control Message Protocol (ICMP) attack [124]. In a Distributed Denial of Service (DDoS) attack, the attacker takes control of multiple machines that are called zombies. Zombies are used to overload the target’s bandwidth, resulting in legitimate traffic being slowed or dropped.
1.2.1.1 PMU Specific DoS
Researchers in [78] tested various types of DOS attacks such as network layer attacks, Internet Control Message Protocol (ICMP) attacks, transport layer attacks, Local Area Network Denial (LAND) attacks, and teardrop attacks against the PMU network. All of these attacks take advantage of weaknesses in network protocols. The PMU network is dependent on real-time measurement data, making it vulnerable to this attack. If a malicious person were to perform this attack on multiple PMUs, all of the measurements from those PMUs would either be dropped or delayed. This could cause inaccurate predictions about the status of the transmission system, delayed mitigation of power system problems, or total failure of measurement devices along the network.
1.2.1.2 DoS Countermeasures
Even though DOS attacks remain a serious threat to power grids that incorporate PMU networks, there are limited ways to prevent or mitigate the damage caused by an attacker. One possible solution to DOS attacks on PMU networks would be to use an “air gap” network. Air gap networks provide no physical connection to the larger Internet. This type of isolation comes with the disadvantage of cost, it is costly to build separate network infrastructure for the power grid. Some of the common DOS countermeasures are the use of big pipes or large bandwidth connections to insure the network can handle the traffic. DOS traffic can also be mitigated using distributed or redundant infrastructure. Researchers in [61] discuss DDOS attacks and there countermeasures. The paper discusses the different types of flooding attacks, the methods to detect flooding attacks, and existing countermeasures. [47] proposed a mechanism to resist Denial-of-Service attacks efficiently. [62] proposed an authentication scheme can prevent DOS attacks even if attackers break servers.
1.2.1.3 Physical Attacks
A PMU can be isolated from the network by using physical attacks that damage hardware or infrastructure. This includes cutting a network connection between the PMU and PDC or sabotaging the PMU. Limiting access to critical infrastructure can mitigate this type of attack. Not included are software attacks that effect hardware.
1.2.2
Interception
Two types of interception attacks that effect synchrophasor networks are (passive) packet analysis and (active) man-in-the-middle attacks. The basis of an interception attack is to use the information communicated via the PMU and PDC to the attacker’s advantage unlike an interruption attacks that stops communications.
1.2.2.1 Packet Analysis
Contents of the PMU TCP/IP packets are susceptible to packet analysis, “sniffing”. Pro-gram such as Wireshark [19], allow attackers to look at the traffic being sent across the network. If encryption is not used, all information communicated can be seen by the attacker. In [103], re-searchers used Wireshark to analyze the synchrophasor network. The network traffic was redirected and captured, and the data was in clear text. This makes it possible for an attacker to get passwords and other information sent across the network.
1.2.2.2 Packet Analysis Countermeasures
Adding a security gateway to the network, allows the packets to be sent across a virtual private network (VPN) tunnel. Researchers in [103] found that when packets were sent through a virtual private network (VPN) tunnel, the traffic was encrypted. VPN’s allow users to create a virtual network between two sub-networks that are trusted. The packets sent within the VPN are in a secure tunnel between the clients. VPN tunnels commonly use the Secure Socket Layer (SSL)/Transport Layer Security (TLS) protocol to secure the communications between VPNs. To insure a secure connection the parties on the network use X.509 certificates to authenticate users and then exchange symmetric keys. This process is supposed to provide the system with security, but may have implementation and design errors. Some of the previously successful attacks on
SSL/TLS include [21]: DNS Cache Poisoning, ARP Poisoning, Man-in-the-Middle Attacks and TLS/SSL Certificate Attacks. VPNs are essential for securing traffic, but they need to be carefully implemented and their security verified. Each of these attacks have been shown to work on networks, research still needs to be conducted to see their impacts on PMU networks. They are not a panacea; rather they are part of a reasonable security program.
1.2.2.3 Man-in-the-Middle Attacks
Man-in-the-Middle (MIM) attacks occur when an attacker poses as the other side of a legiti-mate protocol session to both the legitilegiti-mate client and server. For example, if B and A communicate, the intruder I replaces the BA link with two links BI and IA. In a PMU network, a Man-in-the-Middle attack would occur between the PMU and the PDC. The attackers disguise themselves as the PDC to the PMU and as the PMU to the PDC. Man-in-the-Middle attacks can use methods such as route table poisoning, modified packet source and destinations, and using compromised certifi-cates. Researchers in [24] discuss a method of using false certificates to conduct a Man-in-the-Middle attack. The paper discusses the false certificate vulnerability for a HTTPS connection. However, this method could be further utilized in any system that uses certificates to secure connections. In the PMU network, if the PDC uses X.509 certificates for authentication then a Man-in-the-Middle attack would be possible between the PDC and the PMU.
1.2.2.4 Man-in-the-Middle Attacks Countermeasures
To prevent this type of attack from occurring, the users need to authenticate the server they try to connect to [80]. One of the most common authenticate applications applied today is to employ Secure Sockets Layer (SSL) or Transport Layer Security (TLS) protocol to authenticate the server. SSL/TLS provides support for user authentication based on public key certificates. Use public key certificates system to defeating man-in-the- middle attacks is theoretically a solved problem. However, in many cases [32], secrets are sent directly from clients to servers with almost every request across all layers of the network stack make this technique vulnerable. In [32], researchers developed a layered solution to solve the problem, each layer consisting of minor adjustments to existing mechanisms across the network stack. [62] proposed an authentication scheme can prevent MIM attacks even if attackers break servers.
1.2.2.5 Side Channel Attack
Protocol tunneling is widely used to add security and/or privacy to Internet applications. Recent research has exposed side channel vulnerabilities that leak information about tunneled pro-tocols [46]. Side-channels extract information by indirectly observing implementation artifacts. For example, a significant timing side-channel vulnerability for SSH can extract the system password from interactive sessions [98].
1.2.2.6 Side Channel Attack Countermeasures
These attacks can best be countered by saturating the communications channels leaving no available bandwidth for patterns to emerge. Due to the extreme resource requirements, this approach can only be used in extreme cases [46].
1.2.3
Modification
Modification attacks look for security vulnerabilities to corrupt, highjack, or alter a legit-imate process. An example of this type of attack is malicious code injection. In a malicious code injection attack, the attacker inserts new instructions into a piece of code to alter its form of ex-ecution. One common type of modification attack is Structured Query Language (SQL) injection. SQL is a standardized language for managing databases. This form of attack allows the attacker to insert a script into a piece of code to alter the database.
1.2.3.1 PMU Specific Malicious Code Injection
PMUs continuously send measurements to the PDC. Before measurements are sent across the network, the PMU sends a configuration message to the PDC to specifying the data table to set up in its database [103]. The PDC does not authenticate the configuration message. Instead, it creates new tables specified in the configuration message. This leaves the system vulnerable to code injection. Researchers in [123] describe two insertion attacks: code-injection and return-oriented programming. In code-injection, the attacker directly inserts shell code (a set of malicious instructions) into the program. Return-oriented programming reuses binary code already present in the system as shell code. Shell code is the software exploit payload. Either attack can send malicious instructions to the database management system, to add, delete, or modify the database,
or take control of the system. Since all the data sent to the PDC is stored in a database, PMUs are particularly susceptible to SQL injection attacks [31]. The SQL injection vulnerability most frequently comes when queries are formulated from user inputs. This attack occurs if user input is not properly validated before inclusion in the SQL query [45].This attack can add, delete, or modify the database contents and therefore directly modify, corrupt, append, and/or disable PMU measurement information. The attacker can make the condition of a transmission system appear to be the opposite of its actual state. For example, if there is an issue with a transmission bus or line, an attacker can modify measurements to indicate it is normal, which could put the power system at risk for an outage.
1.2.3.2 Countermeasures
In [123] the authors suggest detecting code insertion by monitoring program performance. If an attacker has inserted shell code into a program, the program should behave unusually. Another method to overcome malicious code injection attacks on PMU networks is to use randomized en-cryption keys when transferring messages [50]. Only the PMU and the PDC would have the key. If the attacker does- not have the random key, then they will be unable to decipher the instructions. In modern operating systems, code injection is made difficult by either randomizing the system address space or monitoring the stack to detect buffer overflows [21]. Both of these approaches could be rel-evant to PMU network implementation. [118] proposed a geographical routing protocol allows peers in a Smart Grid system to adjust their interaction behaviors based on the trustworthiness of others. The protocol can avoid packet drop attack and data spoofing attack by using a safe forwarding list. [62] proposed an authentication scheme can prevent attackers to resent previously intercepted login messages even if attackers break servers. To counteract SQL injection attacks: either check inputs for characters that can be abused, or use parameterized statements that force user inputs to follow a static template. These templates only allow certain inputs to be translated into queries. For further prevention, databases should also have strict access controls for allowing users to modify or manipulate data.
1.2.4
Fabrication
Fabrication attacks occur when attackers create a fictitious asset on the network. Data spoofing and the previously mentioned Man-in-the-Middle attack both are fabrication attacks. Both
send fabricated data across the network. The PMUs continuously send data to the PDC along with instructions on how to set up database tables. Man-in-the-Middle and data spoofing attacks can send false measurements. This differs somewhat from modification attacks, since the data can be not related to current measurement data. If the PDC collecting the data does not authenticate PMUs on the network, the PDC may accept fabricated data.
1.2.4.1 PMU Data Spoofing
Since the control centers will depend on the feedback from the PMUs to make decisions about the current condition of the electrical grid, the accuracy of the data is important. Data spoofing gives the control center forged data instead of actual data. This can be detrimental to the stability and reliability of the grid. In [100], researchers inject false data into the system. This data can be either PMU measurements or measurement time stamps. In [96], authors spoof the GPS time stamps for measurements. Altering measurement times can render measurements useless. For example, readings can be reordered to make capacity reduction seem to be capacity increase, etc.
1.2.4.2 Data Spoofing Countermeasures
In [120], authors show that data spoofing has very little effect when it is limited to a single data feed. To mitigate data spoofing the grid can use multiple PMUs to monitor the same electrical transmission bus or line, which would make spoofing more complicated. The use of redundant measuring devices is supported by [11]. Those authors use redundant smart meters, but the same idea is relevant to PMUs. In [41], authors proposed a multi-antenna based algorithm to detect time stamp spoof. The GPS signals from two receiving antennas are fed to two independent processing units. The differences of the carrier-signal-to-noise ratio (ClNo) from these two receiving paths can be exploited as probabilistic measures. Using this, the change in the distribution of sequential samples is detectable. [118] proposed a geographical routing protocol, which can avoid packet drop attack and data spoofing attack by using a safe forwarding list.
1.2.5
Access Control
With insufficiencies of the legacy power grid communications protocols, increased data gen-eration and communications bring about new challenges in access and collecting the data. Some recent researches presented access control methods for Electric Power Synchrophasor Networks,
which could provide both security and efficiency [121], [119], [12], [27]. In [108], researchers pre-sented a data collector protocol, which can verify the integrity while they are not given access to the content. [62] proposed an authentication scheme can prevent Off-line dictionary attacks.
1.2.6
Countermeasures After Attacks Occurred
Some other researches are focused on attack detections and countermeasures after attacks occurred. [48] proposed game payoff formulae. A decision analysis can then be obtained by applying backward induction technique on the game tree. [64] provided a dynamical systems context for formulating distributed multi-switch strategies. [10] presented intrusion detection methods used to analyze the measurement data to detect any possible cyber-attacks on the operation of smart grid systems. [39] analyzed the cyber-attack related time delay issues, and deals with the minimization of negative effects of such delays in smart gird system.
1.2.7
Summary of This Section
The “smart grid” is a modern power grid that uses information and communication tech-nology to provide reliable, efficient, and sustainable power. To upgrade the current power system to a smart grid, PMUs are being installed. Due to limited amount of research on how these attacks effect PMU networks, further research needs to be conducted to determine their effects.
1.3
Objectives
The objectives of this dissertation are list as follows:
• Investigate side-channel vulnerabilities in encrypted synchrophasor network communication and its consequences.
• Investigate and evaluate mitigation methods against the above vulnerabilities.
• Perform game theory analysis to the synchrophasor network security.
1.4
Contributions to Date
The contributions of this dissertation are list as follows:
• Comprehensive reviews of synchrophasor network security.
• Packet size side-channel and inter-packet timing side-channel are discovered in encrypted syn-chrophasor network communication.
• Protocol transformation from botnet traffic to synchrophasor protocol is implemented.
• DoS attack that exploits side-channel vulnerabilities on tie-line bias control using Automatic Generation Controller are investigated and consequences outlined.
• Countermeasures against above DoS attacks using Cellular Computational Network [112] based Virtual Synchrophasor Network are developed and shown to be most effective.
• Real-time DoS attacks and Virtual Synchrophasor Network countermeasures are performed.
• The resiliency test of Virtual Synchrophasor Network by mitigating multiple DoS attacks is performed.
• Border Gateway Protocol (BGP) hijacking attack detection on PMU data stream are proposed and evaluated.
1.5
Organization of this Dissertation
This dissertation begins with introducing necessary background knowledge in Chapter 2.Then, Chapter 3 focuses on the side-channel vulnerabilities of PMU; Chapter 4 explores the feasibility of protocol transformation. DoS attacks based on this vulnerability is presented in Chapter 5. A mitigation method of above DoS attack is proposed in Chapter 6. The resiliency of the mitigation method is studied in Chapter 7. The best strategy under different circumstances are identified in Chapter 9 Finally, a conclusion is given in Chapter 10.
1.6
Publications
1. A. Keenan, R. Schweller, and X. Zhong. Exponential replication of patterns in the signal tile assembly model. In D. Soloveichik and B. Yurke, editors, DNA Computing and Molecular Programming, pages 118–132, Cham, 2013. Springer International Publishing
2. J. E. Padilla, M. J. Patitz, R. Pena, R. T. Schweller, N. C. Seeman, R. Sheline, S. M. Summers, and X. Zhong. Asynchronous signal passing for tile self-assembly: Fuel efficient computation and efficient assembly of shapes. In G. Mauri, A. Dennunzio, L. Manzoni, and A. E. Por-reca, editors, Unconventional Computation and Natural Computation, pages 174–185, Berlin, Heidelberg, 2013. Springer Berlin Heidelberg
3. C. Beasley, X. Zhong, J. Deng, R. Brooks, and G. Kumar Venayagamoorthy. A Survey of Electric Power Synchrophasor Network Cyber Security. InInnovative Smart Grid Technologies Conference Europe (ISGT-Europe), 2014 IEEE PES, pages 1–5, Oct 2014
4. X. Zhong, A. Ahmadi, R. Brooks, G. K. Venayagamoorthy, L. Yu, and Y. Fu. Side channel analysis of multiple pmu data in electric power systems. In 2015 Clemson University Power Systems Conference (PSC), pages 1–6, March 2015
5. X. Zhong, P. Arunagirinathan, A. Ahmadi, R. R. Brooks, and G. K. Venayagamoorthy. Side-channels in electric power synchrophasor network data traffic. In Proceedings of the 10th Annual Cyber and Information Security Research Conference, CISR ’15, pages 3:1–3:8, Oak Ridge, Tennessee, USA, 2015. ACM
6. X. Zhong, L. Yu, R. Brooks, and G. K. Venayagamoorthy. Cyber security in smart dc microgrid operations. In2015 IEEE First International Conference on DC Microgrids (ICDCM), pages 86–91, June 2015
7. X. Zhong, Y. Fu, L. Yu, R. Brooks, and G. K. Venayagamoorthy. Stealthy malware traffic -not as innocent as it looks. In2015 10th International Conference on Malicious and Unwanted Software (MALWARE), pages 110–116, Oct 2015
8. A. Keenan, R. Schweller, M. Sherman, and X. Zhong. Fast arithmetic in algorithmic self-assembly. Natural Computing, 15(1):115–128, Mar 2016
9. Y. Fu, Z. Jia, L. Yu, X. Zhong, and R. Brooks. A covert data transport protocol. In2016 11th International Conference on Malicious and Unwanted Software (MALWARE), pages 1–8, Oct 2016
10. X. Zhong, I. Jayawardene, G. K. Venayagamoorthy, and R. Brooks. Denial of service attack on tie-line bias control in a power system with pv plant. IEEE Transactions on Emerging Topics in Computational Intelligence, 1(5):375–390, Oct 2017
11. R. R. Brooks, L. Yu, Y. Fu, G. Cordone, J. Oakley, and X. Zhong. Using markov models and statistics to learn, extract, fuse, and detect patterns in raw data. In N. S. Rao, R. R. Brooks, and C. Q. Wu, editors,Proceedings of International Symposium on Sensor Networks, Systems and Security, pages 265–283, Cham, 2018. Springer International Publishing
12. X. Zhong, P. Arunagirinathan, I. Jayawardene, G. K. Venayagamoorthy, and R. Brooks. Pha-sortoolbox – a python package for synchrophasor application prototyping. In 2018 Clemson University Power Systems Conference (PSC), 2018
13. X. Zhong, P. Arunagirinathan, I. Jayawardene, G. K. Venayagamoorthy, and R. Brooks. A virtual synchrophasor network for power system resiliency under concurrent dos attacks. IEEE Transactions on Power Systems. Submitted for peer review
14. X. Zhong, G. K. Venayagamoorthy, and R. Brooks. Bgp hijacking detection in synchrophasor network. IEEE Transactions on Power Systems Letter. Submitted for peer review
1.7
Summary
The original intention in deploying synchrophasor devices is for reducing the system op-eration cost while increasing both revenue and service quality. However, the cost of a guaranteed delivery of real-time PMU measurement data is expensive.
Traditional power grid controls do not address the new challenges in the smart grid, and existing network security solutions do not fulfill smart grid operation requirements. Little research has been carried out at this intersection to identify the potential problems, evaluate their impact on synchrophasor networks and addressing those vulnerabilities.
This dissertation gives a brief overview of the area and then profoundly dig into one specific problem. Network security vulnerabilities that are unique to smart grid operations are identified. Such vulnerabilities are critical to the smart grid operation but easily overlooked without enough understanding of both areas. The consequence of the vulnerabilities is presented. The solution specifically for this problem is explored and evaluated. Finally, the perspective of this discussion is expanded with game theory analysis to give a broader view of the network security research in the smart grid.
The study and results presented in this dissertation reduced the gap in the field, effectively reduces both the cost and risk of adopting PMU in closed-loop applications and further enhancing the reliability of the smart grid.
Chapter 2
Background
2.1
Overview
In this chapter, the terminology and necessary background for this dissertation are pre-sented.
2.2
The Synchrophasor Protocol
Since PMUs are widely distributed and used by many electric power utilities, a standard protocol ensures consistent data storage and network communications between PMU networks. The current PMU communications standard is the IEEE C37.118 protocol [52], which defines synchropha-sor data conventions, measurement accuracies, and communications formats . To adhere to the IEEE C37.118 protocol, the synchrophasor has to recognize five frame types: Data frame (binary), Two configuration frames (binary), Header frame (ASCII) and Command frame (binary). The configuration and header frames describe the synchrophasor configuration, the data frame contains measurements, and the command frame tells the PMU when to start and stop taking measurements. Once measurements have been collected, they are processed using a phasor data concentrator (PDC) such as the open-source OpenPDC [7]. OpenPDC takes measurements and sorts them by their time stamps. The measurements are archived in a database using their time stamps.
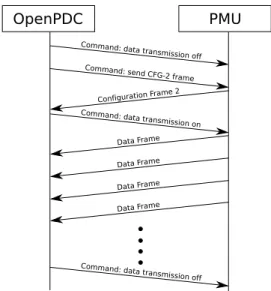
The structure of the protocol is illustrated in Figure 2.1. The mapping of the protocol in a IP packet is shown in Figure 2.2 A typical sequence diagram of communications between OpenPDC
and one PMU in the application layer is shown in Figure 2.3. OpenPDC starts a new session by sending a command asking the PMU to stop current data transmission, followed by a request for a configuration frame, which describes the format of PMU measurement packets used for this transmission. After receiving the configuration frame from PMU, OpenPDC sends the PMU a start command. Once the measurement data transmission starts, it will not stop until a stop command is received or the connection is lost. OpenPDC acknowledges each measurement data packet it receives.
Figure 2.1: Example of frame transmission order. This figure is from IEEE Standard C37.118.2 [52]
Figure 2.2: Mapping of IEEE C37.118 data into a TCP or UDP packet A transport layer header and trailer are shown, as it would be when using Ethernet. This figure is from IEEE Standard C37.118.2 [52]
2.3
Security Gateways
Security gateways establish VPN tunnels between private networks through public network. The security gateways encrypt and decrypt packets. The deployment of security gateways reduces the risk of sending critical data through an unsecured network. In the power system, security gateways are used in critical connections, such as, communications between PMUs and PDCs. Each packet sent from a PMU or PDC contains a TCP/IP header and payload, which will be encrypted by security gateways. In order to send encrypted data through the conventional network, encrypted data will be attached to a new IP and Encapsulating Security Payload (ESP) header as the encrypted
OpenPDC PMU Command: send CFG-2 f rame Command: da ta transmission on Configuration Frame 2 Data Frame Data Frame Data Frame Data Frame Command: da ta transmission off Command: da ta transmission off
Figure 2.3: Observed sequence diagram of Synchrophasor protocol in application layer
payload. After encryption, any data in the original packet like packet destination, source, and original payload are encrypted. The source and destination IP address of the encrypted packets are usually the IPs of two security gateways.
Security gateways use the Internet Protocol Security (IPsec) protocol to ensure communica-tions and interoperation. As a framework protocol to secure the connection, IPsec mainly provides authentication, verification and confidentiality. Authentication means checking if the data is from where it claims to be. Verification means checking whether it has been altered. Confidentiality means checking if the data is visible to third parties in transit [58]. IPsec protocols mainly provide authentication, verification and confidentiality. Authentication ensures the data is from where it claims to be, verification checks whether the received data has been altered, and confidentiality ensures the data been transferred is not visible to third parties [58]. Advanced Encryption Standard (AES) and Triple Data Encryption Algorithm (TDEA or 3DES) are commonly used for encryption. The authentication and encryption methods make it practically impossible to decrypt and modify an encrypted packet without proper keys. Fig. 2.4 demonstrates the process that encrypts a PMU measurement package by a security gateway.
The encryption algorithms used in IPsec have five modes, which are: ECB (Electronic Code Book), CBC (Cipher Block Chaining), CFB (Cipher FeedBack), OFB (Output FeedBack), and CTR (Counter) [49]. At the beginning of an encrypted connection session, two security gateways
Figure 2.4: The PMU measurement packet encryption.
will negotiate the algorithm used for this session. In the experiments, it is found that CBC is used in most cases. IPsec-secured links are defined in terms of Security Associations (SAs). Each SA is defined for a single unidirectional flow of data, and usually from one single point to another. And it produces traffic distinguishable by some unique selectors [58], which means the disruption of one connection in one pair of nodes should not affect other connections within the same secure tunnel.
The security gateway quickly encrypts each packet and barely alters the timing features of the original traffic. Similarly, the packet size of encrypted packets is correlated to the size of the original packets. By analyzing the packet streams rather than looking at a specific packet, additional information can be inferred.
2.4
Side-Channel Analysis
Although the encryption systems are mathematically difficult to crack, but the physical implementation of cryptographic systems leak information. Side-channel analysis extract informa-tion by observing implementainforma-tion artifacts. For example, the power consumpinforma-tion of a computer is correlated to different operations. By monitoring power consumption, the activities of a program can be inferred [59]. For network enabled programs, it is possible to infer program operations by analyzing the network traffic. In [98], a timing side-channel vulnerability of SSH has been used to extract the system password from interactive sessions.
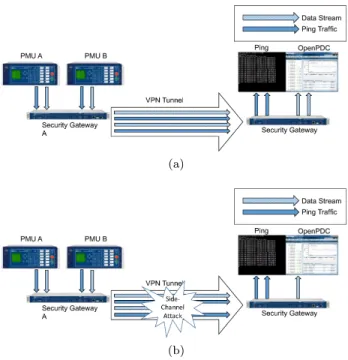
A VPN is a tunneled, and encrypted connection established between two private networks though public network. Packets transferred through a VPN tunnel have the same source and desti-nation IP. The real source and destidesti-nation IPs for each packet are encrypted and can not be seen by the third party. Fig. 2.5a shows a VPN tunnel that connects two private networks, multiple traffic streams are transmitted though the tunnel including two PMU measurement data streams.
(a)
(b)
Figure 2.5: An example of a DoS attack in a VPN tunnel: (a) A VPN network carries Ping traffic and data streams from two PMUs to control center; (b) During a DoS attack, a PMU data stream within the VPN tunnel is identified and dropped.
a VPN tunnel. Furthermore, packet size side-channels and inter-packet timing side-channels can differentiate between the sources of PMU packets when multiple PMU data streams are transmitted in a single encrypted VPN tunnel. In this case, an encrypted VPN tunnel is established between two subnets. Multiple PMUs in one subnet are connected to a PDC on the other subnet through this encrypted VPN tunnel. Mapping the encrypted packets to PMUs based on inspect the content of each packet is impossible. However, by using side-channel analysis, the most probable mapping between packets and PMUs can be identified and a specific PMU data stream can be blocked by an attacker without interfering with other traffic in the same VPN tunnel, shown as Fig. 2.5b. This attack is easy to perform but difficult to diagnose. The attack only identifies and blocks the PMU data transmission stream. Other traffic from PMUs e.g. PING or HTTP is not blocked, thus making the PMU appear to be connected to the network while not transmitting any data.
2.4.1
Hidden Markov Models
In previous work [13], detecting PMU measurement sessions was possible even when all packets are encrypted by performing side channel analysis on timing delay between every two packets. In that study, a Hidden Markov Model (HMM) using packet timing delays is built, where packets
are captured from encrypted PMU traffic between two security gateways. Then HMM inference is used to recognize encrypted PMU traffic. HMMs are widely used for pattern recognition and detection [65].
2.5
Man-In-The-Middle Attack
A MITM attack is an cyber-attack that falls in to the category of interception attack [14]. Generally, it occurs anywhere between two legitimate nodes in a network. For example, if A and B are two legitimate nodes connected by connection AB, attacker C can take over the connection by replacing AB with connection AC and connection CB. So attacker C can intercept and modify all communications between A and B. In PMU-PDC communications, attackers disguise themselves as PMU if the packets are sent from PDC to PMU, and vice versa. It is the same for communications between a PDC node and a super PDC. This vulnerability and countermeasures are discussed in [14]. Without using security gateways or any other security countermeasures, an attacker could view, modify and redirect measurement packets easily. By using security gateways to encrypt the traffic, the chance of packets being manipulated is practically eliminated.
The MITM attack is very easy to apply and can be performed in many different ways. On the Internet, packets are redirected to the destination based on the Board Gateway Protocol (BGP) routing mechanism. BGP route hijacking is very easy to be applied and sometimes caused by human mistakes. In March 2015, traffic from Texas, US to the UK was redirected to Ukrainian and Russian telecoms for five days. Multiple sites were affected, including UK’s official mail service, and nuclear weapon managing and delivering system [113]. On April 26, 2017, Russian telecom Rostelecom hijacked traffic belonging to MasterCard, Visa, and many other financial services companies for several minutes [107]. In January 2017 Iran’s act of pornography censorship mistakenly redirected traffic from Russia to Hong Kong to blank pages [114]. In a local network, MITM attack can be performed in many ways such as Address Resolution Protocol (ARP) spoofing, Domain Name System (DNS) poisoning, Media Access Control (MAC) address spoofing and so on.
2.6
Summary
The terminology and background introduced in this chapter will be used in all following chapters.
Chapter 3
Side-Channel analysis of PMU
Traffic
3.1
Overview
Synchrophasor devices such as Phasor Measurement Units (PMUs) are essential power sys-tem components for real-time monitoring, analysis and control. The data from several PMUs are sent to a Phasor Data Concentrator (PDC) via network connections. The PMU data are used for monitoring electric power network operations and performing real-time decision-making and control. In previous research [14], it has been pointed out that by using security gateways and Virtual Private Network (VPN) tunnels to encrypt traffic, many possible vulnerabilities can be eliminated. How-ever, these communications are still vulnerable to side-channel analysis. In previous studies [126], side-channel inter-packet timing delays are used to map the packets to different PMUs.
In this study, packet size side-channel and inter-packet timing delay side-channels are used to differentiate the source of PMU packets in an encrypted VPN tunnel containing multiple PMU data streams. Two PMUs are connected to a PDC through an encrypted VPN tunnel. Packets transferred in this VPN tunnel have unified source and destination IP addresses for each direction and the original source IP is encrypted. Mapping packets in an encrypted VPN tunnel to PMUs based on the clear text header in each packet is impossible. However, by using side-channel analysis, the most probable mapping between packets and PMUs can be identified. The proposed methods
can identify and block traffic from specific PMU in a power system.
3.2
PMU Packet Size Side-Channel
Analysis
In this section, the methods of identifying the packet source in an encrypted VPN tunnel using packet size side-channel is explained, where the VPN tunnel is transporting packets from multiple PMUs. The following subsections are organized as follows: Section 3.2.1 introduces the experimental network configurations and give a brief overview of this method; Section 3.2.2 describes the method to perform packet identification using packet size side-channel; Section 3.2.3 describes methods used to evaluate the accuracy of these method.
To be consistent, ‘PMU 0’ and ‘PMU 1’ refer to two PMUs with different model numbers. ‘PMU A’ and ‘PMU B’ refer to two PMUs, the first packet in the main stream is assigned to ‘PMU A’, the identity of ‘PMU A’ is unknown; it is simply a label to distinguish between ‘PMU A’ and ‘PMU B’.
To identify PMU models using packet size side channels, it is needed to build a map between encrypted or unencrypted packet size and its corresponding model number. In this experiment, there are only two PMUs sending packets through one VPN tunnel and no other applications are sending packets. To differentiate PMU models, no map is needed.
3.2.1
Experimental Setup and Procedure
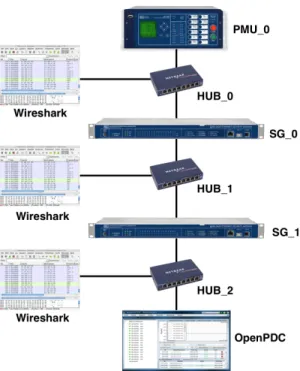
All experiments and measurements are carried out in the Real-Time Power and Intelligent Systems (RTPIS) Laboratory in Clemson University [92]. At the RTPIS lab, simulating power systems in real-time and collecting data using PMUs is possible. Real Time Digital Simulator (RTDS) is used to build and perform real-time simulation of a power system. The hardware PMUs are used to take measurements. There are hardware and software PDCs, and both of them can collect data from PMUs. In this study, software, OpenPDC, is used to collect data from hardware PMUs. Also, two hardware security gateways are set up to encrypt and decrypt packets between PMUs and PDCs. Wireshark running on computers connected to the hubs in the network is used to collect packets. The network configurations are shown in Figs. 3.1, 3.2 and 3.3.
Figure 3.1: Network configuration for packet size sampling of PMU 0.
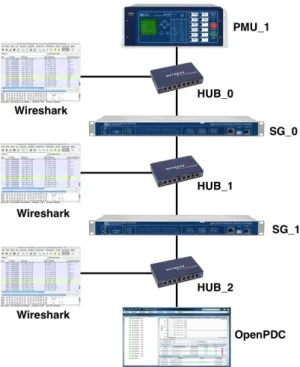
The first two network configurations (Figs. 3.1 and 3.2) are used to get packet size and inter-packet timing delay samples. The third network configuration (Fig. 3.3) is used to perform packet identification and evaluate its accuracy. PMUs and PDCs do not encrypt or decrypt packets, so the packets collected at ‘HUB 0’ and ‘HUB 2’ in three Figs. 3.1, 3.2 and 3.3 are in clear-text and the payload and IP source/destination of each packet are observable. Packets are encrypted between security gateway SG 0 and security gateway SG 1 shown in Figs. 3.1, 3.2 and 3.3. It is noticed that variation in power grid dynamics has no affect on the packet sizes between different PMUs.
Data collected under the network setting shown in Figs. 3.1 and 3.2 is used to build the map between packet sizes and PMU model numbers. The histograms of packet sizes can be found in Appendix 3.4.1. After getting the mapping of packet sizes to PMU model numbers (Table 3.3), both PMUs are added to the network, as shown in Fig. 3.3. Packet sizes to PMU model numbers map is used to determine the source of each packet collected at the hub between two security gateways, shown as ‘Hub 1’ in Fig. 3.3. Finally, the accuracy of the identification method is discussed.
Figure 3.2: Network configuration for packet size sampling of PMU 1.
3.2.2
Packet Size to PMU Model Map
The packets generated from different PMU models have different sizes. There are two types of PMU packets essential to power grid operation: PMU measurement and PMU configuration pack-ets. Each PMU measurement packet is composed by a fixed length header followed by synchrophasor data frames. The size of each synchrophasor data frame is related to PMU models, where different models have different synchrophasor data frame sizes. The size of a PMU measurement packet can be expressed as Eqn. 3.1
SP M U = 54 +n×SDAT A (3.1)
WhereSP M U is the length of PMU measurement packet, 54 is the byte size of the header,nis the
integer number of data frames contained in this packet andSDAT A is the length of synchrophasor
data frame for this PMU model. From the data captured, a map from synchrophasor data frame size to PMU model numbers is shown as Table 3.1.
Table 3.1: Map of Synchrophasor Data Frame Sizes to PMU Model Numbers Synchrophasor Data Frame Size PMU Model Number
154 PMU 0
284 PMU 1
A PMU configuration packet is sent at the beginning of each PMU-PDC session. The map of PMU configuration packet size to PMU model number is shown as Table 3.2.
Table 3.2: Map of PMU configuration packet size to PMU Model Numbers Encrypted PMU Configuration
Packet Size PMU Model Number
428 PMU 0
1008 PMU 1
Encrypted by security gateways, each encrypted packet is composed by a fixed length of header and ESP payload. The encryption algorithm used by security gate ways requires the size of data is an integer multiple of 32 bytes. Therefore, a variable size of “padding” is attached to extend the payload data. The relation between clear-text packet size and cypher-text packet size can be expressed as Eqn. 3.2
Scypher= 54 +b
Sclear
WhereScypheris the size of cypher-text packet, 54 is the byte size of header andSclearis the size of
clear-text packet.
In most of the cases, each PMU packet contains one synchrophasor data frame. When packets are lost, PMU will resend packets contains multiple synchrophasor data frames. The number of synchrophasor data frames is usually between 1 to 10. Thus, a map between clear-text PMU packet sizes, cypher-text packet sizes and PMU model numbers is inferred as Table 3.3.
Table 3.3: Map of Packet Sizes to PMU Model Numbers
Packet type Number of Synchro Clear-text Cypher-text PMU Model Number -phasor Data Frames Packet Size Packet Size
C 428 486 PMU 0 M 1 208 278 PMU 0 M 2 362 422 PMU 0 M 3 516 582 PMU 0 M 4 670 726 PMU 0 M 5 824 886 PMU 0 M 6 978 1046 PMU 0 M 7 1132 1190 PMU 0 M 8 1286 1350 PMU 0 M 9 1440 1510 PMU 0 M 10 1594 1654 PMU 0 C 1008 1078 PMU 1 M 1 338 406 PMU 1 M 2 622 678 PMU 1 M 3 906 966 PMU 1 M 4 1190 1254 PMU 1 M 5 1474 1542 PMU 1 M 6 1758 1814 PMU 1 M 7 2042 2102 PMU 1 M 8 2326 2390 PMU 1 M 9 2610 2678 PMU 1 M 10 2894 2950 PMU 1
‘M’ denotes for Measurement packet, ‘C’ denotes for Configuration packet
This allows the PMU model numbers to be inferred from encrypted traffic in near real-time.
3.2.3
Comparison Between Encrypted and Unencrypted Data Streams
In this study, different PMU models are used and no other hardware in the network produces packets of the same size. Encrypted packets can be mapped to specific PMU models using the packet size side-channel with 100% accuracy rate. If the network contains packets have the same sizes with
PMU packets but are not from PMU, the accuracy rate should be lower.
3.3
Inter-Packet Timing Delay Side-Channel Analysis
In this section, the method of identifying packet source in an encrypted VPN tunnel using inter-packet timing delay side-channel is explained, where the VPN tunnel is transporting packets from multiple PMUs. The following subsections are organized as follows: Section 3.3.1 introduces the network configurations and gives a brief overview of the method; Section 3.3.2 and 3.3.3 describe the two steps of this method to perform packet separation and section 3.3.4 describes the method used to evaluate the accuracy of the proposed packet separation method.
3.3.1
Experimental Setup and Procedure
The experiments in this section using similar settings to Section 3.2. First, data is collected under the network setting shown in Figs. 3.1 and 3.2 to infer the HMM model for a single PMU, as well as, obtain the peak timing delays.
After getting peak timing delays, shown as Fig. 3.5, and the HMM model for a single PMU, shown as Fig. 3.6, both PMUs are added to the network, shown as Fig. 3.3. Algorithm 1 (Section 3.3.3) along with HMM and peak timing delays are used to determine the source of each packet collected at the ‘Hub 1’ between two security gateways, shown in Fig. 3.3. Finally, the accuracy of this method is checked by comparing the source of each encrypted packets inferred with the source of each unencrypted packets captured simultaneously at the ‘Hub 0’ on PMU side, shown in Fig. 3.3.
3.3.2
HMM for Single PMU Recognition
The HMM construction algorithm can be found [65], which infers the HMM structure and state transition probabilities from a sequence of symbolized observations. To infer the HMM struc-ture, a sequence of symbols with length L is needed. An extension [95] is used to determine the
parameterLand derive HMMs with noa priori information. Starting from 1, by gradually
increas-ingL, the HMM for each value ofL is constructed. A symbol-to-state mapping is built to check if
the model structure stabilizes. If the inferred HMM stabilizes, the model is declared correct [95]. This occurs when with no additional statistical relevant information could be gained with largerL.
If the HMM is built from an insufficient amount of observation data, it will not statistically represent the underlying process. A model confidence test is carried out to determine if the constructed model matches the underlying process with a given level of statistical significance [122]. This approach also calculates a lower bound on the number of samples needed for building a correct model. If the number of input samples is less than the bound, more data is collected. New models inferred with more data are still checked for the confidence. This approach allows us to remove the effect of noise in the HMM inference [65]. The HMM inference approach is shown in Fig. 3.4.
Figure 3.4: HMM Inference Process.
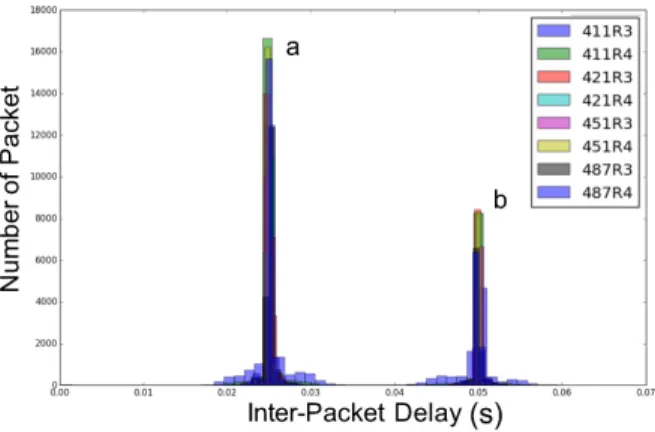
The first experiment collects the inter-packet delays of same PMU sent through an encrypted VPN tunnel under different scenarios. The histogram of inter-packet delays collected from a single PMU traffic is shown in Fig. 3.5, in which there are three peaks along thex-axis. The leftmost peak
is omitted as it is considered insignificant compared with the other peaks during HMM inference. It is noticed that variation in power grid dynamics doesn’t affect the selection of symbols and there is no significant change in peak timing delays under different power grid dynamics. The HMM built from the symbolized data sequence is given in Fig. 3.6.
3.3.3
Packet Separation Algorithm
This section considers the scenario of multiple PMUs sharing the same encrypted tunnel. Assume that the HMM used by the target PMU and the peak timing delays are known, as well as the number of PMUs. A packet separation algorithm is proposed to identify the packets generated by multiple PMUs [126]. A sub stream is extracted recursively from a given number of packets collected in the small time interval. The packets in the same sub stream should come from the same PMU. In each recursion, all the possible combinations of the packet sources are considered. For
Timing Delay
Number of Packets
a
b
c
Figure 3.5: A typical histogram of encrypted single PMU traffic captured in one hour. The horizontal axis indicates timing delay, the vertical axis indicates the number of packets. Peak value of “a” is 0.024978s and peak value of “b” is 0.050002s. “c” is been trimmed during HMM inference.
Figure 3.6: HMM of one PMU in encrypted VPN tunnel.
each combination, packets for each source are used to build sub strings. For each sub strings, the optimum mapping between the observed delays and the peak values is determined.
For delays generated by the target PMU, each of them should close to one of the peak values.