Addressing the Future of Clinical Information
Systems—Web-Based Multilayer Visualization
Chueh-Loo Poh, Richard I. Kitney, and Rasu B. K. Shrestha
Abstract—This paper addresses some key issues relating to the development of new technology for clinical information systems (CIS) in relation to imaging and visualizing data. With the in-creasing importance of molecular and cellular biology, a new type of medicine, molecular based medicine, is now developing. This will significantly alter the way in which medicine is practiced. The view is presented that CIS will need to operate seamlessly across the Biological Continuum, i.e., the hierarchy of the human organism comprising systems, viscera, tissue, cells, proteins, and genes. We propose a multilayered visualization interface, which operates across the Biological Continuum, based on Web-based technology. A visualization interface package for two-dimensional and three-dimensional image data at the visceral and cellular lev-els is described. Two application examples are presented: 1) MR knee images, at the visceral level and 2) endothelial nuclei images, acquired from confocal laser microscopy, at the cellular level.
Index Terms—Biomedical imaging, CIS, PACS, three-dimensional (3-D) visualization, Web-based.
I. INTRODUCTION
C
LINICAL information systems (CIS) have developed rapidly over the last decade. Much of this development has involved various imaging modalities, coupled to PACS. The universal availability of information, including images, wave-forms, etc., will become increasingly important. This paper ad-dresses some of the important issues relating to the development of new technology for CIS. With the increasing importance of molecular and cellular biology, a new type of medicine, molec-ular based medicine, is now developing. This will significantly alter the way in which medicine is practiced. The view will be presented in this paper that future CIS will need to oper-ate seamlessly across the biological continuum (BC), i.e., the hierarchy of the human organism comprising systems, viscera, tissue, cells, proteins and genes.A. Overview
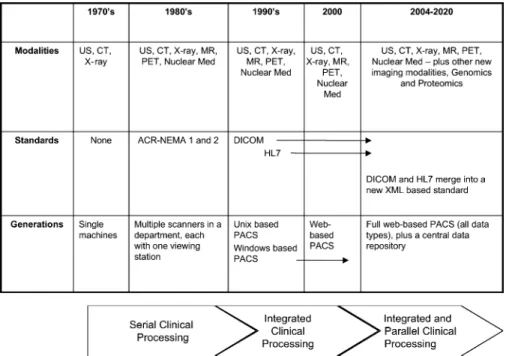
The history of PACS is illustrated in Fig. 1. In the 1980s and 1990s PACS was the domain of the scanner manufacturers; in the 1990s, the film manufactures became involved, because of the shift away from film. From now and for the foreseeable future
Manuscript received June 25, 2005; revised October 11, 2005 and January 5, 2006. This work was supported in part by the SIMILAR EU Network of Excel-lence. The work of C.-L. Poh was supported by an NTU Overseas Scholarship. C.-L. Poh and R. I. Kitney are with the Department of Bioengineering, Im-perial College, London SW7 2BX, U.K. (e-mail: [email protected]).
R. B. K. Shrestha is with the Department of Radiology, University of South-ern California, USC Healthcare Consultation Center II, Los Angeles, CA 90033 USA.
Color version of Figs. 2, 7, 8, 11, 12, and 13 are available online at http:// ieeexplore.ieee.org
Digital Object Identifier 10.1109/TITB.2006.875680
(i.e., for the next one or two decades) the emphasis will be on in-formation integration and its universal data access. Increasingly, there will be less reliance on film. Future generations of PACS will be based on system integration and software for fully Web-based systems as part of a CIS. Web-Web-based infrastructures are now being implemented. They allow the CIS (including PACS) to move from a department system to an enterprise wide system. The DICOM standard is the glue that makes open architecture CIS (including PACS) work. Consequently, DICOM is central to the development of CIS.
The clinical trends described above will lead to a world in which imaging systems will be used routinely and directly, not just in radiology, but across a range of clinical specialties (e.g., cardiology, oncology, surgery, pathology, etc.). Image data ac-quisition already takes place in many of these specialties, but the images are often only viewed on technology associated with the acquisition device. A good example of this is the acquisition and viewing of arthroscopy images. In many specialties, imag-ing is currently where radiology was in the 1980s, i.e., viewimag-ing on individual machines. This situation will significantly alter in the near future largely, both directly and indirectly, through changes in technology. These changes will allow universal ac-cess to data, images, waveforms, etc., across the enterprise (e.g., the hospital) and beyond.
Four key components that make the universal image and data access achievable are:
r
price and power of computers—for example, Pentium com-puters have the processing power of the Unix workstations previously used for PACS at a fraction of the price;r
availability, use and price of industry standard hardware;this moves PACS from being based on specialist hardware and operating systems to standard hardware and operating systems—with all the associated cost savings, which can be achieved through economies of scale;
r
presence of a comprehensive international standard for imaging (DICOM), together with other standards (e.g., HL7 and Extensible Markup Language, XML);r
ability to provide fully Web-based CIS, including PACS; these systems use specialist application software that runs on standard hardware and standard operating systems.B. Clinical Needs
Clinical needs must be thought of in terms of different time scales.
1) Immediate Future: In the immediate future there will be a need to provide much more universal Web-based access to images, which have been traditionally associated with Radiology (e.g., magnetic resonance imaging (MRI), computed
Fig. 1. History of PACS and the associated standards.
tomography (CT), ultrasound, X-ray, angiography, etc.) across different clinical specialties, within the enterprise (e.g., the hos-pital). However, there is also a rapidly developing need to pro-vide universal Web-based access to a wider range of images from procedures such as minimal access surgery (e.g., arthroscopy and laparoscopy); the recording of physiological waveforms (e.g., EKGs, blood pressure, heart rate variability, etc.); as well as histological and hematological images. In addition, CIS will need to incorporate diagnostic photographic images e.g., retinal images; dermatological images and more general clinical photography. It is important to note that many of these image types are already defined within the DICOM standard.
2) Next 5–10 Years: Over this period the landscape of medicine is set to change radically. These changes are impor-tant because the CIS that will be installed in the future must be able to accommodate the changes in clinical practice, which are likely to occur over this time frame and beyond.
Clinically, it is critical for these changes in the CIS to allow for the seamless integration of molecular imaging, also called the next frontier of diagnostic imaging. Traditional imaging techniques have probed the end results of disease processes; but we are now at a stage where clinicians are being able to visualize and identify the evolution of disease processes long before the signs and symptoms of these processes become apparent by visually observing the abnormalities and changes at the cellular and molecular levels. This will entirely transform the approach to clinical diagnosis from an imaging level, allowing detection of pathologies at the “predisease” level.
February 2001 was an important date in the history of medicine. This was the date of the publication of the paper in Nature that reported the initial sequencing of the Human Genome [1]. In practical terms this date represents the dawn of the “New Medicine,” i.e., molecular based medicine. From now on there will be a rapidly developing trend away from a data poor
to a data rich health care environment; and a move away from treating clinically evident disease to diagnosis and treatment based on an understanding of the disease mechanisms. Both of these trends will have a profound effect upon the way in which medicine in practiced. There will be an increasing reliance on imaging across many medical specialties involving integrated care.
Clinicians will be able to accurately pinpoint troublesome genes and use imaging and associated molecular therapy as part of an overall strategy to treat existing as well as potential disease processes.
Central to these developments is the concept of the BC [2], [3], i.e., the hierarchy of the human organism comprising:
r
systems;r
viscera;r
tissue;r
cells;r
proteins;r
genes.Medicine today is often practiced at one or two of these levels, i.e., there is generally little or no vertical integration across the levels. This is set to radically change. The ability to image at all of these levels will become central to the practice of medicine.
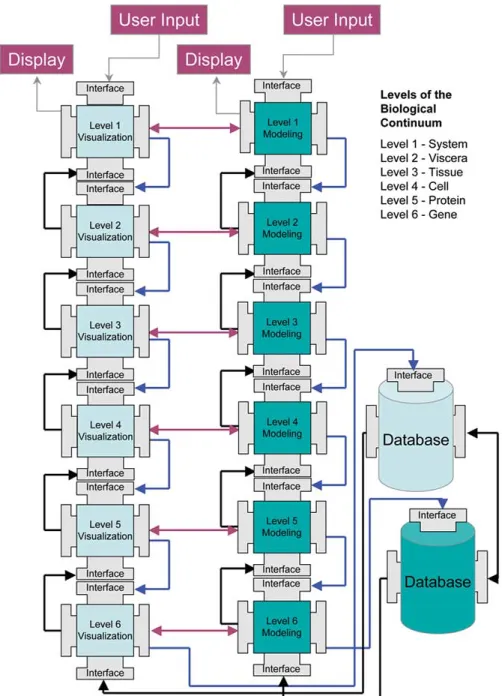
Fig. 2 illustrates the overall schema for the type of CIS (based on the BC model) which forms the conceptual basis of this paper. Referring to the figure, the left-hand side of the diagram shows the visualization schema and the right-hand side the equivalent modeling. The figure illustrates the layout for all the six levels of the BC (i.e., level 1, system to level 6, gene; see key in the top right hand section of Fig. 2) and how they are linked. In practice the user can choose, via the user input interface, which of the levels they wish to address. All of the levels are linked to a com-mon database. (Later in the paper, we will present an example of how the schema of Fig. 2 is used at the visceral and cellular
Fig. 2. Multilayered visualization and modeling.
levels for visualization.) Another aspect of the concept illus-trated in Fig. 2 is that at many levels and in many instances, data and images from the models can be compared with the equiva-lent patient data (as shown by the double headed arrows in the center of the diagram). Another important feature of the schema is that geometric integrity is preserved across the levels—even though different modalities are used for the data acquisition [4].
C. Scope of the Paper
In this paper, we will focus on some of the visualization issues associated with our conceptual model (Fig. 2), i.e., we do not address anything related to modeling studies. This is the subject of a separate area of work. The concept is that at each Level relevant mathematical models (either produced by our
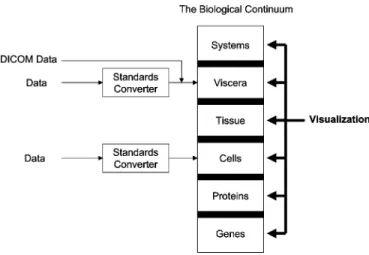
group or other workers) will be incorporated, as appropriate. This is being done by the use of Markup Languages (e.g., in the case of cellular level—Level 4—by CellML [5]). As stated in the previous paragraph, this will enable direct comparison between visualization and model results. In any area of application typically there will be a wide range of data [both two-dimensional (2-D) and three-dimensional (3-D)] across the BC. Hence, there is a tremendous need to readily access and view the full range of data. In this paper, we propose a multilayered visualization interface across the BC based on Web-based technology to address this need—this is based on earlier work [6]–[10]. The aim is to develop common software visualization interfaces that can be applied to all the levels of the BC, as shown in Fig. 3. (It is important to understand that at this stage the software system that we describe is designed purely
Fig. 3. Visualization across all the levels of the BC based on a common Visualization Package schema.
as a practical implementation of aspects of the CIS model—i.e., we are, for example, not claiming that parts of our software are necessarily state of the art or that we are in any way developing or describing a system specification.) A key to achieving this aim is the use of DICOM standard as the image data format. Consequently, a standards converter (Fig. 3) is necessary to reformat data from various imaging modalities [e.g., electron microscopy (EM) and atomic force microscopy (AFM)] into to a standard format. The schema proposed in this paper (Fig. 5) relates to the processes after the standards converter (see Fig. 3).
Specifically, we describe the application of a common visu-alization package (VP)—see Fig. 5—to visualize data at the visceral and cellular levels of the BC (Fig. 3). Our focus is on the software processes and graphical user interfaces (GUI) that were developed to view 2-D and 3-D image data. Two exam-ple applications are presented: MR knee images—used in the diagnosis of osteoarthritis (OA) at the visceral level; and im-ages acquired from confocal microscopy—used in the study of atherosclerosis at the cellular level.
D. Web-Based Visualization Interface Designs
Visualization and imaging at different levels of the BC, the use of Web-based information and communication technology, will become increasingly important in molecular based medicine. In the context of CIS, Web-based technologies (such as universal Web browser technology and standard communication formats) should be used to access the full range of data across the BC. The use of Web-based technologies will allow clinicians to gain universal access to a patient’s data in real time anywhere in the Enterprise (e.g., the hospital) using PCs, MACs, etc. [7]. The need for a proprietary workstation can be overcome and, con-sequently, costs can be reduced. In this context by proprietary workstation, we mean special viewing workstations, i.e., from scanner manufacturers. What we are proposing is the use of specialist viewing software based on standard hardware and op-erating systems. This technology can be implemented on both the Internet and on Intranets.
An additional advantage of the Web-based approach is that the client software can be platform independent, as long as the Web browser is supported. Hence, the system can be a fully portable application, which can be used in different locations with Internet connection. Standards are very important for the development of such applications, because they need to com-municate with each other to perform useful tasks. The use of standard Web-based content formats, such as Hypertext Markup Language (HTML) and XML, will greatly facilitate communi-cation of such applicommuni-cations and the development of user inter-faces. The DICOM standard was created to aid the distribution and viewing of 2-D medical images, e.g., CT and MR scans, and ultrasound. The standard is central to the development of PACS. In general, the DICOM image format is not currently supported by standard Web browsers. This poses a problem if standard Web browsers are used to view 2-D medical images.
E. Web-Based 3-D Visualization
With the advent of high-resolution 3-D imaging modalities, 3-D visualization in biology and medicine has become possible. This extends across a wide range of scale—i.e., from individ-ual molecules (proteins/genes) and cells through the varieties of tissue to complete organs and physiological system. 3-D vi-sualization is proving to be useful in a wide range of medical and biological applications. 3-D imaging studies, such as post processed CT and MR studies, provide the primary source of patient-specific data for such applications. We would argue that real-time 3-D visualization and manipulation is necessary in or-der that clinicians can make full use of the information contained in medical image data. This is exemplified by the growing trend of using 16, 32, or 64 slice-CT scanners, which has resulted in huge data sets for the same study protocol, with each study now growing in size from a few dozen images to thousands of im-ages. 3-D visualization is now a necessity to even comprehend these growing data sets.
A range of visualization software for medical images already exists. These software packages can be roughly divided into two categories. Category A comprises packages that generally run on standalone workstations. Category B comprises Web-based software packages that have been developed for specialized applications.
1) Category A—3-D Visualization Software Packages:
Some of the 3-D visualization software packages, under this cat-egory are: ANALYZE [11]; Open Source 3-D Slicer [12]; Julius [13]; OsiriX [14] and Advanced Visual Systems (AVS) [15]. These systems generally allow 2-D to 3-D reconstruction, 3-D visualization, and quantitative analysis of various medical scans. They also provide: extensive functionality—such as interactive orthogonal and oblique sectioning of 3-D models [11], [12]; support both medical and biological multidimensional image formats, e.g., in ANALYZE [11]; and a single portable and ex-tendable environment for image-guided medicine, e.g., in 3-D Slicer [12]. There also exist open source visualization and im-age processing toolkits such as Visualization Toolkit (VTK) [16] and Insight Segmentation and Registration Toolkit (ITK) [17]. These toolkits have been widely used in the development of
medical software programs, e.g., 3-D Slicer, Julius and OsiriX. These visualization systems have been used in various medical applications. They generally run on standalone workstations.
2) Category B—Web-Based Visualization Systems: Re-cently, a number of Web-based visualization systems and ap-plications, using application programming interfaces (APIs), have been reported in the literature. These include Virtual Real-ity Modeling Markup Language (VRML)/Extensible 3-D (X3-D) [18], Java3-D [19] and programming languages—such as Java [20]—to utilize the capabilities of high speed networks; an Internet-based system for simulation-based medical plan-ning for cardiovascular disease—which utilizes Java and VRML [18]; a medical visualization system for medical diagnosis us-ing Java3-D [19]; and the anatomy browser of surgical plannus-ing laboratory (SPL), using Java applets [20], which combines 3-D surface models of anatomical structures, their cross-sectional slices and textual descriptions of their structures.
There are a number of important differences between our approach and the software listed above under categories A and B. Our approach is fully Web-based; i.e., it aligns with category B software that allows much wider access to the data images, etc.—often across the enterprise. However, there are a number of differences between our software and the other packages listed under category B.
1) Our software is designed for the implementation of the schema illustrated in Fig. 2—i.e., to allow the display, storage and integration of a range of images into a common framework.
2) Our software is specifically designed to match the concept of the BC; i.e., to deal with data from different imaging modalities and different levels of the BC—while preserv-ing geometric integrity [4].
3) Our software is designed to be compatible with existing PACS systems.
4) Although we are not addressing modeling in this paper, our software is also designed to interface with modeling software and associated data at different levels of the BC— for example, such packages as CellML [5].
In Web-based 3-D visualization applications, there is, typi-cally, no access to large-scale computing environments. New techniques have to be developed to achieve a reduction in the computational expense of the 3-D reconstruction process; as well as the number of generated primitives to be viewed on personal computers [21]. Surface rendering and volume ren-dering are two classes of 3-D reconstruction techniques that are commonly used. Web-based 3-D visualization applications, based on surface rendering techniques [21], [22], have been de-scribed. Surface rendering, however, normally requires an ex-tensive amount of preprocessing. In addition, the quality of the final visualized model is limited by the accuracy of the segmen-tation process. Due to the high resolution of the volume data, this usually results in a large number of polygons [21].
Volume rendering is a more general rendering method. It can mimic surface rendering (but not vice versa) [23]. The main advantage of volume rendering is its ability to preserve the integrity of the original data throughout the visualization pro-cess [24]. However, the method requires much larger amounts
of computational time than surface rendering. Recently, there has been progress toward Web-based visualization using volume rendering, but, to date, there are only a few reported implemen-tations [25], [26].
As a result of these considerations, and because the current primary objective for our 3-D visualization is to display and manipulate data at various levels of the BC, we have, for the moment, implemented only surface rendering. This provides the speed of image manipulation that we require. However, we are currently working on 3-D volume rendering methods, which will be integrated into our system in the future.
The GUI is important in the diagnostic process when the clini-cian is visualizing 3-D anatomic structures. It is often difficult to relate the 3-D model to the original 2-D images. Hence, if abnor-malities are identified in the 3-D model, it is frequently difficult to accurately identify them in the 2-D images acquired on the scanner. One approach to overcoming this problem is to display the original 2-D images and the 3-D model on the same interface with their geometric relationships maintained [11], [12]. These user interfaces are, however, standalone—i.e., not Web-based.
II. MATERIALS ANDMETHODS
This section describes the design of a multilayered visualiza-tion schema and the approach that we have taken in relavisualiza-tion to the development of the interfaces. The design of the visualiza-tion package is described in the second secvisualiza-tion; this is followed by a description of the development of various software pro-cesses.
A. Overview of Multilayered Visualization Schema
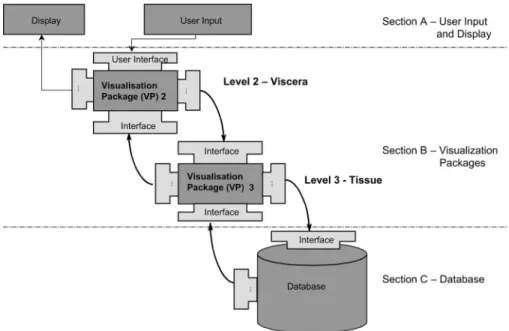
The design of a multilayered visualization schema for the BC is shown in Fig. 4. The system comprises three functional sections: Section A, user input and display; Section B, visual-ization packages; and Section C, databases. Referring to Fig. 4, for convenience, only two example levels of the six levels of the BC are shown at Section B.
1) Section A: This section of the overall system comprises the user interface and display that is used for all six-levels of the BC. Web-based technology was used in the development of the user interface for viewing 2-D images and 3-D models. The interface captures user inputs; for example, the user can navigate and select the image dataset of interest through view-ing a series of image thumbnails on a standard Web browser. After selecting the image dataset, images are retrieved from the database for viewing. Backend processes, e.g., 3-D reconstruc-tion, are carried out on the server and the generated 3-D models are viewed on the client.
The user interface is designed to be interactive and intuitive. The interface allows the user to view 3-D models and 2-D im-ages, (still and moving). An important feature of the interface is its ability to present quantitative information. For example, this may relate to the anatomical properties of tissue and tissue function in health and disease. An illustrative example, which will be described later in this paper, is the use of the interface to study cartilage thickness changes in OA [27]–[33].
Fig. 4. Schema of multilayered visualization. At section B only two-levels of the BC are shown (i.e., visceral and tissue) in the diagram, for convenience.
2) Section B: This section comprises the VPs for each layer of the BC. Once the image data have been acquired, their manip-ulation, in terms of 2-D images and the creation of 3-D models (i.e., visualization, rendering), uses virtually the same approach for all levels of the BC. Consequently, the VPs comprise com-mon software and processes. For example, 3-D surface and vol-ume reconstruction techniques that can be applied to images ob-tained from different imaging modalities. It is important to note that standards, e.g., DICOM, are key to making this approach possible. The main difference between the VPs for different levels of the BC is likely to lie in the segmentation processes applied to images acquired using different modalities. These VPs will, in the future (during further development stages of our system), be linked through an automatic interface that will allow seamless navigation from one VP to another and incorporating other types of data (e.g., physiological waveforms, movies, and sounds). The developments for other types of data will base on a similar framework that we have implemented for images.
3) Section C: This section comprises the interface from the VPs to database. This involves storing and retrieving image datasets from the database using Structured Query Language (SQL) commands. The data retrieved are/will be processed by the appropriate VP. Although the focus in this paper is on imag-ing and visualization, it should be noted that the database may include other patient related diagnostic data—such as blood test results and physiological waveforms (e.g., ECGs). These data may well be related to the EPR aspects of a CIS, but a discussion of this topic is beyond the scope of this paper.
B. Visualization Package Schema
The detailed schema of a VP is illustrated in Fig. 5. The VP comprises viewing interfaces for both 2-D images and 3-D mod-els using a Web browser on the client: Segmentation, 3-D recon-struction, and 3-D slicing are carried out on the server. Hence, the general approach is for computationally intensive processes
Fig. 5. Schema of a visualization package.
to be carried in the server. The main advantage of such architec-ture is that the server can carry out the computationally demand-ing processes and download the results back to the client. Thus, a user with a standard desktop computer can utilize the power of a much more powerful computer and view the results locally.
Referring to Fig. 5, users navigate and select image datasets by viewing a set of image thumbnails in the Web browser. Si-multaneously, any important parameters that are required by the visualization processes can be specified. Users may choose to view 2-D images or 3-D models. At this point selected im-age datasets are retrieved from the database and, if appropriate, passed through a segmentation process. Two classes of 3-D re-construction techniques are commonly used: surface rendering and volume rendering [24]. For surface rendering, segmentation is essential to identify the structure of interest within biomedical image, particularly in the case of MR images. (For CT images the tissue boundaries are much clearer; hence, segmentation is usu-ally unnecessary.) Therefore, a segmentation process is included
in the schema: ideally, this should be fully automatic. However, in practice automatic segmentation has proved to be very dif-ficult, particularly for pathological data [28]. Semi-automatic approaches that require a certain degree of user intervention have been found to be much more reliable [28]–[30], provided that the voxel size is properly defined (i.e., resolution). Our semi-automatic segmentation is based on edge detection using a radii search approach, designed to segment articular cartilage from MR knee images [33]. Volume rendering is a more reliable tech-nique and segmentation is not required. The main advantage of volume rendering is its ability to preserve the integrity of the original data throughout the visualization process. However, this often requires large amounts of computation time compared to surface rendering. Hence, surface rendering is used in our cur-rent implementation. Surface rendering provides a well-defined 3-D surface model of anatomical structures. In our interface the surface rendered model is displayed, together with 2-D images. The model gives the 3-D perspective of the structure of interest and the 2-D images provide the overall view with respect to the rest of the tissue in the volume.
In client/server architecture, following the 3-D reconstruction process a file that describes the 3-D scene graph must be down-loaded to the client for viewing. Web-based technology has now developed to the point where 3-D visualization is practicable. HTML has wide acceptance. It is, however, normally a 2-D con-tent format and provides only limited resources for supporting interactive 3-D graphics over the web. VRML was developed to address these difficulties.
VRML is the ISO standard for transmitting 3-D content over the web [34]. It supports various multimedia data types (e.g., au-dio, image, video) and integrates with web scripting languages, e.g., JavaScript. A VRML scene graph can be viewed from Web browsers, e.g., Internet Explorer (IE) by using a third party VRML plug-in. Recently, X3-D, which is the new development of VRML, has been adopted by the Moving Picture Experts Group (MPEG) to bring interactive 3-D graphics to the MPEG-4 multimedia standard [35]. It has added features, e.g., 3-D texture mapping and a number of different file formats avail-able; including XML. Consequently, the VRML/X3-D standard was chosen as the file format for our system to ensure smooth communication with various applications. The reconstruction program was written in C++ using objects from VTK [16] for 3-D processing. At the end of the process, VRML files are ex-ported and downloaded through the network to the client for viewing. The volume data are visualized through MultiPlanar Reformatting (MPR)—i.e., 3-D Slicing. As it is often difficult to relate 3-D models to the original 2-D images, images from or-thogonal planes can be reformatted and displayed, together with the 3-D models, to facilitate the visualization process. This 3-D slicing process, based on MPR, was implemented within the re-construction program. Original DICOM images were the input to the program. Current VRML plug-ins only support standard media formats and do not support DICOM format. As a result, reformatted images from orthogonal planes (i.e., sagittal, axial, and coronal) were generated using the JPEG format.
Using the interface on the client, users can view 2-D DICOM images and the associated 3-D model downloaded from the
Fig. 6. (a) A typical sagittal slice image from a normal volunteer, showing thick articular cartilage. (b) A sagittal slice image from a patient with OA, showing reduced cartilage thickness.
server to the Web browser. The user can then manipulate the 3-D model using geometric maneuvers—such as translation, zoom-ing and rotation. Furthermore, 2-D images can be displayed within the same 3-D scene for re-slicing back into 2-D—i.e., the system supports nonorthogonal 2-D slicing/viewing. Cur-rently, most Web-based interfaces do not support the viewing of DICOM images. Hence, a Java applet was written to decode and display DICOM images. Therefore, in our 2-D viewer the user can view full resolution medical images and perform basic tasks associated with DICOM images, in relation to PACS— windowing and leveling, etc.
C. Examples
The functionality of the system will now be demonstrated by means of two examples, the first at the visceral level and the second at the cellular level.
1) Visceral Level: OA can be described as the degradation and loss of articular cartilage. Because of its excellent soft tissue contrast, MRI is becoming increasingly clinically important in the assessment of OA. For the purposes of the example, we selected two sets of MR knee images in DICOM format. The first set consists of 56 sagittal slices from a normal volunteer. Each slice has a matrix size of 256×256 with a slice thickness of 1.5 mm. The second dataset comprises of 23 sagittal slices from a patient with OA—each slice has a matrix size of 512×512, with a slice thickness of 3 mm. Fig. 6 shows two representative MR knee images from the datasets used in our study.
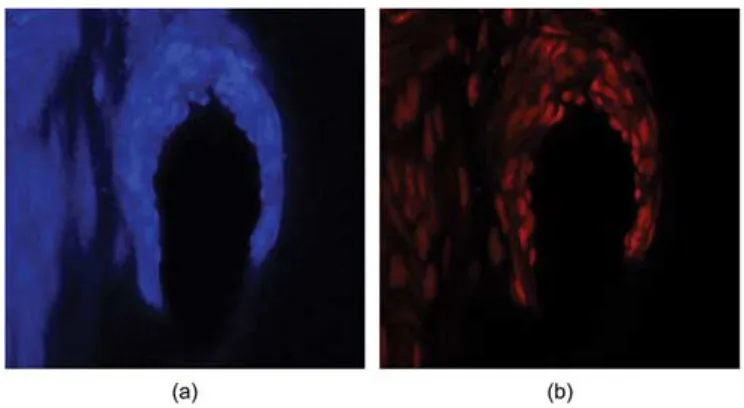
2) Cellular Level: Confocal microscopy is used to image endothelial cells of arterial wall for the study of Atherosclerosis [36]. We used two sets of images showing the endothelial cells of the thoracic aorta wall of a mouse as illustrated in Fig. 7. The images were acquired by confocal microscope and stored in TIFF format. Each set consists of 40 image slices and each slice has a matrix size of 2048×2048, with a slice thickness of 1.5µm.
D. Thumbnail Selection
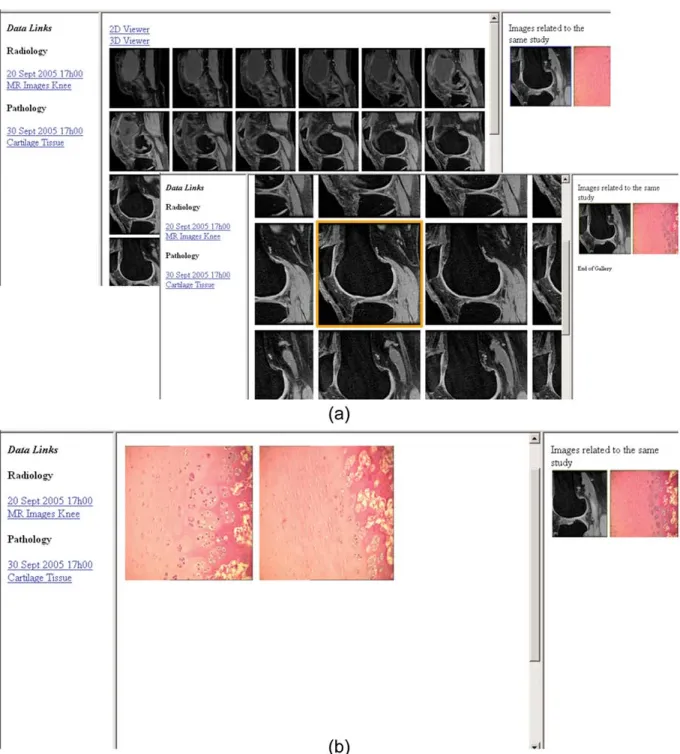
We have developed an image thumbnail selection user inter-face. With the interface, the user can select the images related to a particular study of the patient via the Web browser. The image thumbnails are displayed using scalar vector graphics (SVG) format. As a result, it is possible to zoom in or to enlarge the image thumbnails during the selection process [see Fig. 8(a)].
Fig. 7. Sample image showing (a) autofluorescence of the arterial wall and (b) endothelial nuclei (in red) at the same spatial location.
The image data related to a particular study of the patient are listed as hyperlinks on the bottom left frame of the interface. In addition, the representative thumbnails of the data are displayed in frame on the far right.
E. Preprocessing
1) Visceral Level: MR images were segmented prior to 3-D reconstruction. Femur, tibia and the femoral cartilage were segmented from the volume dataset and saved as three separate set of images. The segmented images were saved in DICOM format. These structures were segmented and saved separately so that the individual 3-D model could be manipulated after reconstruction. Under DICOM the hierarchy is Study, Series, Images. In this context, the three data files (i.e., femur, tibia, and the femoral cartilage) will be stored and linked under the heading of the original 2-D images.
2) Cellular Level: A region of interest (ROI) of size 512×512 was defined in one image. This was then saved as a separate image in grayscale DICOM format. The same pro-cedure was performed automatically for all the 80 images. As a result, 80 images (i.e., 40 images from the autofluorescence dataset and 40 from the endothelial nuclei dataset) were pro-duced; these were subsequently used for 3-D reconstruction.
F. 3-D Reconstruction
Our 3-D reconstruction program generates a surface model from segmented image data. The program was written in C++ using VTK for processing. We have implemented a data-processing pipeline using VTK objects. In this approach, all the data are read and a pixel threshold is defined to select the required structure for reconstruction. Subsequently, the volume data are smoothed to reduce step-like artifacts in the model. The volume is then processed using a marching-cubes algo-rithm [37]. This process produces triangles within the voxels that contain the surface. While marching cubes can produce a very accurate surface model, the method does so by generating a large number of polygons (to capture the details of the surface). To prevent the model becoming too large for the client to render, polygon-decimation implementation, provided with VTK, was used to reduce the number of triangles. The last stage in the pipeline exports the scene to files in VRML format. These are
then downloaded to the client and rendered in a standard Web browser using a VRML plug-in.
G. VRML 3-D Slicing
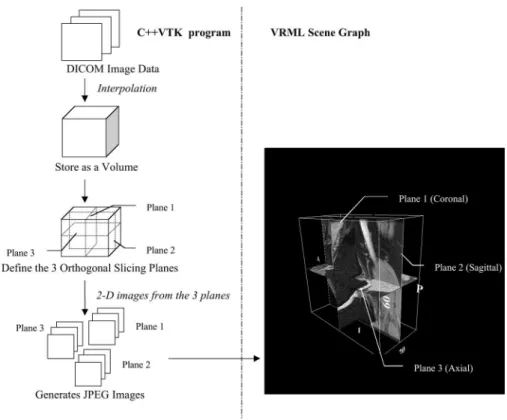
A VRML 3-D slicing interface was developed by our group to allow orthogonal 2-D images to be displayed with the 3-D models. A Web-based approach was adopted. As described ear-lier, VRML is normally used for visualizing 3-D models. The main reason for this is that VRML is already the standard for transmitting 3-D content on the Internet. The VRML 3-D slicing program is divided into two main parts: 1) a backend program to produce images from the three orthogonal planes and 2) a VRML scene graph to visualize the images in the 3-D scene. The first part of the program (written in C++) uses VTK ob-jects to generate 2-D images from the volume. The program was integrated with the 3-D reconstruction program. In a sim-ilar manner to the reconstruction program, a data processing pipeline was set up as shown in Fig. 9. Referring to the figure, in the pipeline DICOM image data are first stored as a volume. Three orthogonal planes are then defined (i.e., Planes 1–3). For medical images, the planes are referred to as the Coronal, Sagit-tal and Axial planes, respectively. Slicing along the three-planes is carried out by using the vtkImageReslice object provided by VTK. 2-D images are created by assigning values to each 2-D pixel in the plane by interpolating the voxels of the volume data where they are intersected by the plane. The resulting pixels are interpolated using cubic interpolation. A series of 2-D images, in JPEG format (using the VTK JPEG export function) are gen-erated for each plane. (The JPEG format was chosen because DICOM image format is not currently supported by a VRML plug-in.) Two sets of images are stored, 2-D lossy JPEG im-ages and DICOM imim-ages. The JPEG imim-ages are stacked in the form of a 3-D model under VRML. This stack can be rotated and orthogonally sliced as if it were a full 3-D model. This is geometrically linked to three orthogonal views (i.e., the full resolution DICOM images) (see Fig. 11).
A VRML scene graph was written to allow the JPEG images to be displayed in the 3-D scene and manipulated for the pur-poses of viewing. A bounding box is defined, based on the size of the 3-D model, so that the images can be synchronized with the model. The purpose of the bounding box is to define the 3-D space that the voxels of the volume data occupy. Three or-thogonal planes were created using the VRML dragging sensor (i.e., PlaneSensor). This allows the planes to be dragged with a pointing device (here, a mouse). The planes are restricted within the bounding box. Based on the coordinates of the mouse po-sition, when a plane is dragged the new location of the plane is calculated and updated. Each set of 2-D images are derived from one orthogonal plane. Hence, the slicing plane movement is restricted to only one axis and bounded by the bounding box. The coronal plane is only allowed to slide in the anterior and posterior directions within the bounding box limits.
The images are then mapped to the planes using the VRML texture mapping feature and inline function. Based on the po-sition of the plane, the images are updated. An array of texture links is stored for each plane. By calculating the array number,
Fig. 8. Sample screenshots of user interface for selection of images using image thumbnails. (a) Screenshot showing the MR knee images thumbnails. (b) Screenshot showing the related set of histology images of the cartilage.
using the new position of the plane, the respective image texture is updated. In addition, the slice number is displayed to provide a reference for the user in relation to the 2-D images in the viewer. Finally, the slice number for each plane is updated by means of the same calculation as used for the texture updating.
H. 2-D DICOM Viewer
It is important that the client application is portable so that it can be used on different platforms. The Java programming
language was chosen for the viewer because of its portability. The result is a viewer that can display 2-D DICOM images on a Web browser. In addition, Java provides a set of image pro-cessing classes that can be used to manipulate 2-D images. The applet for this viewer was developed for a PC using NetBean IDE (Integrated Development Environment) version 3.6. It uti-lizes the standard AWT (abstract window toolkit) and API, as well as custom classes developed by our group for the project. It reads the standard DICOM images that reside on the server and
Fig. 9. Pipeline of VRML 3-D Slicing. The DICOM image data are either original or following standards conversion (see Fig. 3).
renders the images on the client. The Java applet is embedded in the Web browser. This enables DICOM images to be decoded and displayed. Three applet viewers are embedded into three separate frames and placed below the 3-D viewer. The frame displays DICOM images from the axial, sagittal and coronal planes, respectively.
Different brightness and contrast values are used in clinical practice to view different types of tissue, e.g., bone and soft tissue. Hence, windowing and leveling (i.e., changing the con-trast and brightness of an image) is an important feature of any DICOM viewer. The viewer allows the gray levels of the image to be displayed on the monitor. These can be changed by drag-ging the mouse in the image window—i.e., dragdrag-ging the mouse in the vertical direction controls the window value; whereas, movement in the horizontal direction changes the level. The mouse position co-ordinates are displayed. These are updated when the user moves the mouse pointer over the image. This operation allows the user to note points of interest on the image. In addition, the window and level values and the name of the image are displayed.
III. RESULTS
The user interface developed in the project allows the user to view both 2-D images and 3-D models. Standard HTML was used to create the layout of the viewing interface. In the standard layout, a large 3-D view is created, together with three 2-D images from the three orthogonal planes. The GUI is viewed on a Java enabled Web browser, i.e., Internet Explorer, with a third party VRML plug-in, i.e., Cortona, on a standard PC. Most VRML plug-ins take advantage of client-side graphics
Fig. 10. Two rendered scenes from 3-D slicing displaying images from three orthogonal planes. (a) MR knee volume images from a normal volunteer. (b) MR knee volume images from a patient with OA.
Fig. 11. Viewing interface with a 3-D window showing the surface ren-dered 3-D models aligned with images from VRML 3-D slicing and three windows displaying MR images from the three orthogonal planes. (a) Knee data from the volunteer with normal knee. (b) Knee data from a patient with OA.
hardware, if present. This helps to tackle the server-load problem and the interaction lag time.
A. Visceral Level—Knee Osteoarthritis
As previously described, users can visualize volume data through 3-D slicing in Web browser. Fig. 10(a) shows a ren-dered scene of the 3-D slicing performed on MR knee images from a normal volunteer. Fig. 10(b) shows images from a pa-tient with OA. Two datasets were used in the example. The first dataset comprised 40 images (slices). The 40 slices were cho-sen from the overall dataset because they showed the cartilage. Similarly, 16 images for the OA dataset were used.
For the data from the normal volunteer, three separate VRML files were generated by the 3-D reconstruction program from the three sets of segmented DICOM images (i.e., femur, tibia, and femoral cartilage). The three separate models (the femur, tibia, and femoral cartilage) were combined into a common scene graph, together with VRML 3-D slicing. This is shown in Fig. 11. For the data from the patient with OA, two separate VRML files were generated from two sets of segmented DICOM images, i.e., femur and tibia. This allows the flexibility of adding
Fig. 12. (a) 3-D slicing of confocal microscopy images of the arterial wall. (b) 3-D slicing of confocal microscopy images of the endothelial nuclei in red.
Fig. 13. Viewing interface. The top 3-D window shows the surface of the arterial wall and the endothelial nuclei (in red). The bottom three windows display the images from the three orthogonal planes.
and removing any model from the 3-D scene. Hence, the user can view and examine the femoral cartilage separately from any angle, without the femur or tibia. The images are updated based on the position of the planes. Functions such as zooming and ro-tation can be performed interactively. It is important to note that, as the images in the 3-D scene are in lossy JPEG format, the user needs to study full resolution 2-D DICOM images to confirm ob-servations from the 3-D scene. The slice number of each image is displayed so that the user can refer to the DICOM images in the 2-D viewer simultaneously. Windowing and leveling adjust-ment was achieved by dragging the mouse over the 2-D images. The Java applet is geometrically synchronized with the 3-D viewer.
In many clinical applications, the ability to view geometri-cally linked 2-D and 3-D images is of considerable benefit to diagnosis. The significance of Figs. 10 and 11 is that we pro-vide this functionality in a Web-based interface, allowing for significant benefits in clinical correlation of the 2-D images to the advanced findings in the 3-D reconstructions, even when viewing the studies over a Web browser at the clinics or the out-patient department. This takes the clinical benefits of advanced
integrated 2-D and 3-D imaging outside of the reading room to the point of care in the clinics.
B. Cellular Level—Atherosclerosis
Furthering the clinical benefits of having all of the patient’s clinical and imaging datasets at the physician’s fingertips, our system allows for the seamless integration of the imaging at the visceral level described above down to the cellular level at criti-cal regions of clinicriti-cal interest. In this example the user was able to visualize volume data acquired from confocal microscope through 3-D slicing. Fig. 12 shows two rendered scenes of the 3-D slicing showing the images of the aorta arterial wall and endothelial nuclei. Three orthogonal planes are displayed in the 3-D scene and each plane can be dragged individually. Hence, it is possible to view and examine the surface contour of the arterial wall. This allows the location of the endothelial cells to be identified.
Two separate VRML files were generated from the two sets of converted DICOM images—i.e., the surface of the arterial wall and endothelia nuclei. The images obtained from Plane 1 were used for the 3-D reconstruction of the surface of the arterial wall. The two separate models were combined into a common scene graph, together with images from the orthogonal planes (this is shown in Fig. 13). Referring to the Fig. 13, the location and shape of the endothelial nuclei can be observed with respect to the surface of the arterial wall. The example illustrates that with the viewing interface it is possible to navigate within the 3-D scene to examine the endothelial nuclei spatial distribution. In addition, the user can observe the structure of the nuclei— and, particularly, cells that are not perpendicular to the confocal acquisition plane. This allows more accurate measurements to be performed.
IV. DISCUSSION
In this paper we describe a Web-based multilayered visual-ization interface to view data from multimodalities across the BC. Data from the visceral and cellular level, i.e., MR knee images for OA and images acquired from confocal microscopy for the study of atherosclerosis were successfully visualized.
As VRML and Java were used to create the user interface, the only software requirement for the user is a Java/VRML capable Web browser. The advantage of this design is that it can be ported to different Web browsers easily as standard Web-based technologies such as HTML, Javascript and VRML were used. Furthermore, in a Web-based architecture, the client does not need to perform extensive computation. Hence, the client need only be standard PC.
We have developed the viewing interfaces for 2-D and 3-D image data, segmentation [33], 3-D reconstruction and 3-D slic-ing programs. For the viewslic-ing interfaces, we have written the VRML scene graphs that make it possible to slide orthogonal image planes within a 3-D volume using a mouse. An applet DICOM viewer to display DICOM images has also been devel-oped as part of our viewing interfaces. Our 3-D reconstruction and 3-D slicing programs have been implemented using objects from VTK to produce the VRML 3-D model and images
re-quired. The system has been tested using the image data from the two examples that are presented.
The 3-D reconstruction process can be either surface or vol-ume rendering. This process should remain common for differ-ent VPs. The reconstruction technique in our implemdiffer-ented ver-sion was based on surface rendering. It is supported by VRML and is less computationally expensive than volume rendering. The surface rendered models are visualized interactively on standard PCs. The next step will involve creating a 3-D vol-ume model. However, VRML generally only supports surface representation. A few studies have been reported in the litera-ture, which describe ways for VRML to support volume ren-dering [25], [26]. The added feature in X3-D, i.e., 3-D texture mapping may allow Web-based volume rendering.
The Java programming language is designed to work on a variety of hardware without recompilation and with high reli-ability. These qualities facilitate the creation of Internet and/or network-based applications. Any machine that has a Java com-patible Web browser can be used to view the applet, regardless of the operating system. This guarantees that the most current version of the system is being used and eliminates the need to install software on a client computer. The 2-D DICOM Java applet was developed by our group to allow viewing of DI-COM images using a Web browser. The version of 2-D viewer which was used for examples in this paper has a limited set of 2-D image viewing tools—additional tools can be easily implemented.
The layout of the interface is somewhat similar to that of 3-D Slicer [12]. However, our layout allows user to easily com-pare the 2-D images and the 3-D rendered scene. 3-D Slicer is a software package that was primarily designed for image-guided medicine. Our implementation takes a fully Web-based approach. This has the major advantage of allowing universal access to and visualization of a wide range of patient data across the BC (i.e., at multiple levels). An additional advantage is that the client workstation can be platform independent, as long as the Java compliant Web browser is supported.
Image datasets from two levels of the BC, i.e., visceral and cellular level were successfully visualized. One of the main objectives is that the interface developed can be applied to all the levels of the BC. Data from different imaging modalities for the rest of the levels are needed to further develop the interface so that it can be used across the BC.
An important aspect of the multilayer visualization is to al-low user to navigate from one layer to another seamlessly. Ad-ditional work is required to create the interface between VPs from different levels of the BC as shown in Fig. 2. The interface allows user to navigate from one level to the other—i.e., in the example, zooming from the organ level to the tissue level and vice versa. With the increasing number of data types that will be brought into CISs in the future, a Web-based user interface, which allows clinicians to find and navigate through data with ease, will be important to aid the clinical process. This interface design should be as generic as possible, so that it can be used for various VPs. This will provide clinicians with the ability to move seamlessly through the different levels of the BC, while maintaining geometric integrity.
The overall aim is that future CIS development should not only cover the various levels of the BC from an imaging stand-point, but, also, incorporate modeling techniques (e.g., physi-ological systems and systems biology models; as well as, e.g., 3-D models of proteins), as illustrated in Fig. 2. The use of model to compare predicted results with actual results will, we believe, be an important feature of future clinical information systems.
In summary, we believe that more advanced CISs are likely to be based on the schema illustrated in Fig. 2. The concept of the BC means that clinicians and healthcare systems will be able to use a much broader range of data and information from a single point of access.
ACKNOWLEDGMENT
The authors would like to thank Dr. P. Weinberg and A. Bond for providing the cellular images used in our study.
REFERENCES
[1] E. S. Landeret al., “Initial sequencing and analysis of the human genome,”
Nature, vol. 409, pp. 860–921, 2001.
[2] R. I. Kitney,The Role of Engineering in the Post-Genomic Age. London, UK: Roy. Acad. Eng., 2003, pp. 1–32.
[3] , “The double helix, and the role of engineering and physical science in the post genomic age,” presented at the IFMBE World Congr. Med. Physics Biomed. Eng., Sydney, Australia, 2003.
[4] R. I. Kitney and C.-L. Poh, “Geometric framework—Linking different levels of the biological continuum,” in Proc. IEEE 27th Annu. Conf. Eng. Med. Bio., Shanghai, China, Sep. 1–4, 1–4, 2005, pp. 4068– 4071.
[5] P. F. Nielsen and M. D. Halstead, “The evolution of CellML,” inProc. 26th Annu. Int. Conf. IEEE Eng. Med. Biol. Soc., 2004, vol. 2 and 7, pp. 5411–5414.
[6] R. I. Kitney, S. Claesen, and J. Halls, “A comprehensive Web-based patient information environment,” inProc. 23rd Annu. Int. Conf. IEEE Engineering Medicine Biology Society,Oct. 25–28, 2001, vol. 4, pp. 3584– 3585.
[7] S. Claesen, R. I. Kitney, R. B. Shrestha, and J. Halls, “Web based clinical information systems,” presented at the IFMBE World Congr. Med. Phys. Biomed. Eng., Sydney, Australia, 2003.
[8] R. I. Kitney, S. Claesen, and R. B. K. Shrestha, “An overview of web based clinical information systems,” presented at the IFMBE World Congr. Med. Phys. Biomed. Eng., Sydney, Australia, 2003.
[9] R. B. K. Shrestha, R. I. Kitney, S. Claesen, and J. M. Halls, “Inte-grated PACS—A holistic approach to patient care in radiology,” inProc. IFMBE MEDICON and HEALTH TELEMATICS, Ischia, Italy, 2004, pp. 105–107.
[10] R. I. Kitney, “Clinical information systems (CIS) overview,” inProc. IFMBE MEDICON and HEALTH TELEMATICS, Ischia, Italy, 2004, pp. 91–94.
[11] R. A. Robb and D. P. Hanson, “ANALYZE: A software system for biomed-ical image analysis,” inProc. 1st Conf. Vis. Biomed. Comput., 1990, pp. 507–518.
[12] D. Gering, A. Nabavi, R. Kikinis, W. E. L. Grimson, N. Hata, P. Everett, F. Jolesz, and W. Wells, III, “An integrated visualization system for surgi-cal planning and guidance using image fusion and interventional imaging,” presented at Med. Image Comput. Comput.-Assisted Intervention Conf. (MICCAI), Cambridge, U.K., 1999.
[13] E. Keeve, T. Jansen, B. Rymon Lipinski, Z. Burgielski, N. Hansen, L. Ritter, and M. Lievin, “An open software framework for medical ap-plications,” inProc. IS4TM, 2003, pp. 302–310.
[14] A. Rosset, L. Spadola, and O. Ratib, “OsiriX: An open-source software for navigating in multidimensional DICOM images,” J. Digit. Imag., vol. 17, no. 3, pp. 205–216, 2004.
[15] Advanced Visual Systems (2005, Sep.). [Online]. Available: http://www. avs.com/index_wf.html
[16] W. Schroeder, K. Martin, and W. Lorensen,The Visualization Toolkit: An Object-Oriented Approach to 3-D Graphics, 2nd ed. Englewood Cliffs, NJ: Prentice-Hall, 1998.
[17] Insight Toolkit Homepage (2005, Sep.). [Online]. Available: http://www. itk.org
[18] B. N. Steele, M. T. Draney, J. P. Ku, and C. A. Taylor, “Internet-based system for simulation-based medical planning for cardiovascular dis-ease,”IEEE Trans. Inf. Technol. Biomed., vol. 7, no. 2, pp. 123–129, Jun. 2003.
[19] K. Engel, P. Hastreiter, B. Tomandl, K. Eberhardt, and T. Ertl, “Combining local and remote visualization techniques for interactive volume rendering in medical applications,” inProc. IEEE Vis.,Oct. 8–13, 2000, pp. 449–452, 587.
[20] P. Golland, R. Kikinis, M. Halle, C. Umans, W. E. L. Grimson, M. E. Shen-ton, and J. A. Richolt, “AnatomyBrowser: A novel approach to visualiza-tion and integravisualiza-tion of medical informavisualiza-tion,” Comput.-Assisted Surg., vol. 4, pp. 129–143, 1999.
[21] K. Engel, R. Westermann, and T. Ertl, “Isosurface extraction techniques for Web-based volume visualization,” inProc. IEEE Vis.,Oct. 24–29, 1999, pp. 139–519.
[22] P. A. Warrick and W. R. J. Funnell, “A VRML-based anatomical visual-ization tool for medical education,” IEEE Trans. Inf. Technol. Biomed., vol. 2, no. 2, pp. 55–61, Jun. 1998.
[23] G. T. Herman, “A survey of 3-D medical imaging technologies,” IEEE Eng. Med. Biol. Mag., vol. 9, no. 4, pp. 15–17, Dec. 1990.
[24] R. Shahidi, B. Lorensen, R. Kikinis, J. Flynn, A. Kaufman, and S. Napel, “Surface rendering versus volume rendering in medical imaging: Tech-niques and applications,” inProc. IEEE Vis., Nov. 1, 1996, pp. 439– 440.
[25] J. Behr and M. Alexa, “Volume visualization in VRML,” inProc. 6th Int. Conf. 3-D Web Technol., Paderbon, Germany, 2001, pp. 23–27. [26] F. Dong, G. J. Clapworthy, and M. Krokos, “Volume rendering of fine
de-tails within medical data,” inProc. IEEE Vis.,Oct. 21–26, 2001, pp. 387– 577.
[27] R. I. Kitney, P. M. M. Cashman, and M. E. Carter, “Fast automated segmentation and visualization methods for MR images of the knee joint in arthritis,” inProc. 20th Annu. Int. Conf. IEEE Eng. Med. Biol. Soc., Nov. 1, 1998, vol. 2, pp. 559–562.
[28] P. M. M. Cashman, R. I. Kitney, M. A. Gariba, and M. E. Carter, “Auto-mated techniques for visualization and mapping of articular cartilage in MR images of the osteoarthritic knee: A base technique for the assessment of microdamage and submicro damage,”IEEE Trans. Nanobiosci., vol. 1, no. 1, pp. 42–51, Mar. 2002.
[29] A. A. Kshirsagar, P. J. Waston, N. J. Herrod, L. D. Tyler, and J. D. Hall, “Measurement of localized cartilage volume and thickness of human knee joints by computer analysis of three-dimensional magnetic resonance images,” Investigat. Radiol., vol. 33, no. 5, pp. 289–299, 1998.
[30] C. Kauffmann, P. Gravel, B. Godbout, A. Gravel, G. Beaudoin, J.-P. Ray-nauld, J. Martel-Pelletier, J.-P. Pelletier, and J. A. de Guise, “Computer-aided method for quantification of cartilage thickness and volume changes using MRI: Validation study using a synthetic model,” IEEE Trans. Biomed. Eng., vol. 50, no. 8, pp. 978–988, Aug. 2003.
[31] M. L. Paglia, J. H. Kuiper, J. B. Richardson, L. McCall, and C. Ruggiero, “3-D processing of MRI images of the knee for computer aided surgery planning,” inProc. IEEE-EMBS Special Topic Conf. Mol., Cell. Tissue Eng.,Jun. 6–9, 2002, pp. 188–189.
[32] A. Losch, F. Eckstein, M. Haubner, and K.-H. Englmeier, “A noninvasive technique for 3-dimensional assessment of articular cartilage thickness based on MRI—Part 1: Development of a computational method,”Magn. Reson. Imag., vol. 15, pp. 795–804, 1997.
[33] C.-L. Poh and R. I. Kitney, “Viewing interfaces for segmentation and measurement results,” inProc. 27th Annu. Int. Conf. IEEE Eng. Med. Biol. Soc., Shanghai, China, Sep. 1–4, 2005, pp. 5132–5135.
[34] VRML97 Specification (2005, Jan.). [Online]. Available: http://www. web3d. org/x3d/specifications/vrml/
[35] X3D specification (2005, Sep.). [Online]. Available: http://www.web3d. org/x3d/specifications/x3d_specification.html
[36] S. L. Al-Musawi, J. Bishton, J. Dean, S. Williams, S. G. Cremers, and P. D. Weinberg, “Evidence for a reversal with age in the pattern of near-wall blood flow around aortic branches,”Atherosclerosis, vol. 172, pp. 79–84, 2004.
[37] W. Lorensen and H. Cline, “Marching cubes: A high resolution 3-D sur-face construction algorithm,” Comput. Graph., vol. 21, pp. 163–169, 1987.
Chueh-Loo Pohwas born in Singapore in 1976. He received the B.Eng. degree (first class honors) in electrical and electronics engineering from Nanyang Technological University (NTU), Singapore, in 2001. Currently, he is working toward the Ph.D. degree in bioengineering with an emphasis on medical image visualization in the Department of Bioengineering, Imperial College, London, U.K.
He was an Information Technology (IT) Analyst with Accenture Pte Ltd, specializing in IT consult-ing, until the middle of 2003. He received an NTU overseas scholarship in 2003.
Richard I. Kitneyreceived the Ph.D. degree from Imperial College, London, U.K., and the D.Sc. de-gree from the University of London, London, U.K., in 1972 and 1993, respectively, both in electrical en-gineering.
He is currently a Professor of Biomedical Sys-tems Engineering and the Head of the Biomedical Information Technology Group, Department of Bio-engineering, Imperial College. During 1991–2001, he was the Founding Head of the Department of Bio-Engineering, Imperial College, and is currently the Dean of the Faculty of Engineering, Imperial College. Since 1991, he has been a Visiting Professor at Massachusetts Institute of Technology (MIT), Cambridge, and is the Codirector of the Imperial College-MIT International Consortium for Medical Information Technology. He has authored over 300 papers in the fields of biomedical signal and image processing, medical informatics, and the application of computers to healthcare.
Dr. Kitney was appointed a Fellow of The Royal Academy of Engineering (FREng) in 1999 and is the Chairman of Academy’s UK Focus for BioEngi-neering. He was awarded The Order of the British Empire (OBE) in the Queen’s Birthday Honors List for services to information technology in health care in June 2001. He was appointed a Fellow of the International Academy of BioMedical Engineering (IAMBE) (this is the highest honor bestowed by the International Federation of BioMedical Engineering Societies) in 2003. He was recently elected a Fellow of the American Institute of Medical and Biological Engineering (AIMBE).
Rasu B. K. Shresthawas born in Banepa, Nepal, in 1973. He received the graduate degree in medicine with a full Colombo Plan Scholarship from LLRM Medical College, CCS University, Meerut, India, in 1997.
He practiced internal medicine and worked to-ward radiology. He was a Resident Doctor in Internal Medicine at the Ram Manohar Lohia Hospital, New Delhi, India, after completing the Internship. He was then a Resident Doctor in Radiology at the RIPAS Hospital, Bandar Seri Begawan, Brunei. Soon after that, he joined the University of Southern California, Los Angeles, as a Clinical Research Fellow, where he is currently the Radiology Informatics Director. His research interests include the advancement of radiology and medical informat-ics, and the optimization of clinical workflow using informatics.
Dr. Shrestha has been a Member of the Radiological Society of North America (RSNA) since 2001, and has presented numerous papers at the annual congress in Chicago, where he has been recognized with various awards through the years. He also received the Roger Bauman Best Scientific Paper Award at the Society for Computer Applications in Radiology (SCAR) Conference in Van-couver, BC, Canada, in 2004.