AISMIG—an interactive server-side molecule
image generator
Andreas Bohne-Lang, Wolf-Dieter Groch
1and Rene´ Ranzinger*
German Cancer Research Center Heidelberg, Central Spectroscopy—Molecular Modeling, Im Neuenheimer Feld 280, D-69120 Heidelberg, Germany and1University of Applied Sciences, Department of Computer Science, Scho¨fferstr. 8b, D-64295 Darmstadt, Germany
Received February 13, 2005; Revised March 19, 2005; Accepted March 28, 2005
ABSTRACT
Using a web browser without additional software and generating interactive high quality and high resolu-tion images of bio-molecules is no longer a problem. Interactive visualization of 3D molecule structures by Internet browsers normally is not possible without additional software and the disadvantage of browser-based structure images (e.g. by a Java applet) is their low resolution. Scientists who want to generate 3D molecular images with high quality and high resolu-tion (e.g. for publicaresolu-tions or to render a molecule for a poster) therefore require separately installed software that is often not easy to use. The alternative concept is an interactive server-side rendering application that can be interfaced with any web browser. Thus it combines the advantage of the web application with the high-end rendering of a raytracer. This article addresses users who want to generate high quality images from molecular structures and do not have software installed locally for structure visualization. Often people do not have a structure viewer, such as RasMol or Chime (or even Java) installed locally but want to visualize a molecule structure interactively. AISMIG (An Interactive Server-side Molecule Image Generator) is a web service that provides a visualiza-tion of molecule structures in such cases. AISMIG-URL: http://www.dkfz-heidelberg.de/spec/aismig/.
INTRODUCTION
The PDB (http://www.pdb.org/) (1) currently contains>30 000 3D structures of bio-molecules (March 22, 2005). Those who want to look at one of these 3D datasets need additional software to visualize the structure file that is stored in the database. Modern web browsers like Mozilla, Internet
Explorer or Opera normally display only HTML code and images directly. In order to display other complex data the web browser uses separate software components. These soft-ware components could be Java applets, plug-ins or an external helper application. The disadvantage of Java applets and plug-ins embedded into the layout of the displayed webpage by the web browser is the low resolution of the images—normally <100 d.p.i. (dots per inch). Often screenshots made for pub-lications are not accepted for printing. Thus people need to install dedicated programs for rendering molecular pictures, but often these programs are difficult to use and a lot of the functions can only be activated by programming scripts. This is only acceptable for intensive use and not for use from time to time. A pioneering webpage from 1995 called ‘Molecules R Us’ now known as ‘Molecules To Go’ (http://molbio.info.nih. gov/cgi-bin/pdb) combines a full text within the PDB with a simple structure presentation and the Jena Image Library data-base (http://www.imb-jena.de/IMAGE.html) (2–4) offers for the generation of mono or stereo PDF images with a fixed representation style either in a default orientation or via a VRML interface in a user-selected orientation, a related option that is based on MolScript.
At the moment there is no way to get a high quality and high resolution 3D structure image with a user-selected view of a molecule via Internet without using additional locally installed software.
MATERIALS AND METHODS
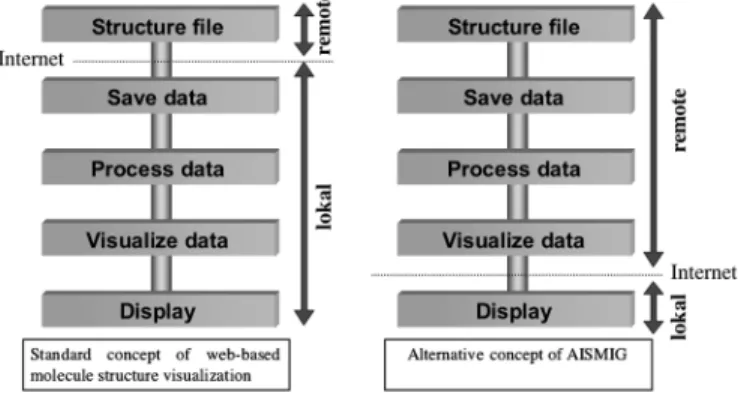
The alternative concept splits the web interface (client) from the rendering program (server). The web browser only gets HTML and JavaScript code (which normally every browser can handle) and an image of the molecule (Figures 1 and 2). The user has different methods to upload a 3D structure of a molecule in PDB format to the web applications server. The PDB format contains, next to the atom type, thex,yand
zco-ordinates of the 3D structure. For manual file upload a normal HTML file upload interface is accessible. In addition to
*To whom correspondence should be addressed. Tel:+49 6221 42 4670; Fax:+49 6221 42 2995; Email: [email protected]
ªThe Author 2005. Published by Oxford University Press. All rights reserved.
The online version of this article has been published under an open access model. Users are entitled to use, reproduce, disseminate, or display the open access version of this article for non-commercial purposes provided that: the original authorship is properly and fully attributed; the Journal and Oxford University Press are attributed as the original place of publication with the correct citation details given; if an article is subsequently reproduced or disseminated not in its entirety but only in part or as a derivative work this must be clearly indicated. For commercial re-use, please contact [email protected]
this method a PDB file can be fetched by the four-character PDB ID. Unless the files are stored locally they are automat-ically downloaded from the Protein Database server. Further-more, AISMIG (An Interactive Server-side Molecule Image Generator) provides a Simple Object Access Protocol (SOAP) interface to be fully integrated with other web applications available on the Internet. Thus molecules generated on other servers or stored in other databases can be automatically uploaded to the AISMIG server and directly accessed for the rendering process. See the carbohydrate builder web tool Sweet II (5) (http://www.dkfz-heidelberg.de/spec/sweet2/) as an example. At the server side, a script fetches the request from the user and after checking if the file is in PDB format, a script calls the free program PyMol (http://pymol.sourceforge.net/) to generate the molecular image. At this first stage the user can manipulate the color and shape of the molecule interactively. The menu is fully based on HTML and JavaScript. At this stage the molecule can be rotated, translated and zoomed. The menu structure (Figure 3) is quite similar to the RasMol (6,7) menu panel and provides the standard manipulation functions. The user can access parts of the protein by atom number, atom type, group name, group number and chain. Coloring by struc-ture (coloring the sheets, turns and loops) is also possible. For the shape of the molecule we provide the following modes: Line, sticks, ribbon and cartoon (only proteins), sphere, surface, dots and mesh. A combination of the single elements is possible. The system provides two kinds of functionality
of macros: dynamic and static. Static macros like color by b-factor or color by Eisenberg hydrophobic scale are the same for all molecules. Dynamic macros, in contrary, are generated dynamically at starting time by other service programs. An example of one of the macros is the presentation of a single ligand. Therefore the program needs to analyze the molecule and writes the appropriate data to the dynamic macro.
If the user has the molecule in the right perspective, he switches to the second stage where he needs to set the rendering options. At this point PyMol produces the molecule as a set of 3D objects that are loaded and parsed by the second stage program part. At this stage, the user can only influence the rendering and scene parameters like image size, additional spotlight or texture elements. The raytracer for generating the high quality and high resolution pictures is the free program PovRay (http://www.povray.org).
If all settings are established, the user can start the process of rendering the final image. For this process he needs to enter his email address and he gets an email with a link to the result page. Until the image is ready, the user can see the progress (as a percentage) if the job is running, or the queue position that is displayed. This procedure is necessary because the rendering time varies from seconds to several hours. Especially complex surfaces need more time to be rendered. The web server sub-mits the rendering job to a small Linux cluster where a modi-fied version of PovRay runs. A batch system ensures that the system is not overloaded.
RESULTS
An alternative method of Internet-based display of 3D structures of molecules has been developed. The AISMIG web application is an implementation of this alternative concept and the free service is available at http://www.dkfz-heidelberg.de/spec/aismig/.
Figures 3 and 4 illustrate the object generation at stage 1, the object rendering at stage 2 and the final image. Figure 5 demonstrates the different possibilities of the web application. By uncoupling the object generation from the object render-ing it is possible to manipulate the scene and add a second light source or map some textures on the molecule. (Some nice images can be found at the AISMIG homepage in the art gallery.)
The AISMIG services can easily be linked to other web applications or databases by using the SOAP interface in order to upload a 3D PDB file to the webserver. An example of how to connect to another web-application by this mechanism is demonstrated by the Sweet II (5) carbohydrate builder web tool where the user can create 3D structure files of carbo-hydrates and can visualize the generated structure by AISMIG.
DISCUSSION
The concept has advantages and disadvantages, as does every concept. In the following section the alternative concept will be discussed by comparison to other current concepts like Java applets, plug-ins and external helper tools. Java applets have the advantages that they are nearly independent of browser and operating system. The standard Java applets for molecule visualization are Jmol (http://Jmol.sourceforge.net/), WebMol Figure 1. Standard and alternative concept of web-based structure
visualization.
(8) (http://www.cmpharm.ucsf.edu/walther/webmol.html) and PDBjViewer (9) (http://www.pdbj.org/PDBjViewer/, http://ef-site.protein.osaka-u.ac.jp/eF-site/). PDBjViewer is the latest applet and uses the Java3D extension for surface generation. At the moment the Java virtual machine is a plug-in for web browsers but plug-in former times this was different hence it is listed in the table at this point. The most often used plug-in for visualization of molecule 3D structures is CHIME (http://www.mdl.com/products/framework/chime/) but plug-ins are highly operating system and browser depen-dent. Also, Java applets as plug-ins are not able to generate high-resolution images besides they need to be installed on the client system. One advantage of these methods is that the applet or the plug-in are included in the layout of the web page and can interact with other components. More inde-pendent are external helper programs. They are launched by the web browser and run parallel to the web browser. In this case they can handle only one parameter—the path to a file that is downloaded and stored temporarily. The advant-age of external programs is that they can render large imadvant-ages and often they have powerful functions for working with small molecules or with proteins. There are lots of programs
for displaying 3D structures of molecules and normally every molecular viewing program can be used by this mechanism (that the webserver calls an external helper program with a file name as parameter). The most popular programs are: RasMol (http://www.openrasmol.org/ and http://www. umass.edu/microbio/Rasmol/), Swiss-PDB viewer (10) and PyMol.
The greatest advantage of the interactive server-side image generation concept (AISMIG) is that no additional software in addition to the web browser is necessary to view and process the molecules, thus everyone can visualize and manipulate the generated molecule structure. Furthermore rendering a molecule in high resolution (e.g. 1200 d.p.i.) for a publication or poster poses no problem. Software modules need only be installed once at the server side and all users of the service can use it. By using PyMol for image generation it is possible to generate complex surfaces as PyMol uses OpenGL with all its advantages.
However, this server-side image generation method requires for each interaction a request to the server and at every inter-action an image is generated and transmitted to the client. The images are small but the sum of all can be quite large. Figure 3.AISMIG—stage 1 where the molecule shape and coloring can be manipulated.
At the moment AISMIG sends a JPG image with an average size of 15 KB for each request. With one of the menu entries the user can download a PNG image in a better quality that is 60 to 140 KB. It is slower than client-side running software where real time rotation by mouse movements is possible.
CONCLUSION
An alternative concept similar to the current concepts (Java, plug-ins and external application) was developed and imple-mented. AISMIG will complement the current concepts with its advantages (no additional software installation and render-ing of high-resolution pictures), but it was not designed to replace any of the existing methods for molecule visualization. AISMIG enables the possibility to visualize a molecular 3D structure with only a standard web browser without requiring local installation of any additional structure viewer software. AISMIG helps even those who are not computer experts to see 3D molecule structures provided by a web service or web-based databases.
Figure 4.AISMIG—stage 2 where the scene options can be set.
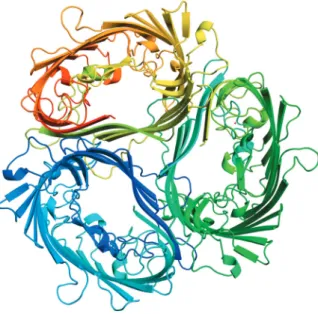
Figure 5.1A0S—sucrose-specific porin rendered in high quality and high resolution 4650·3300 pixel with the ‘color by rainbow’ function.
ACKNOWLEDGEMENTS
We would like to thank Warren L. DeLano (DeLano Scientific LLC, San Carlos, CA) for developing PyMol and the POV-Ray team for developing POV-POV-Ray, Persistence of Vision Raytracer Pty. Ltd (Williamstown, Victoria, Australia). Funding to pay for the developing and the Open Access publication charges for this article was provided by German Research Council (Deutsche Forschungsgemeinschaft, DFG).
Conflict of interest statement.None declared.
REFERENCES
1. Berman,H.M., Westbrook,J., Feng,Z., Gilliland,G., Bhat,T.N., Weissig,H., Shindyalov,I.N. and Bourne,P.E. (2000) The Protein Data Bank.Nucleic Acids Res,28, 235–242.
2. Suhnel,J. (1996) Image library of biological macromolecules.
Comput. Appl. Biosci.,12, 227–229.
3. Reichert,J., Jabs,A., Slickers,P. and Suhnel,J. (2002) The IMB Jena Image Library of biological macromolecules.Nucleic Acids Res.,
28, 246–249.
4. Reichert,J. and Suhnel,J. (2002) The IMB Jena Image Library of Biological Macromolecules: 2002 update.Nucleic Acids Res.,
30, 253–254.
5. Bohne,A., Lang,E. and von der Lieth,C.W. (1999) SWEET—WWW-based rapid 3D construction of oligo-and polysaccharides.Bioinformatics,15, 767–768.
6. Sayle,R.A. and Milner-White,E.J. (1995) RASMOL: biomolecular graphics for all.Trends Biochem Sci.,20, 374.
7. Bernstein,H.J. (2000) Recent changes to RasMol, recombining the variants.Trends Biochem Sci.,25, 453–455.
8. Walther,D. (1997) WebMol–a Java-based PDB viewer.Trends Biochem Sci.,22, 274–275.
9. Kinoshita,K. and Nakamura,H. (2004) eF-site and PDBjViewer: database and viewer for protein functional sites.Bioinformatics,
20, 1329–1330.
10. Kaplan,W. and Littlejohn,T.G. (2001) Swiss-PDB Viewer (Deep View).Brief Bioinform.,2, 195–7.